. 2021 Nov 16;37(7):109994.
doi: 10.1016/j.celrep.2021.109994.

Gene regulatory networks controlling temporal patterning, neurogenesis, and cell-fate specification in mammalian retina

Affiliations

Gene regulatory networks controlling temporal patterning, neurogenesis, and cell-fate specification in mammalian retina

Pin Lyu et al. Cell Rep. .

Abstract

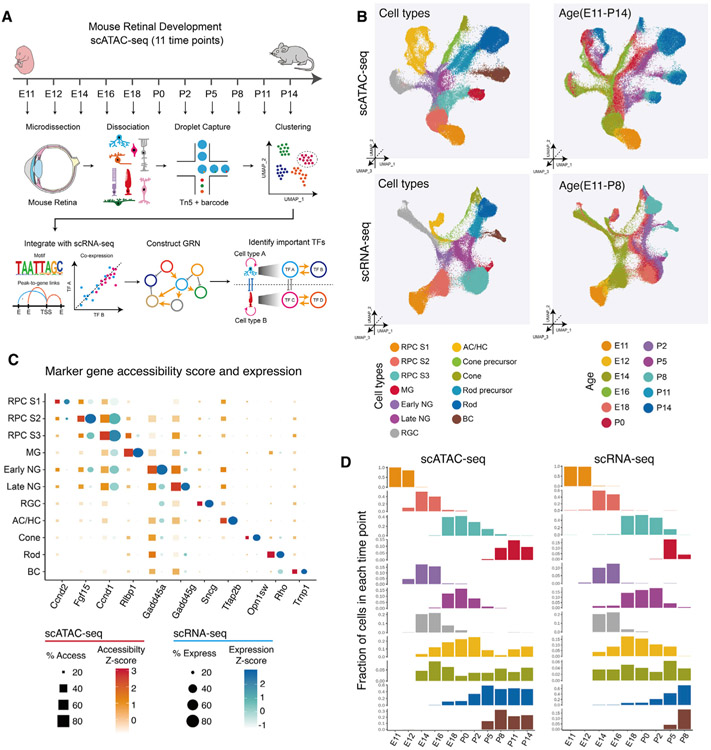
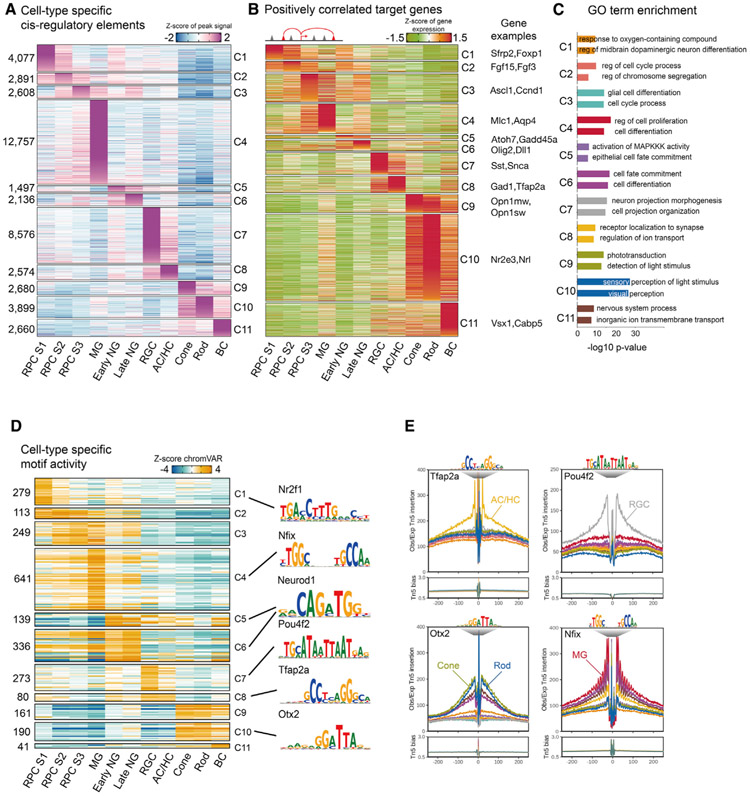
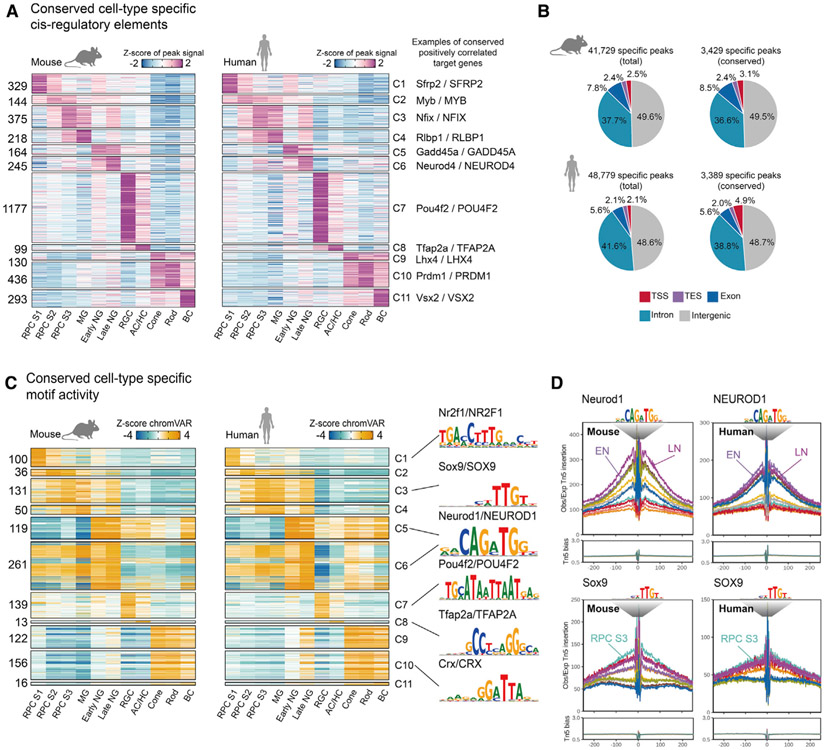
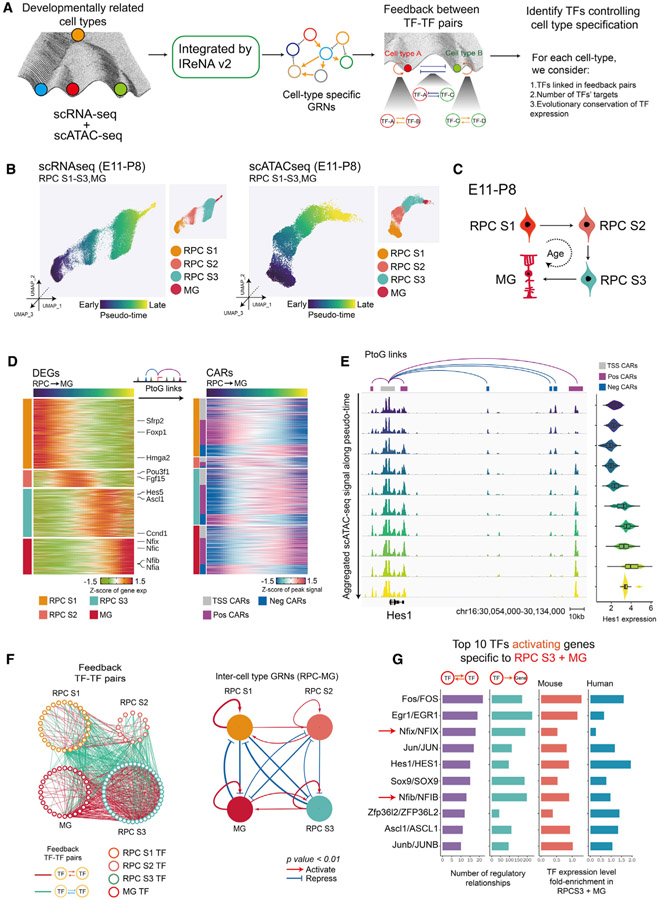
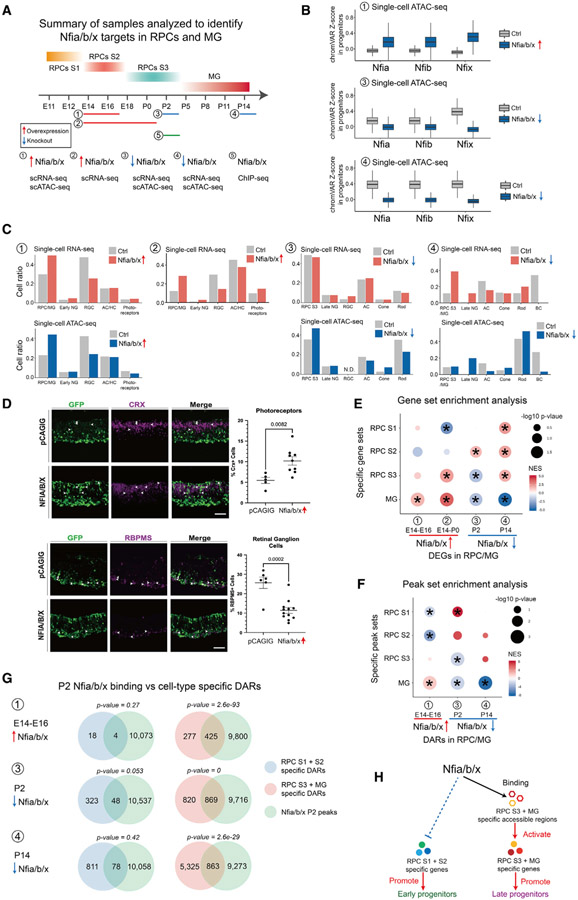
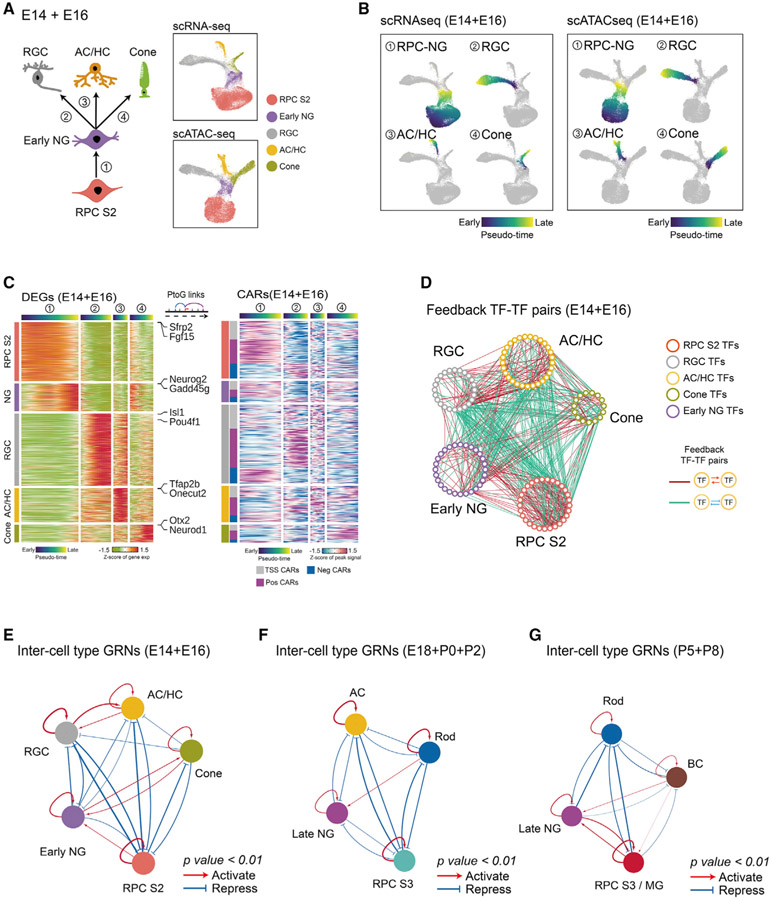
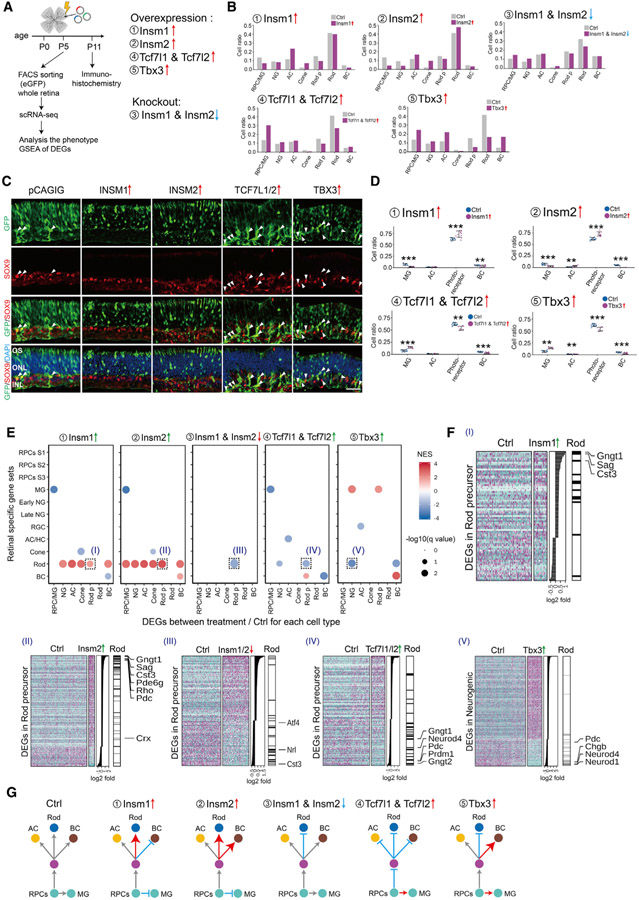
Gene regulatory networks (GRNs), consisting of transcription factors and their target sites, control neurogenesis and cell-fate specification in the developing central nervous system. In this study, we use integrated single-cell RNA and single-cell ATAC sequencing (scATAC-seq) analysis in developing mouse and human retina to identify multiple interconnected, evolutionarily conserved GRNs composed of cell-type-specific transcription factors that both activate genes within their own network and inhibit genes in other networks. These GRNs control temporal patterning in primary progenitors, regulate transition from primary to neurogenic progenitors, and drive specification of each major retinal cell type. We confirm that NFI transcription factors selectively activate expression of genes promoting late-stage temporal identity in primary retinal progenitors and identify other transcription factors that regulate rod photoreceptor specification in postnatal retina. This study inventories cis- and trans-acting factors that control retinal development and can guide cell-based therapies aimed at replacing retinal neurons lost to disease.

Keywords: NFI; development; gene regulatory network; neurogenesis; progenitor; retina; single-cell ATAC-seq; single-cell RNA-seq; temporal patterning; transcription factor.


Conflict of interest statement

Declaration of interests S.B. co-founded and is a shareholder of CDI Labs, LLC. S.B. is also a consultant for Third Rock Ventures, LLC.

Figures

Figure 1.
Figure 1.. Overview of the study
(A) Schematic summary of the study. scATAC-seq of the mouse whole retinas was performed at 11 different time points. Cell types and cell-type-specific accessible chromatin regions were identified through dimensional reduction and clustering analysis. By integrating age-matched scRNA-seq data with our data, we reconstructed gene regulatory networks (GRNs) using the IReNA v2 analytic pipeline and identified candidate regulators controlling temporal patterning and cell-fate specification during the retinal development. (B) Combined UMAP projection of all mouse retinal cells profiled using scATAC-seq (top) and scRNA-seq data (bottom). Each point (cell) is colored by cell type (left) and age (right). (C) Examples of mRNA levels and chromatin accessibility for selected cell-type-specific genes. (D) The relative abundance of retinal cell types is similar between age-matched scATAC-seq (left panel) and scRNA-seq (right panel). Bar plots show fraction of cells (y axis) at each time point of each cell type (x axis). ACs, amacrine cells; BCs, bipolar cells; HCs, horizontal cells; MG, Müller glia; NGs, neurogenic progenitor cells; RGCs, retinal ganglion cells; RPCs, retinal progenitor cells.
Figure 2.
Figure 2.. Single-cell regulatory landscape of mouse retinal development
(A) Heatmap of cell-type-specific peaks. The numbers of cell-type-specific peaks are indicated at left. Cell types are shown at the bottom. (B) Heatmaps of the expression level of positively correlated genes. Cell types are shown at the bottom of the plot. (C) Representative genes along with GO enrichment for each cluster. The x axis indicates the −log10(p value) of the GO term. (D) Heatmap of the chromVAR Z score for cell-type-specific motifs. The number of motifs in each cell type is indicated at left. Cell types are indicated at the bottom. Representative motif logos are shown on the right. (E) Examples of TF footprint profiles for Tfap2a, Pou4f2, Otx2, and Nfix in indicated scATAC-seq clusters. Tn5 insertion tracks are shown below.
Figure 3.
Figure 3.. Conserved single-cell regulatory landscape in mouse and human retinal development
(A) Heatmap of evolutionary conserved cell-type-specific peaks. Numbers of peaks are indicated at left. Cell types are shown at the bottom. Representative conserved and positively correlated genes are shown on the right. (B) Pie chart depicts percentage of total and conserved peaks from mouse (top) and human (bottom). TES, transactional end site; TSS, transcriptional start site. (C) Heatmap of the chromVAR Z score of the conserved cell-type-specific motifs from mouse (left) and human (right). The number of motifs is indicated at left. Cluster identities are indicated at the bottom. Representative motif logos are shown on the right. (D) TF footprint profile of Neurod1 and Sox9 from selected mouse and human retinal cell types.
Figure 4.
Figure 4.. Model of GRNs controlling temporal patterning of retinal progenitors
(A) Schematic of the analytic pipeline used to identify TFs controlling retinal development. The role of feedback loops (double positive and double negative) in controlling transitions between cell states and during the retinal-cell-fate specification is shown in the Waddington epigenetic landscape model. (B) UMAPs of retinal progenitors from scRNA-seq (left) and scATAC-seq (right). Cells are colored by pseudotime and cell type. (C) A model for transitions of primary retinal progenitors and MG during E11-P8. (D) Heatmaps show expression of cell-type-specific DEGs (left) and their correlated accessible regions (CARs) (right) across pseudotime. The left bar indicates cell types (RPCs S1–S3 and MG) and the classes of CARs (TSS, positively correlated and negatively correlated). (E) Genome track visualization of the Hes1 locus. Each track represents the aggregated scATAC-seq signals across the RPC-MG trajectory. Inferred links of Hes1-associated CARs (correlated accessible regions) are shown at top. Expression level of Hes1 measured by scRNA-seq across the RPC-MG trajectory is shown at right. (F) Full network diagram on the left showing TF pairs linked by reciprocal positive or negative regulatory relationships during the RPC-MG transition. Each node represents an individual cell-type-specific TF. Each edge represents a statistically significant feedback relation between TF pairs. Simplified intermodular regulatory networks of retinal progenitors are shown on the right. Colored nodes represent specific cell types. Connections indicate statistically significant regulations among modules. The width of connections indicates their regulatory enrichment fold. (G) The top 10 TFs predicted to activate expression of genes specific to stage 3 RPCs, as inferred from IReNA v2 analysis (left). Bar plots show expression levels of these TFs in mouse and human stage 3 RPCs progenitors (right).
Figure 5.
Figure 5.. Nfia/b/x promote late-stage temporal identity in retinal progenitors
(A) Overview of experimental design for characterizing Nfia/b/x function in retinal progenitors. (B) Boxplots showing changes in the Nfia/b/x motif enrichment in retinal progenitors following overexpression or knockout of Nfia/b/x. Bars are colored by genotype. (C) Bar plots showing the fraction of each retinal cell type by ages and genotypes (top: scRNA-seq data; bottom: scATAC-seq data). (D) Immunostaining showing fewer RGCs and more photoreceptors at P0 following NFIA/B/X overexpression at E14 retinal explants. The fractions of RGCs and photoreceptors are shown on the right.Error bars indicate standard deviation. n> 5 retinas/group. Scale bars represent 20 μm. (E) Dot plot showing gene set enrichment results for DEGs enriched in early- and late-stage RPCs and MG following overexpression or knockout of Nfia/b/x. (F) Dot plot showing peak set enrichment results for DARs enriched in early- and late-stage RPCs and MG following overexpression or knockout of Nfia/b/x. (G) Venn diagrams showing overlap between direct Nfia/b/x binding regions identified using ChIP-seq and cell-type-specific DARs. The p value on top of each Venn diagram indicates the significance of their overlap using the hypergeometric test. (H) Summary of Nfia/b/x action during the transition from early- to late-stage RPCs.
Figure 6.
Figure 6.. Model of GRNs controlling specification of retinal neuronal cell types
(A) A diagram showing development of early-born retina cell types (left). UMAPs of scRNA-seq and scATAC-seq data from E14–E16 retina (right) are shown. Color indicates cell type. (B) UMAPs showing trajectories constructed from scRNA-seq and scATAC-seq at E14–E16. Color indicates pseudotime state. (C) Heatmaps showing expression of cell-type-specific DEGs (left) and the accessibility of their corresponding CARs (right) along differentiation trajectories. The top bars are colored by pseudotime state for each trajectory. The left bar indicates cell type and the classes of CARs. (D) Networks showing feedback relationships between TF pairs at E14–E16. Each node represents an individual cell-type-specific TF. Each edge represents a positive- or negative-feedback regulatory relationship between TF pairs. (E–G) Simplified intermodular GRNs of RPCs and neurons at different stages (E, early-stage; F, intermediate-stage; G, late-stage). Colored nodes represent cell types. Connections indicate statistically significant regulatory relationships among GRNs specific to each cell type. The width of connections indicates their regulatory enrichment fold.
Figure 7.
Figure 7.. Identification of TFs controlling cell-fate specification in postnatal retina
(A) A schematic diagram for gain- and loss-of-function analysis of candidate TFs in postnatal mouse retina explants. (B) Bar plots showing the fraction of each cell type at P5 as measured by scRNA-seq analysis of FACS-isolated GFP-positive cells for each treatment condition. (C and D) Immunohistochemistry and quantification of MG (SOX9 positive) and photoreceptors (GFP positive in the ONL layer) in P11 retina explants in control and overexpression of INSM1, INSM2, TCF7L1/2, and TBX3. Arrowheads indicate SOX9/GFP double-positive cells. Error bars indicate standard deviation. **p < 0.05; ***p < 0.001; n > 7 retinas/group. Each dot represents a retinal explant. INL, inner nuclear layer; ONL, outer nuclear layer; OS, outer segment. Scale bar represents 30 μm. (E) GSEA of DEGs from each cell type in each experiment. GSEA was performed with the cell-type-specific gene sets obtained from the combined scRNA-seq data (E11–P8). Only significant enrichment results (p < 0.05) are shown in the dot plot. Each dot was colored by NES and sized by −log(p value). The x axis indicates the cell type where DEGs are calculated. The y axis indicates the specific gene sets used in the analysis. (F) Examples of GSEA results from (E). Heatmaps show DEGs used in the GSEA analysis, with DEGs ranked by log2 fold change, as shown in the middle panel. The right annotation shows the distribution of significantly enriched gene sets among the DEGs. Representative cell-type-specific genes are also labeled. (G) Summary of observed phenotypes.

References

    1. Akagi T, Inoue T, Miyoshi G, Bessho Y, Takahashi M, Lee JE, Guillemot F, and Kageyama R (2004). Requirement of multiple basic helix-loop-helix genes for retinal neuronal subtype specification. J. Biol. Chem 279, 28492–28498. - PubMed
    1. Akhmedov NB, Piriev NI, Chang B, Rapoport AL, Hawes NL, Nishina PM, Nusinowitz S, Heckenlively JR, Roderick TH, Kozak CA, et al. (2000). A deletion in a photoreceptor-specific nuclear receptor mRNA causes retinal degeneration in the rd7 mouse. Proc. Natl. Acad. Sci. USA 97, 5551–5556. - PMC - PubMed
    1. Aldiri I, Xu B, Wang L, Chen X, Hiler D, Griffiths L, Valentine M, Shirinifard A, Thiagarajan S, Sablauer A, et al.; St. Jude Children’s Research Hospital–Washington University Pediatric Cancer Genome Project (2017). The dynamic epigenetic landscape of the retina during development, reprogramming, and tumorigenesis. Neuron 94, 550–568.e10. - PMC - PubMed
    1. Bassett EA, and Wallace VA (2012). Cell fate determination in the vertebrate retina. Trends Neurosci 35, 565–573. - PubMed
    1. Bayraktar OA, and Doe CQ (2013). Combinatorial temporal patterning in progenitors expands neural diversity. Nature 498, 449–455. - PMC - PubMed

Publication types

MeSH terms