. 2022 May 4;31(9):1430-1442.
doi: 10.1093/hmg/ddab321.

Mutations of the histone linker H1-4 in neurodevelopmental disorders and functional characterization of neurons expressing C-terminus frameshift mutant H1.4

Affiliations

Mutations of the histone linker H1-4 in neurodevelopmental disorders and functional characterization of neurons expressing C-terminus frameshift mutant H1.4

Martine W Tremblay et al. Hum Mol Genet. .

Abstract

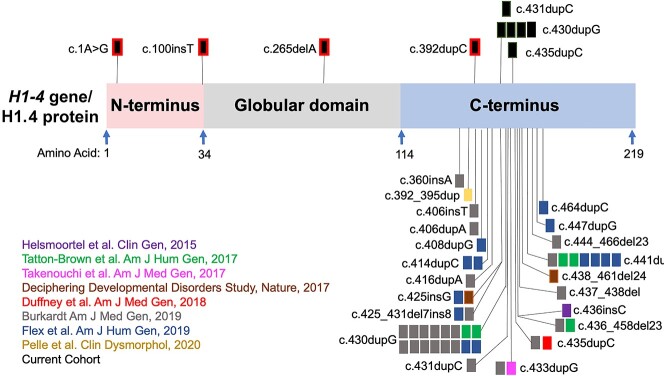
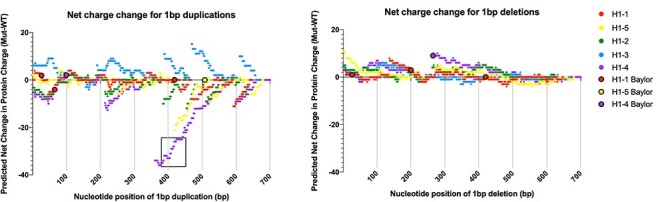
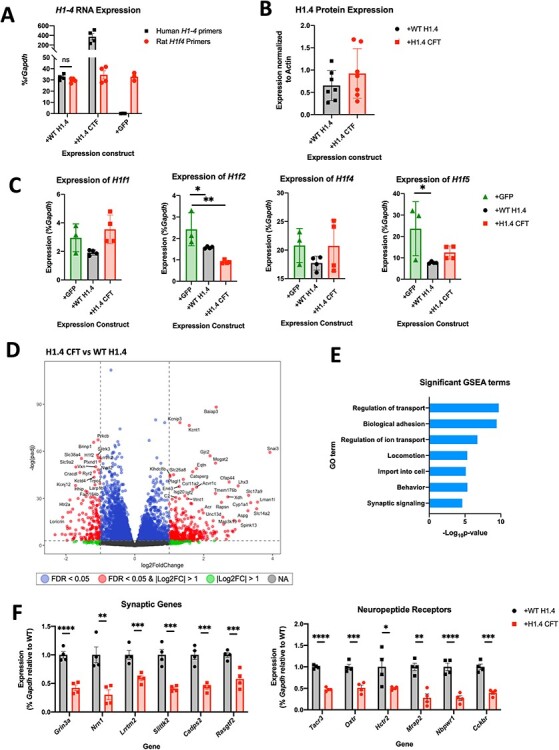
Rahman syndrome (RMNS) is a rare genetic disorder characterized by mild to severe intellectual disability, hypotonia, anxiety, autism spectrum disorder, vision problems, bone abnormalities and dysmorphic facies. RMNS is caused by de novo heterozygous mutations in the histone linker gene H1-4; however, mechanisms underlying impaired neurodevelopment in RMNS are not understood. All reported mutations associated with RMNS in H1-4 are small insertions or deletions that create a shared frameshift, resulting in a H1.4 protein that is both truncated and possessing an abnormal C-terminus frameshifted tail (H1.4 CFT). To expand understanding of mutations and phenotypes associated with mutant H1-4, we identified new variants at both the C- and N-terminus of H1.4. The clinical features of mutations identified at the C-terminus are consistent with other reports and strengthen the support of pathogenicity of H1.4 CFT. To understand how H1.4 CFT may disrupt brain function, we exogenously expressed wild-type or H1.4 CFT protein in rat hippocampal neurons and assessed neuronal structure and function. Genome-wide transcriptome analysis revealed ~ 400 genes altered in the presence of H1.4 CFT. Neuronal genes downregulated by H1.4 CFT were enriched for functional categories involved in synaptic communication and neuropeptide signaling. Neurons expressing H1.4 CFT also showed reduced neuronal activity on multielectrode arrays. These data are the first to characterize the transcriptional and functional consequence of H1.4 CFT in neurons. Our data provide insight into causes of neurodevelopmental impairments associated with frameshift mutations in the C-terminus of H1.4 and highlight the need for future studies on the function of histone H1.4 in neurons.


Figures

Figure 1
Figure 1
Summary of variants in H1–4. The H1–4 gene encodes a 219-amino acid protein composed of three domains: a short N-terminal tail, a globular domain and a long C-terminal tail. Amino acid positions delineating the protein domains are shown as blue arrows. Above the gene schematic (black boxes) are mutations detected in the patients recruited for this study. Solid black boxes indicate that the individual was previously reported by another group. Black box with red outline indicates patients that have not been reported by other groups. Mutations that have previously been published are drawn under the peptide schematic, with color of the box corresponding with the publication reporting the mutation. (Purple (6); Green (1); Pink (4); Auburn (38); Red (3); Grey (2); Blue (5); Yellow (7)).
Figure 2
Figure 2
Clinical presentation of subjects in this study. For subjects in this study (Subjects 1–7), medical and health history was collected, and guardians were asked to self-report in a survey covering additional health and development metrics. (A) In the table, gray boxes indicate that the phenotypes reported by parents do differ from that of a typically developed child. White box indicates that respective questions were reported by parents as unremarkable or not able to assess (NR). The prevalence of previously published phenotypes is also included. (B). Comparison of growth parameters of our subjects against CDC clinical growth charts (percentile). Numbers correspond to growth parameters for each subject. Thick gray bar indicates average growth percentile, thin grey bar indicates SD.
Figure 3
Figure 3
Frameshift modeling of the H1 family of genes. R was utilized to systematically create 1 bp duplications (left) or 1 bp deletions (right) throughout the length of the H1–1 (red), H1–5 (yellow), H1–2 (green), H1–3 (blue) and H1–4 (purple) genes, translate the sequences until a stop codon was reached and calculate net charge change from a WT protein of corresponding length. Frameshift mutations found in the clinical ES database are points outlined in black. Black box around H1–4 points shows previously published H1.4 CFT frameshift mutations (2,5).
Figure 4
Figure 4
Exogenous expression of FLAG-myc-Tagged H1.4 WT and H1.4 CFT in rat primary neurons. (A) Western blotting of whole cell extract of primary neurons with anti-FLAG antibody. (B) Representative images of DIV7 rat hippocampal neurons exogenously expressing FLAG-myc-WT H1.4 or frameshift mutant FLAG-myc-H1.4 CFT (c.430dupG mutation in H1.4) (stained with myc in red) is expressed in the nucleus of neurons (labeled with Map2 in green). (C) CellProfiler Quantification of percent overlap between Myc and the DAPI signal of neurons (P < =  0.000001) and (D) of nuclear size from DAPI signal (P = 0.0015). N = 3 experiments, n = 234 WT H1.4 nuclei, n = 511 mutant H1.4 nuclei. Unpaired two-tailed t-test, ** < = 0.005, **** < = 0.0001. (E) Representative images of pixel intensity of myc signal (H1.4) across the diameter of neurons exogenously expressing WT H1.4 or H1.4 CFT. Error bars represent SD.
Figure 5
Figure 5
RNA-seq results from rat hippocampal neurons. RNA from DIV 7 rat hippocampal neurons exogenously expressing WT H1.4, H1.4 CFT (with mutation c.430dupG), or a GFP infection controls were sequenced. (A) Relative mRNA expression of exogenous human H1–4 WT or CFT or endogenous rat H1f4 mRNA in rat hippocampal neurons (p = 0.4375). Paired t-test. (B) Quantification of exogenous WT and CFT H1.4 protein expression in rat hippocampal neurons as in Figure 4A. FLAG signal from the dual FLAG-myg tagged H1.4 constructs is normalized to actin in the same lane (P = 0.2971); n = 7 (C) Expression of H1f1, −f2, −f4 and −f5 in rat neurons. Rat H1–3 (H1f6) is testes specific and not somatic. One-way analysis of variance (ANOVA) [H1f1 p = 0.054, H1f2 P = 0.000008 (RM: GFP versus WT P = 0.497, WT versus CFT P = 0.0023), H1f4 P = 0.24, H1f5 P = 0.022 (WT versus GFP P = 0.033)]. One-way ANOVA with multiple corrections, * < =  0.05, ** < =  0.005, *** < =  0.0005, **** < =  0.0001. (D) Volcano plot of transcripts identified by RNA-seq. Statistical cutoffs used were Log2FoldChange > = 1 or −1, and P < = 0.5. Transcripts differentially expressed are shown in red, non-significant genes are shown in gray. Transcripts that met the Log2Fold change but not P-value cutoffs are shown in green, transcripts that met P-value cutoffs but log2FoldChange are shown in blue. (E) Significant GO terms of differentially expressed genes, graphed by −Log (10) of P-value for each term. (F) Expression of synaptic genes (left) and receptors (right) differentially expressed between DIV 7 rat hippocampal neurons exogenously expressing WT H1.4 or H1.4 CFT. (Grin3a P = 0.00029, Nrn1 P = 0.0051, Lrrtm2 P = 0.0041, Slittk2 P = 0.00086, Cadps2 P = 0.00066, Rasgtf2 P = 0.0035, Tacr3 P = 0.000003, Oxtr P = 0.0014, Hctr2 P = 0.049, Mrap2 P = 0.0012, Nbpwr1 P = 0.00042, Cckbr P = 0.0002). Unpaired two-tailed t-test, * < = 0.05, ** > = 0.005, *** > = 0.0005, **** > = 0.0001.
Figure 6
Figure 6
Effects of frameshift mutant H1.4 CFT (with c.430dupG) on firing rate and synchrony in rat hippocampal neurons. (A) Neurite outgrowth tracing shows no difference between number of primary dendrites (P = 0.248), length of primary dendrites (P = 0.511), number of secondary neurites (P = 0.926) or length of secondary neurites (0.835). N = 3 experiments, n = 74 WT H1.4 neurons, n = 75 CFT H1.4 neurons. Unpaired two-tailed t-test. (B) Sholl analysis of these traces is not significant (P = 0.2344), repeated measures two-way ANOVA, Tukey correction. N = 3 experiments, n = 76 WT H1.4 neurons, n = 75 CFT H1.4 neurons. Error bars represent SD. (C) Representative images showing neurons at DIV14. Red = Myc (H1.4) or GFP, Green = MAP2, Blue = DAPI. (D) Representative traces of action potential (AP) waveforms from single electrodes of a 16 MEA recording. The average waveform is shown in black. (E) Raster plots showing spontaneous firing of APs in WT H1.4, H1.4 CFT and GFP expressing neurons over a 100-s time period. Each row represents an electrode, each dash on the plot indicates a spike. Synchronous spikes, in which multiple electrodes have activity simultaneously, are colored in blue. Non-synchronous spikes are colored in black. (F) Quantification of firing rate and synchrony throughout development in H1.4 CFT expressing neurons compared with WT H1.4 and GFP expressing neurons. N = 3 experimental plates, n = 4–6 replicas of each condition per plate. Mixed effects analysis with multiple comparisons, for multiple comparisons: WT versus H1.4 CFT * < = 0.05, ** < = 0.01, *** < = 0.001, GFP versus H1.4 CFT # < = 0.05, ## < = 0.01, ### < = 0.001, brackets denote P-value summary of overexpression (firing rate P = 0.0006, Synchrony P = 0.0017).

References

    1. Tatton-Brown, K., Loveday, C., Yost, S., Clarke, M., Ramsay, E., Zachariou, A., Elliott, A., Wylie, H., Ardissone, A., Rittinger, O.et al. (2017) Mutations in epigenetic regulation genes are a major cause of overgrowth with intellectual disability. Am. J. Hum. Genet., 100, 725–736. - PMC - PubMed
    1. Burkardt, D.D., Zachariou, A., Loveday, C., Allen, C.L., Amor, D.J., Ardissone, A., Banka, S., Bourgois, A., Coubes, C., Cytrynbaum, C.et al. (2019) HIST1H1E heterozygous protein-truncating variants cause a recognizable syndrome with intellectual disability and distinctive facial gestalt: a study to clarify the HIST1H1E syndrome phenotype in 30 individuals. Am. J. Med. Genet. A, 179, 2049–2055. - PubMed
    1. Duffney, L.J., Valdez, P., Tremblay, M.W., Cao, X., Montgomery, S., McConkie-Rosell, A. and Jiang, Y.H. (2018) Epigenetics and autism spectrum disorder: a report of an autism case with mutation in H1 linker histone HIST1H1E and literature review. Am. J. Med. Genet. B Neuropsychiatr. Genet., 177, 426–433. - PMC - PubMed
    1. Takenouchi, T., Uehara, T., Kosaki, K. and Mizuno, S. (2018) Growth pattern of Rahman syndrome. Am. J. Med. Genet. A, 176, 712–714. - PubMed
    1. Flex, E., Martinelli, S., Van Dijck, A., Ciolfi, A., Cecchetti, S., Coluzzi, E., Pannone, L., Andreoli, C., Radio, F.C., Pizzi, S.et al. (2019) Aberrant function of the C-terminal tail of HIST1H1E accelerates cellular senescence and causes premature aging. Am. J. Hum. Genet., 105, 493–508. - PMC - PubMed

Publication types