. 2021 Nov 17;21(1):1233.
doi: 10.1186/s12885-021-08956-5.

The landscape of coding RNA editing events in pediatric cancer

Affiliations

The landscape of coding RNA editing events in pediatric cancer

Ji Wen et al. BMC Cancer. .

Abstract

Background: RNA editing leads to post-transcriptional variation in protein sequences and has important biological implications. We sought to elucidate the landscape of RNA editing events across pediatric cancers.

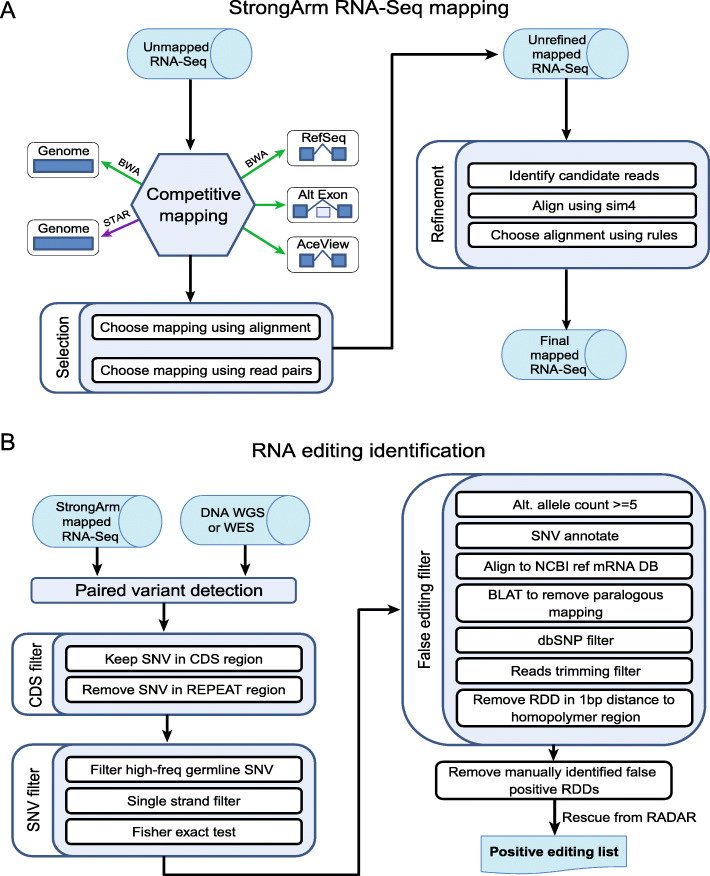
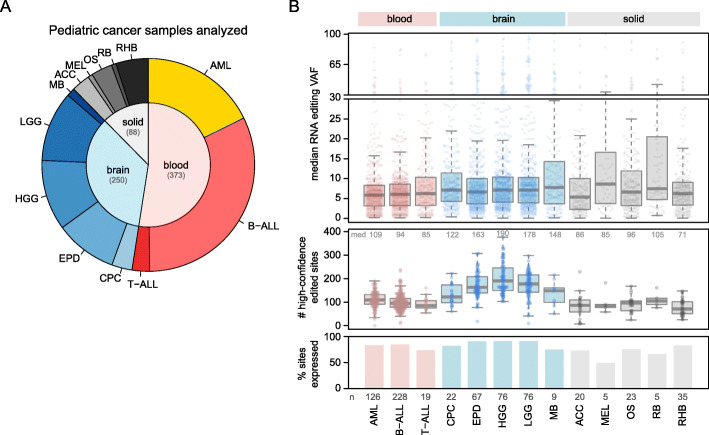
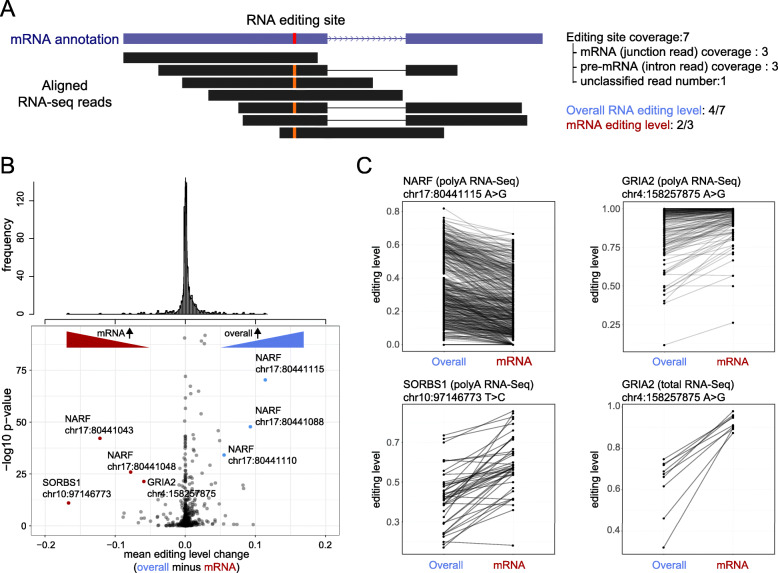
Methods: Using RNA-Seq data mapped by a pipeline designed to minimize mapping ambiguity, we investigated RNA editing in 711 pediatric cancers from the St. Jude/Washington University Pediatric Cancer Genome Project focusing on coding variants which can potentially increase protein sequence diversity. We combined de novo detection using paired tumor DNA-RNA data with analysis of known RNA editing sites.

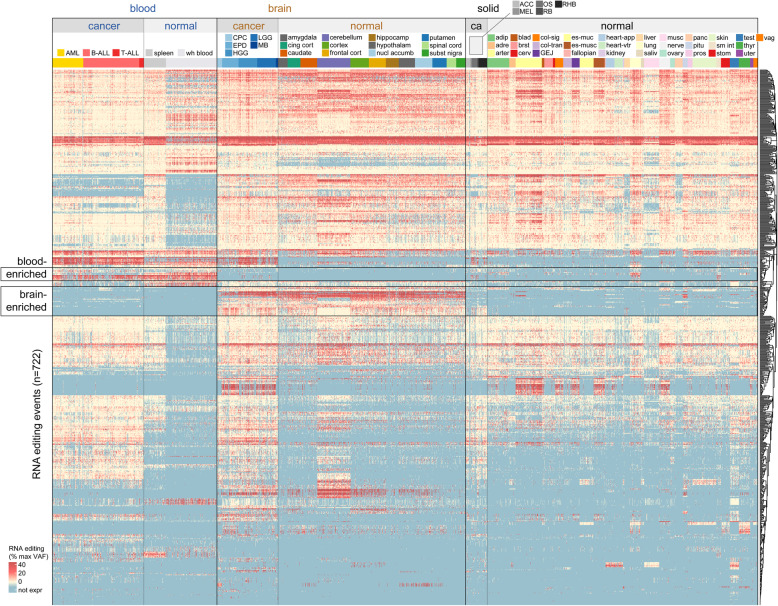
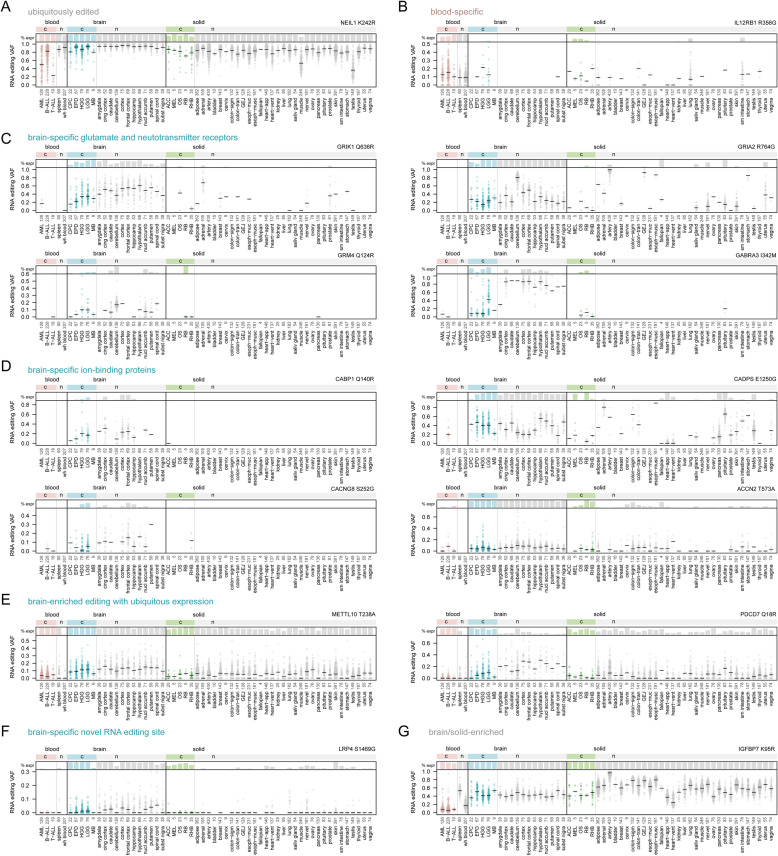
Results: We identified 722 unique RNA editing sites in coding regions across pediatric cancers, 70% of which were nonsynonymous recoding variants. Nearly all editing sites represented the canonical A-to-I (n = 706) or C-to-U sites (n = 14). RNA editing was enriched in brain tumors compared to other cancers, including editing of glutamate receptors and ion channels involved in neurotransmitter signaling. RNA editing profiles of each pediatric cancer subtype resembled those of the corresponding normal tissue profiled by the Genotype-Tissue Expression (GTEx) project.

Conclusions: In this first comprehensive analysis of RNA editing events in pediatric cancer, we found that the RNA editing profile of each cancer subtype is similar to its normal tissue of origin. Tumor-specific RNA editing events were not identified indicating that successful immunotherapeutic targeting of RNA-edited peptides in pediatric cancer should rely on increased antigen presentation on tumor cells compared to normal but not on tumor-specific RNA editing per se.

Keywords: Genomics; Immunotherapy; Pediatric cancer; RNA editing.


Conflict of interest statement

CGM has received consulting and speaking fees from Illumina and Amgen, and research support from Loxo Oncology, Pfizer and Abbvie, and holds stock in Amgen.

Figures

Fig. 1
Fig. 1
The StrongArm RNA-Seq mapping and RNA editing detection pipelines. A Schematic workflow of StrongArm RNA-seq mapping pipeline. The pipeline starts with competitive mapping of 5 different combinations of mapper and database, followed by further local refinement. B RNA editing identification pipeline. RNA-Seq BAM files are aligned with StrongArm as shown in (A), and germline and somatic DNA variants are also called from the same patient using WGS or WES of matched tumor and germline DNA. The pipeline searches for RNA-specific (RNA editing) variants in coding (CDS) regions by comparing RNA-Seq reads to DNA-Seq. A series of false editing filters is then employed to remove RNA editing artifacts, followed by manual review of the BAM alignment. The RNA editing candidates are then used to evaluate the editing levels cross the whole cohort
Fig. 2
Fig. 2
Analysis of RNA editing in pediatric cancers. A Pie chart showing the number and type of pediatric cancer samples analyzed, including 711 samples from the PCGP (excluding those showing batch-specific effects in RNA editing VAFs). Samples are divided into blood, brain, and solid (extracranial) cancers and include only diagnosis samples, with one sample per patient. Subtypes of blood, brain, and solid tumors include acute myeloid leukemia (AML), B- and T-acute lymphoblastic leukemia (B-ALL and T-ALL), choroid plexus carcinoma (CPC), ependymoma (EPD), high-grade and low-grade glioma (HGG and LGG), medulloblastoma (MB), adrenocortical carcinoma (ACC), melanoma (MEL), osteosarcoma (OS), retinoblastoma (RB), and rhabdomyosarcoma (RHB). B RNA editing VAFs for each cancer type. The 722 RNA editing sites mentioned in the text were analyzed. Bottom panel y-axis indicates the percentage of the 722 variants in each cancer type that were expressed in at least 3 samples (with 10 reads of coverage), and the numbers at bottom indicate the total number of samples analyzed in each cancer type. The middle panel shows the number of RNA editing sites in each sample (point) that were edited with high confidence (Methods). Median values are shown at the top of the plot. Boxplot shows median (thick center line) and interquartile range (box). Whiskers are described in R boxplot documentation (a 1.5*interquartile range rule is used). In the top panel, the y-axis represents the median RNA VAF, such that each point represents the median RNA VAF for one specific RNA editing site in one specific cancer type. Only positively edited samples were included in the quantification of the median VAF (zero-VAF samples excluded) and only high-confidence editing events were included (Methods). Boxplots median, interquartile range, and whiskers are as in middle panel. Only RNA editing sites for which at least 3 samples in the cancer type had at least 10 reads of RNA-Seq coverage are shown
Fig. 3
Fig. 3
Landscape of RNA editing events in pediatric cancer compared to normal samples. Heatmap showing the level of RNA editing for the 722 editing events reported in the text. Each row represents one of the 722 RNA editing sites. Each column represents one cancer (PCGP, n = 711) or normal (GTEx, n = 2164 of the 5454 total samples analyzed are shown, as the solid normal tissue samples were thinned to approximately one-fourth the original number for easier viewing) RNA-Seq sample. In the heatmap, red color indicates higher editing level (as a percentage of the max RNA VAF for that variant/row), cream color indicates low editing level, and blue color indicates the expression was too low to evaluate (fewer than 10 reads of coverage at the genomic locus). Samples from the same cancer or normal tissue type are grouped together and color-coded as indicated in legends at top. The name of each cancer and normal tissue type is abbreviated, and the key for determining the full name of each cancer and normal tissue type is in Supplementary Table 6
Fig. 4
Fig. 4
Tissue specificity of selected RNA editing events. Plots are shown for selected RNA editing events taken from among the 722 sites identified in the study. Bottom y-axis for each graph represents the RNA editing VAF for the variant noted. Each point represents one cancer or normal sample, and horizontal black bars represent the median for each cancer or normal tissue type. The top portion of each graph indicates the percentage of samples in which the editing site is expressed (“% expr”) with at least 10 reads of sequencing coverage. VAFs are only shown in the bottom panels for samples meeting this criterion. Samples are divided into cancer (c) or normal (n) tissue types as in Fig. 3 (see Supplementary Table 6 for cancer type abbreviation definitions). The RNA editing site is shown at the top-right of each graph, expressed as the gene and amino acid change caused by the editing event. Each panel highlights an editing event with a specific pattern of interest, including (A) a ubiquitously edited site, (B) a site both edited and expressed primarily in blood cells, (C and D) sites both expressed and edited preferentially in the brain, (E) sites with ubiquitous expression and editing enrichment in brain, (F) a brain-enriched editing site not reported in RADAR, DARNED, or REDIportal, unlike the others in this figure, and (G) a site edited preferentially in solid and brain tissue but not edited in most blood tissues
Fig. 5
Fig. 5
RNA editing differs between total RNA compared to mRNA. (A) A method to calculate junction-corrected RNA editing level. To strictly calculate the RNA editing levels using mRNA reads, we only kept reads for which the read or its mated pair were mapped to splice junctions. The “spliced reads” were then used to calculate the mRNA editing levels. (B) Difference between overall RNA editing level and junction corrected editing level. Top, the histogram of mean editing level change. Bottom, volcano plot illustrating the difference and p-values for each editing site, comparing overall to (junction-corrected) mRNA editing levels. (C) Examples of editing sites showing significant editing level change comparing overall RNA editing level to mRNA editing level. The overall and mRNA editing level from the same sample are connected with black lines to indicate paired connections

References

    1. Yablonovitch AL, Deng P, Jacobson D, Li JB. The evolution and adaptation of A-to-I RNA editing. Zhang J. PLoS Genet. 2017;13(11):e1007064. doi: 10.1371/journal.pgen.1007064. - DOI - PMC - PubMed
    1. Nishikura K. Functions and regulation of RNA editing by ADAR deaminases. Annu Rev Biochem. 2010;79(1):321–349. doi: 10.1146/annurev-biochem-060208-105251. - DOI - PMC - PubMed
    1. Blanc V, Davidson NO. APOBEC-1-mediated RNA editing. Wiley Interdiscip Rev Syst Biol Med. 2010;2:594–602. doi: 10.1002/wsbm.82. - DOI - PMC - PubMed
    1. Bazak L, Levanon EY, Eisenberg E. Genome-wide analysis of Alu editability. Nucleic Acids Res. 2014;42(11):6876–6884. doi: 10.1093/nar/gku414. - DOI - PMC - PubMed
    1. Ramaswami G, Li JB. RADAR: a rigorously annotated database of A-to-I RNA editing. Nucleic Acids Res. 2014;42(13):i. doi: 10.1093/nar/gku004. - DOI - PMC - PubMed