. 2021 Nov 17;14(1):415.
doi: 10.1186/s13104-021-05827-x.

Documenting elimination of co-circulating COVID-19 clusters using genomics in New South Wales, Australia

Affiliations

Documenting elimination of co-circulating COVID-19 clusters using genomics in New South Wales, Australia

Alicia Arnott et al. BMC Res Notes. .

Abstract

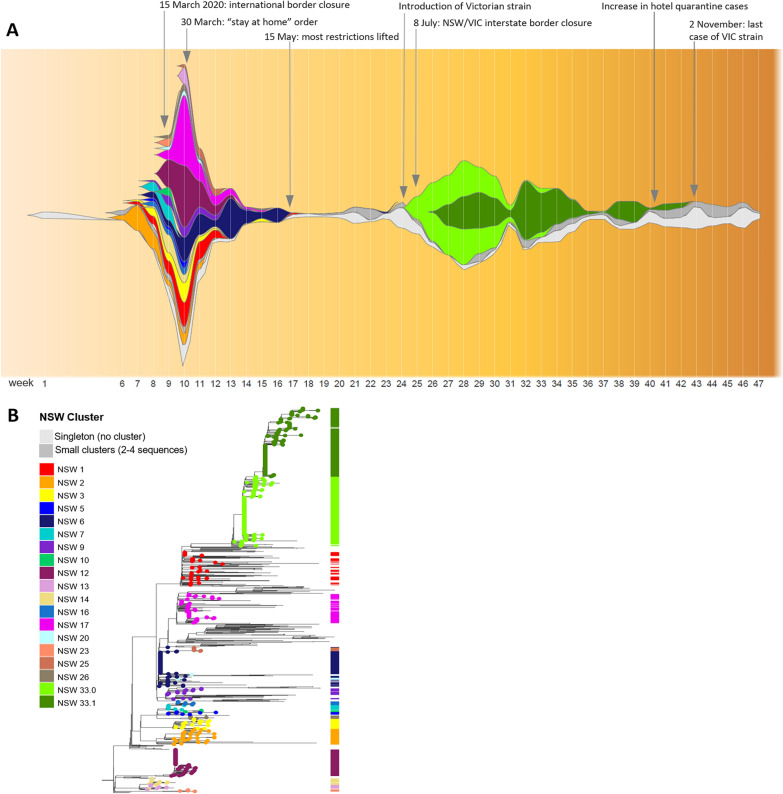
Objective: To adapt 'fishplots' to describe real-time evolution of SARS-CoV-2 genomic clusters.

Results: This novel analysis adapted the fishplot to depict the size and duration of circulating genomic clusters over time in New South Wales, Australia. It illuminated the effectiveness of interventions on the emergence, spread and eventual elimination of clusters and distilled genomic data into clear information to inform public health action.

Keywords: Australia; Bioinformatics; Genomic epidemiology; SARS-CoV-2; Whole genome sequencing.


Conflict of interest statement

The authors declare that they have no competing interests.

Figures

Fig. 1
Fig. 1
Epi-fishplot illustrating the rise and fall of SARS-CoV-2 genomic clusters in NSW over the course of the pandemic in 2020 (plotted by epidemiological week, from 22/1/2020). a The height of the plot at each week (vertical white line) is proportional to the total number of genomes obtained from COVID-19 cases sampled that week. The colour represents the assigned genomic cluster. The full height of the Y-axis is proportional to the largest number of sequences obtained for any time point (185 sequences, sampled during the 10th week of 22–28 March 2020). This plot illustrates large number of distinct genomic clusters introduced from overseas to Australia during the initial months of the pandemic, and their rapid elimination as a consequence of border closure and lockdown measures. It also illustrates the spread and steady elimination of a “second-wave” outbreak introduced from the state of Victoria prior to interstate border closure, consisting of two related clusters, NSW33.0 and NSW33.1. b Classic phylogenetic tree representation of the same dataset, representing the relatedness of all sequenced cases in NSW. Clusters with ≥ 5 sequences are indicated in the metabar and coloured according to the colour scheme of the epi-fishplot (a). The phylogenetic tree was constructed as described previously1

References

    1. Rockett RJ, Arnott A, Lam C, Sadsad R, Timms V, Gray KA, et al. Revealing COVID-19 transmission in Australia by SARS-CoV-2 genome sequencing and agent-based modelling. Nat Med. 2020;26(9):1398–1404. doi: 10.1038/s41591-020-1000-7. - DOI - PubMed
    1. Eden J-S, Rockett RJ, Carter I, Rahman H, de Ligt J, Hadfield J, et al. An emergent clade of SARS-CoV-2 linked to returned travellers from Iran. Virus Evol. 2020 doi: 10.1093/ve/veaa027. - DOI - PMC - PubMed
    1. Miller CA, McMichael J, Dang HX, Maher CA, Ding L, Ley TJ, et al. Visualizing tumor evolution with the fishplot package for R. BMC Genomics. 2016;17(1):880. doi: 10.1186/s12864-016-3195-z. - DOI - PMC - PubMed
    1. Draper, J. Epifish package for R, https://github.com/learithe/epifish
    1. McAnulty JM, Ward K. Suppressing the Epidemic in New South Wales. N Engl J Med. 2020;382:e74. doi: 10.1056/NEJMc2011592. - DOI - PMC - PubMed

LinkOut - more resources