

Fasting-Mimicking Diet Is Safe and Reshapes Metabolism and Antitumor Immunity in Patients with Cancer
- PMID: 34789537
- PMCID: PMC9762338
- DOI: 10.1158/2159-8290.CD-21-0030
Fasting-Mimicking Diet Is Safe and Reshapes Metabolism and Antitumor Immunity in Patients with Cancer
Abstract
In tumor-bearing mice, cyclic fasting or fasting-mimicking diets (FMD) enhance the activity of antineoplastic treatments by modulating systemic metabolism and boosting antitumor immunity. Here we conducted a clinical trial to investigate the safety and biological effects of cyclic, five-day FMD in combination with standard antitumor therapies. In 101 patients, the FMD was safe, feasible, and resulted in a consistent decrease of blood glucose and growth factor concentration, thus recapitulating metabolic changes that mediate fasting/FMD anticancer effects in preclinical experiments. Integrated transcriptomic and deep-phenotyping analyses revealed that FMD profoundly reshapes anticancer immunity by inducing the contraction of peripheral blood immunosuppressive myeloid and regulatory T-cell compartments, paralleled by enhanced intratumor Th1/cytotoxic responses and an enrichment of IFNγ and other immune signatures associated with better clinical outcomes in patients with cancer. Our findings lay the foundations for phase II/III clinical trials aimed at investigating FMD antitumor efficacy in combination with standard antineoplastic treatments. SIGNIFICANCE: Cyclic FMD is well tolerated and causes remarkable systemic metabolic changes in patients with different tumor types and treated with concomitant antitumor therapies. In addition, the FMD reshapes systemic and intratumor immunity, finally activating several antitumor immune programs. Phase II/III clinical trials are needed to investigate FMD antitumor activity/efficacy.This article is highlighted in the In This Issue feature, p. 1.
©2021 The Authors; Published by the American Association for Cancer Research.
Figures
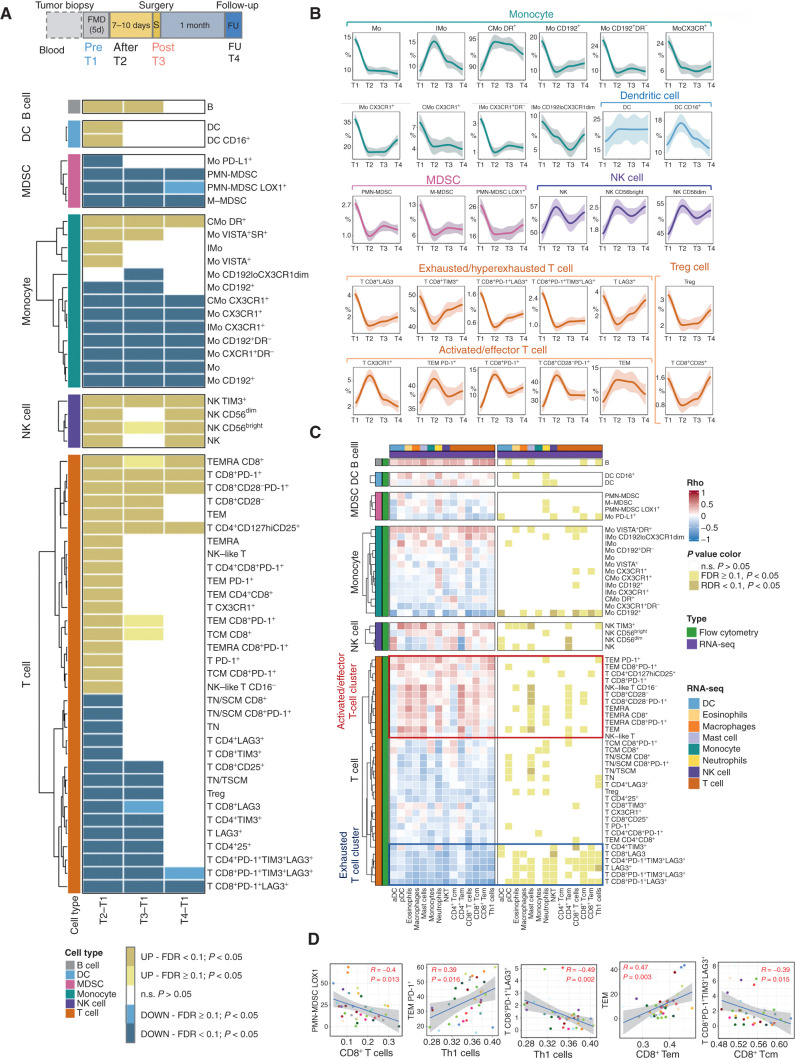
![Figure 3. The fasting-mimicking diet (FMD) reshapes intratumor immunity in patients with breast cancer. A, Time points of blood and tissue sample collection in the DigesT trial (NCT03454282). T1, initiation of the FMD; T2, end of the FMD; T3, surgery; T4, approximately 30 days after surgery. B, Left, IHC evaluation of intratumor IGFR1 and phosphorylated IGFR1 (pIGF1R; brown dots) in pre- and post-FMD tumor samples from one indicative patient (magnification of 200×). B, Right, Box plots showing results of IHC analyses (reported as H-score) of IGF1R and pIGF1R in matched pre- and post-FMD tumor samples in 18 patients enrolled in the DigesT trial (NCT03454282). All P values for the indicated comparisons were determined by paired Wilcoxon test: *, P < 0.05; **, P < 0.01; ***, P < 0.001; ****, P < 0.0001. Box plots indicate median values, with the boundaries of the rectangle representing the first and third quartiles, while vertical black lines extend to the extreme data points that are no more than 1.5 times the interquartile range. Each red dot represents one patient; couples of plots connected by the same black line refer to the same patient before and after the FMD. C, Representative images of hematoxylin and eosin staining (H&E) and IHC evaluations of intratumor CD8+ T cells and CD68+ macrophages in pre-FMD (T1) and post-FMD (T3) tumor samples from two representative patients (magnification of ×200). D, Top plots, box plots showing the IHC quantification of percentage (area) and absolute average numbers (per high-power field; HPF) of intratumor stromal CD8+ cells, absolute average number (per HPF) of intraepithelial CD8+ cells, absolute average number (per HPF) of CD68+ macrophages, and the ratio between stromal CD8+ cells (absolute average number per HPF) and CD68+ macrophages (absolute average number per HPF) in pre-FMD versus post-FMD tumor specimens. Box plot showing the CD8A/CD68 transcript ratio in post-FMD as compared with pre-FMD tumor specimens. Box plots indicate median values of the frequencies of each immune cell population/gene transcript, with the boundaries of the rectangle representing the first and third quartiles, while vertical black lines extend to the extreme data points that are no more than 1.5 times the interquartile range. Each red dot represents one patient; couples of dots connected by the same black line refer to data from the same patient pre- and post-FMD. *, P < 0.05; **, P < 0.01; ***, P < 0.001 by paired Wilcoxon test for the indicated comparisons. D, Bottom plots, correlation between CD8+ T cells by IHC and CD8A gene expression, and between CD68+ macrophages by IHC and CD68 gene expression; box plot showing the CD8A/CD68 transcript ratio in post-FMD as compared with pre-FMD tumor specimens. E, Heat map displaying scores of enrichment of leukocyte subsets (XCell, Charoentong list) that are differentially modulated after the FMD [T3 vs. T1, paired Wilcoxon test, P < 0.05, Benjamini–Hochberg (B-H) false discovery rate (FDR) < 0.1]. aDC, activated DCs; CD4+ and CD8+ Tcm: CD4+ and CD8+ central memory T lymphocytes; NKT, natural killer T cells; pDC, plasmacytoid dendritic cells; Tem, effector memory T lymphocytes. F, Box plots representing scores of individual leukocyte subsets modulated in post-FMD versus pre-FMD tumor specimens. G, Matrix correlation displaying Spearman correlation coefficients between RNA-seq data (CD8A and CD68 transcripts, CD8+ T-cell, and Macrophage enrichment scores), and IHC assessment of CD8+ T cells and CD68+ cells.](https://cdn.ncbi.nlm.nih.gov/pmc/blobs/3874/9762338/72d1ef2163d8/90fig3.jpg)
Comment in
References
-
- Ajona D, S. O-E, Lozano T, Exposito F, Calvo A, Valencia K, et al. Short-term starvation reduces IGF-1 levels to sensitize lung tumors to PD-1 immune checkpoint blockade. Nat Cancer 2020;1:75–85. - PubMed
Publication types
MeSH terms
Substances
LinkOut - more resources
Full Text Sources
Other Literature Sources
Medical
