. 2022 Feb;12(2):388-401.
doi: 10.1158/2159-8290.CD-21-0410. Epub 2021 Nov 17.

Implementing a Functional Precision Medicine Tumor Board for Acute Myeloid Leukemia

Affiliations

Implementing a Functional Precision Medicine Tumor Board for Acute Myeloid Leukemia

Disha Malani et al. Cancer Discov. 2022 Feb.

Abstract

We generated ex vivo drug-response and multiomics profiling data for a prospective series of 252 samples from 186 patients with acute myeloid leukemia (AML). A functional precision medicine tumor board (FPMTB) integrated clinical, molecular, and functional data for application in clinical treatment decisions. Actionable drugs were found for 97% of patients with AML, and the recommendations were clinically implemented in 37 relapsed or refractory patients. We report a 59% objective response rate for the individually tailored therapies, including 13 complete responses, as well as bridging five patients with AML to allogeneic hematopoietic stem cell transplantation. Data integration across all cases enabled the identification of drug response biomarkers, such as the association of IL15 overexpression with resistance to FLT3 inhibitors. Integration of molecular profiling and large-scale drug response data across many patients will enable continuous improvement of the FPMTB recommendations, providing a paradigm for individualized implementation of functional precision cancer medicine. SIGNIFICANCE: Oncogenomics data can guide clinical treatment decisions, but often such data are neither actionable nor predictive. Functional ex vivo drug testing contributes significant additional, clinically actionable therapeutic insights for individual patients with AML. Such data can be generated in four days, enabling rapid translation through FPMTB.See related commentary by Letai, p. 290.This article is highlighted in the In This Issue feature, p. 275.


Figures

Figure 1. Schematic of the design for the functional precision systems medicine study. The diagram illustrates how functional molecular precision systems medicine integrates high-throughput drug response assay and molecular profiling, aiming at individualized clinical translation of data for patients with AML. The n = 1 cycle on the left illustrates prospective real-time clinical translation through an FPMTB approach. The drug response and sequencing data are analyzed and integrated within a patient with a goal to tailor therapies in a realistic time frame. The n = many cycle on the right illustrates the data integration across a large sample set. The main goal here is to find possible biomarkers of drug responses, which eventually could also help to refine the rules of the FPMTB.
Figure 1.
Schematic of the design for the functional precision systems medicine study. The diagram illustrates how functional molecular precision systems medicine integrates high-throughput drug response assay and molecular profiling, aiming at individualized clinical translation of data for patients with AML. The n = 1 cycle on the left illustrates prospective real-time clinical translation through an FPMTB approach. The drug response and sequencing data are analyzed and integrated within a patient with a goal to tailor therapies in a realistic time frame. The n = many cycle on the right illustrates the data integration across a large sample set. The main goal here is to find possible biomarkers of drug responses, which eventually could also help to refine the rules of the FPMTB.
Figure 2. The outcome of patients treated with FPMTB-guided personalized therapies. A, The overall survival estimated by the Kaplan–Meier method of all patients (gray area denotes 95% confidence interval). B, Swimmer plot illustrates survival and therapy responses in 37 patients with R/R AML upon FPMTB-guided therapies, where the asterisk represents patients who received allogeneic hematopoietic stem cell transplantation after the treatment, and arrows represent the patients who are alive. The zero month represents the starting time point of the FPMTB-recommended therapy. The therapy responses—CR-MRDneg, complete response with minimal residual disease negative; CR-MRDpos, complete response with minimal residual disease positive; CR, complete remission; CRi, complete remission with incomplete hematologic recovery; PR, progressive disease; MLFS, bone marrow blasts <5%; RD, resistant disease—were defined by ELN-2017 criteria.
Figure 2.
The outcome of patients treated with FPMTB-guided personalized therapies. A, The overall survival estimated by the Kaplan–Meier method of all patients (gray area denotes 95% confidence interval). B, Swimmer plot illustrates survival and therapy responses in 37 patients with R/R AML upon FPMTB-guided therapies, where the asterisk represents patients who received allogeneic hematopoietic stem cell transplantation after the treatment, and arrows represent the patients who are alive. The zero month represents the starting time point of the FPMTB-recommended therapy. The therapy responses—CR-MRDneg, complete response with minimal residual disease negative; CR-MRDpos, complete response with minimal residual disease positive; CR, complete remission; CRi, complete remission with incomplete hematologic recovery; PR, progressive disease; MLFS, bone marrow blasts <5%; RD, resistant disease—were defined by ELN-2017 criteria.
Figure 3. Drug-response patterns in molecular subsets of AML. AML patient samples were categorized into molecular subclasses according to mutation status in common AML driver genes. Hierarchical clustering of samples using Euclidean distance and ward linkage for sDSS of 146 drugs in individual molecular subsets. The drugs were selected considering variance >10 and data points available in at least 20% of the samples. Gray bars in the drug-response heatmap indicate missing data. Fourteen recurrent AML driver genes, with at least three samples recurrently mutated and VAF > 25%, were displayed to indicate the mutation patterns in the molecular subsets. The disease status, age, medium used for drug testing, and cytogenetics information for each patient are displayed in the lower panel.
Figure 3.
Drug-response patterns in molecular subsets of AML. AML patient samples were categorized into molecular subclasses according to mutation status in common AML driver genes. Hierarchical clustering of samples using Euclidean distance and ward linkage for sDSS of 146 drugs in individual molecular subsets. The drugs were selected considering variance >10 and data points available in at least 20% of the samples. Gray bars in the drug-response heatmap indicate missing data. Fourteen recurrent AML driver genes, with at least three samples recurrently mutated and VAF > 25%, were displayed to indicate the mutation patterns in the molecular subsets. The disease status, age, medium used for drug testing, and cytogenetics information for each patient are displayed in the lower panel.
Figure 4. Somatic mutations as a molecular denominator of drug sensitivities. A, An overview of the mutation–drug response association analysis results. The top part of the table lists the total number of positive (drug sensitivity) and negative (drug resistance) gene–drug associations identified separately in the MCM and CM sample sets. The associations at FDR < 0.1 were considered significant. The lower part shows the number of drugs significantly associated with each selected gene mutation. For example, the FLT3-ITD mutation is positively associated with six drug responses in the MCM sample set and with three drugs in the CM sample set. B, The volcano plot illustrates the mean difference of sDSS values on the x-axis and adjusted P values on y-axis for each drug–gene pair in the CM sample set. The significant (FDR < 0.1, mean difference >5 or ≤5) drug–gene pairs were highlighted in blue (negative associations) or red (positive associations) where dark red dots show significant positive associations with the NPM1 gene. C, P values for NPM1 mutation–associated JAKi including the approved drugs ruxolitinib, baricitinib, and tofacitinib in the CM sample set. D, Hierarchical clustering of NPM1-mutant samples and sDSS of nine JAKi divide samples into two distinct subsets based on the presence of IDH1 or IDH2. E, The coexisting IDH1 or IDH2 in NPM1-mutated samples were significantly associated with strong JAKi sensitivity. F, The same association was significantly observed for ruxolitinib in the Beat AML data set (23).
Figure 4.
Somatic mutations as a molecular denominator of drug sensitivities. A, An overview of the mutation–drug response association analysis results. The top part of the table lists the total number of positive (drug sensitivity) and negative (drug resistance) gene–drug associations identified separately in the MCM and CM sample sets. The associations at FDR < 0.1 were considered significant. The lower part shows the number of drugs significantly associated with each selected gene mutation. For example, the FLT3-ITD mutation is positively associated with six drug responses in the MCM sample set and with three drugs in the CM sample set. B, The volcano plot illustrates the mean difference of sDSS values on the x-axis and adjusted P values on y-axis for each drug–gene pair in the CM sample set. The significant (FDR < 0.1, mean difference >5 or ≤5) drug–gene pairs were highlighted in blue (negative associations) or red (positive associations) where dark red dots show significant positive associations with the NPM1 gene. C,P values for NPM1 mutation–associated JAKi including the approved drugs ruxolitinib, baricitinib, and tofacitinib in the CM sample set. D, Hierarchical clustering of NPM1-mutant samples and sDSS of nine JAKi divide samples into two distinct subsets based on the presence of IDH1 or IDH2. E, The coexisting IDH1 or IDH2 in NPM1-mutated samples were significantly associated with strong JAKi sensitivity. F, The same association was significantly observed for ruxolitinib in the Beat AML data set (23).
Figure 5. Genomic and transcriptomics-based prediction of ex vivo drug efficacies. A, The division of 143 AML patient samples in actionable and nonactionable subsets. B, Ex vivo drug sensitivity of FLT3i in FLT3-ITD and point mutation–positive samples and of MEKi in KRAS/NRAS mutation–positive samples. C, Samples with complete molecular profiling and drug-response data ordered as per actionable driver mutations and subsequently nonactionable mutations. Selective drug responses for FDA/EMA-approved 77 drugs are depicted on the Y-axis and individual patient samples on the X-axis, where ineffective drugs below sDSS 8.7 were marked with gray rings. The common effective drugs were highlighted for integration with mutation and pathway activation. The bottom panel illustrates integrated ex vivo efficacy and the presence of respective mutations and pathways for each sample. D, Statistics of patient samples showing evidence of drug sensitivity, the presence of mutation, and pathway activation for key targeted drugs in AML including the BCL2i venetoclax, FLT3i midostaurin, TKi dasatinib, JAKi ruxolitinib, MEKi trametinib, and JAKi ruxolitinib. E, The drug-wise percentage of samples showing any evidence and no evidence from effective drug response, mutation, and/or pathway upregulation.
Figure 5.
Genomic and transcriptomics-based prediction of ex vivo drug efficacies. A, The division of 143 AML patient samples in actionable and nonactionable subsets. B,Ex vivo drug sensitivity of FLT3i in FLT3-ITD and point mutation–positive samples and of MEKi in KRAS/NRAS mutation–positive samples. C, Samples with complete molecular profiling and drug-response data ordered as per actionable driver mutations and subsequently nonactionable mutations. Selective drug responses for FDA/EMA-approved 77 drugs are depicted on the Y-axis and individual patient samples on the X-axis, where ineffective drugs below sDSS 8.7 were marked with gray rings. The common effective drugs were highlighted for integration with mutation and pathway activation. The bottom panel illustrates integrated ex vivo efficacy and the presence of respective mutations and pathways for each sample. D, Statistics of patient samples showing evidence of drug sensitivity, the presence of mutation, and pathway activation for key targeted drugs in AML including the BCL2i venetoclax, FLT3i midostaurin, TKi dasatinib, JAKi ruxolitinib, MEKi trametinib, and JAKi ruxolitinib. E, The drug-wise percentage of samples showing any evidence and no evidence from effective drug response, mutation, and/or pathway upregulation.
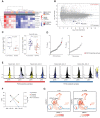
Figure 6. IL15 overexpression is associated with resistance to FLT3i in FLT3-ITD+ cells. A, Hierarchical clustering of FLT3-ITD–positive AML patient samples and six FLT3i resulted in two groups of the samples with high (sensitive group) and low (resistant group) efficacy to FLT3 inhibitors (FLT3i). B, Differential gene expression of FLT3i-sensitive versus FLT3i-resistant samples depicts upregulation of the IL15, CD14, and CD300E genes in the FLT3i-resistant group. C, The overexpression of IL15 was significant in FLT3-ITD–mutant FLT3i-resistant samples in our data and in the Beat AML data set. D, Gene set enrichment analysis of the genes upregulated in FLT3i-resistant samples depicts the MAPK pathway as the top enriched pathway. E, AML patient cells stimulated with human recombinant IL15 had increased phosphorylation of ERK compared with unstimulated control cells using phospho-flow cytometry. The color bar displays phosphorylation ratio to the control cells. F, FLT3i sensitivity and expression of IL15 in serial samples from the patient AML_129. G, The UMAP plots demonstrate expression of IL15 and IL15 receptor (IL15RA) in eight AML patient samples from published study (Dufva et al.; ref. 37).
Figure 6.
IL15 overexpression is associated with resistance to FLT3i in FLT3-ITD+ cells. A, Hierarchical clustering of FLT3-ITD–positive AML patient samples and six FLT3i resulted in two groups of the samples with high (sensitive group) and low (resistant group) efficacy to FLT3 inhibitors (FLT3i). B, Differential gene expression of FLT3i-sensitive versus FLT3i-resistant samples depicts upregulation of the IL15, CD14, and CD300E genes in the FLT3i-resistant group. C, The overexpression of IL15 was significant in FLT3-ITD–mutant FLT3i-resistant samples in our data and in the Beat AML data set. D, Gene set enrichment analysis of the genes upregulated in FLT3i-resistant samples depicts the MAPK pathway as the top enriched pathway. E, AML patient cells stimulated with human recombinant IL15 had increased phosphorylation of ERK compared with unstimulated control cells using phospho-flow cytometry. The color bar displays phosphorylation ratio to the control cells. F, FLT3i sensitivity and expression of IL15 in serial samples from the patient AML_129. G, The UMAP plots demonstrate expression of IL15 and IL15 receptor (IL15RA) in eight AML patient samples from published study (Dufva et al.; ref. 37).

Comment in

Similar articles

Cited by

References

    1. Döhner H, Weisdorf DJ, Bloomfield CD. Acute myeloid leukemia. N Engl J Med 2015;373:1136–52. - PubMed
    1. Estey E. Acute myeloid leukemia: 2016 update on risk-stratification and management. Am J Hematol 2016;91:824–46. - PubMed
    1. Assi SA, Imperato MR, Coleman DJL, Pickin A, Potluri S, Ptasinska Aet al. . Subtype-specific regulatory network rewiring in acute myeloid leukemia. Nat Genet 2019;51:151–62. - PMC - PubMed
    1. Gerstung M, Papaemmanuil E, Martincorena I, Bullinger L, Gaidzik VI, Paschka Pet al. . Precision oncology for acute myeloid leukemia using a knowledge bank approach. Nat Genet 2017;49:332–40. - PMC - PubMed
    1. Ley TJ, Miller C, Ding L, Raphael BJ, Mungall AJ, Robertson Aet al. . Genomic and epigenomic landscapes of adult de novo acute myeloid leukemia. N Engl J Med 2013;368:2059–74. - PMC - PubMed

Publication types