

DNA Methylation and Protein Markers of Chronic Inflammation and Their Associations With Brain and Cognitive Aging
- PMID: 34789543
- PMCID: PMC8665430
- DOI: 10.1212/WNL.0000000000012997
DNA Methylation and Protein Markers of Chronic Inflammation and Their Associations With Brain and Cognitive Aging
Abstract
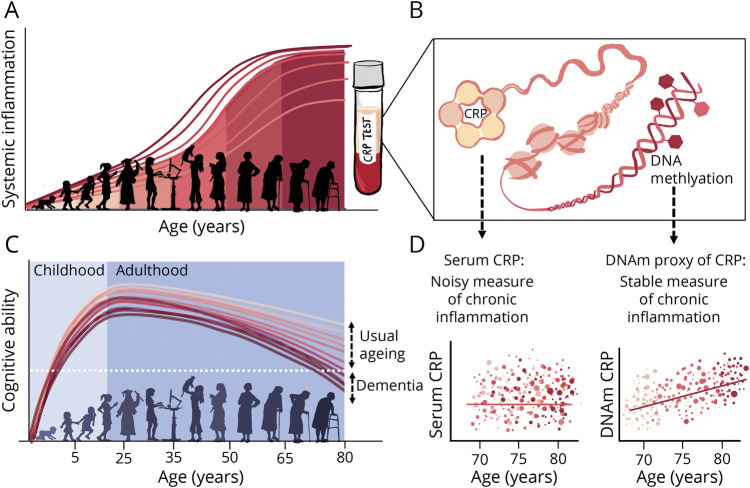
Background and objectives: To investigate chronic inflammation in relation to cognitive aging by comparison of an epigenetic and serum biomarker of C-reactive protein and their associations with neuroimaging and cognitive outcomes.
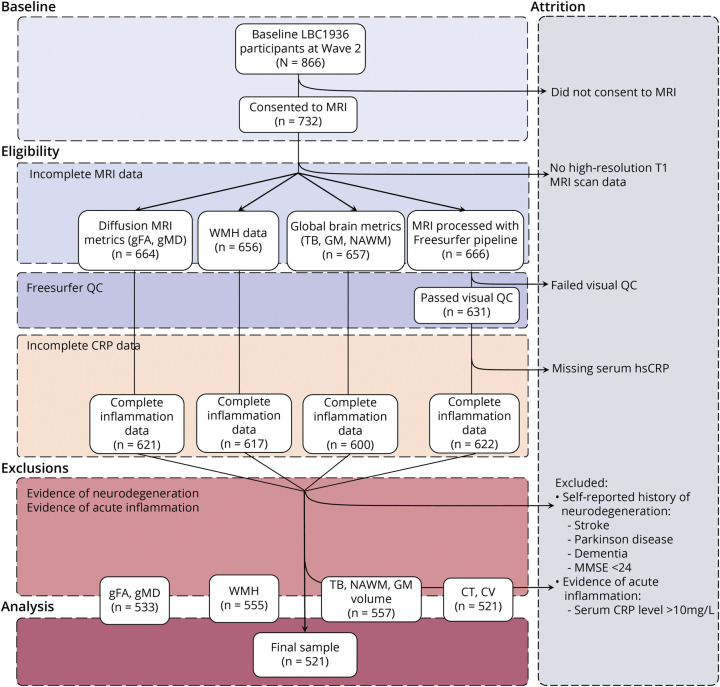
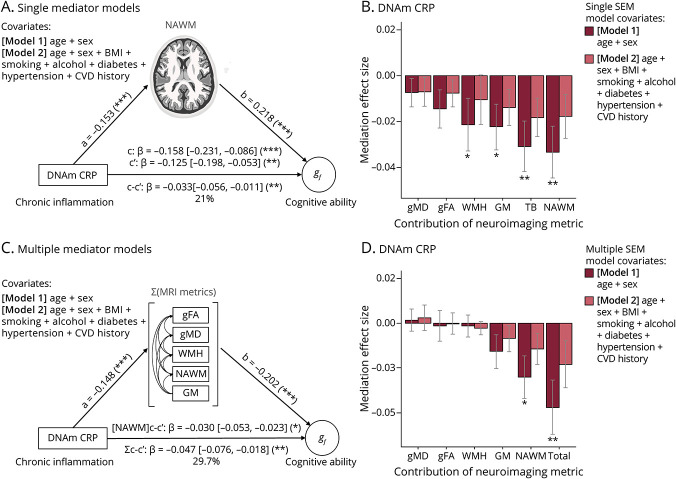
Methods: At baseline, participants (n = 521) were cognitively normal, around 73 years of age (mean 72.4, SD 0.716), and had inflammation, vascular risk (cardiovascular disease history, hypertension, diabetes, smoking, alcohol consumption, body mass index), and neuroimaging (structural and diffusion MRI) data available. Baseline inflammatory status was quantified by a traditional measure of peripheral inflammation-serum C-reactive protein (CRP)-and an epigenetic measure (DNA methylation [DNAm] signature of CRP). Linear models were used to examine the inflammation-brain health associations; mediation analyses were performed to interrogate the relationship between chronic inflammation, brain structure, and cognitive functioning.
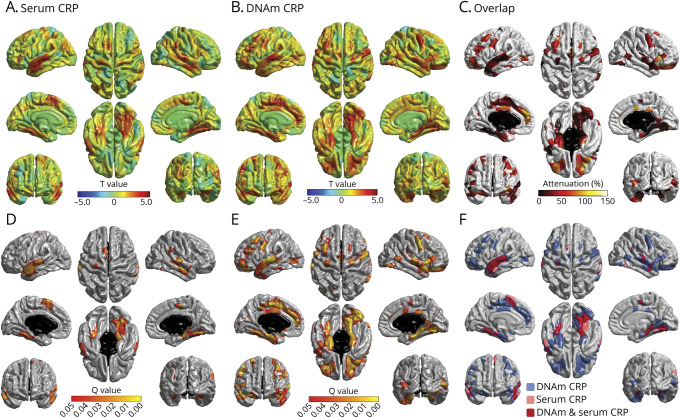
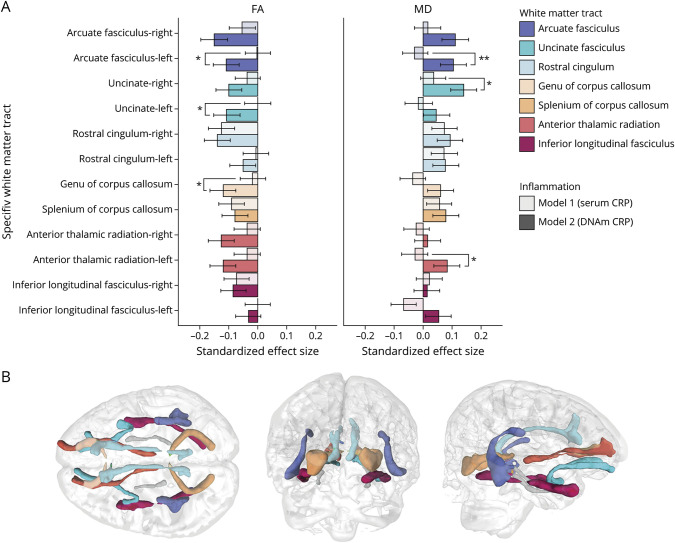
Results: We demonstrate that DNAm CRP shows significantly (on average 6.4-fold) stronger associations with brain health outcomes than serum CRP. DNAm CRP is associated with total brain volume (β = -0.197, 95% confidence interval [CI] -0.28 to -0.12, p FDR = 8.42 × 10⁻⁶), gray matter volume (β = -0.200, 95% CI -0.28 to -0.12, p FDR = 1.66 × 10⁻⁵), and white matter volume (β = -0.150, 95% CI -0.23 to -0.07, p FDR = 0.001) and regional brain atrophy. We also find that DNAm CRP has an inverse association with global and domain-specific (speed, visuospatial, and memory) cognitive functioning and that brain structure partially mediates this CRP-cognitive association (up to 29.7%), dependent on lifestyle and health factors.
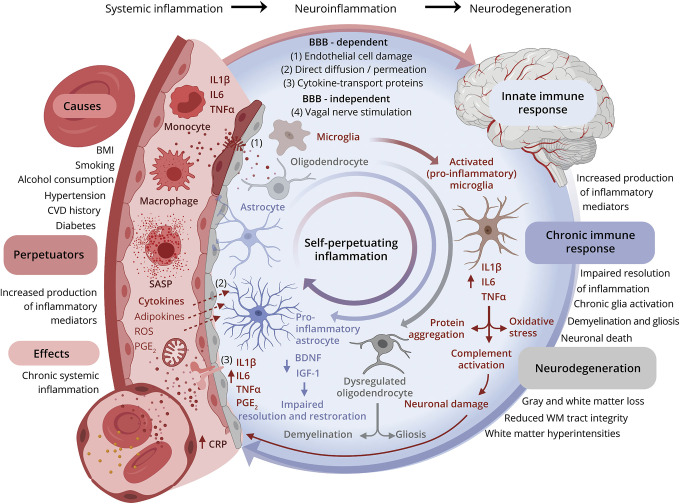
Discussion: These results support the hypothesis that chronic inflammation may contribute to neurodegenerative brain changes that underlie differences in cognitive ability in later life and highlight the potential of DNAm proxies for indexing chronic inflammatory status.
Classification of evidence: This study provides Class II evidence that a DNAm signature of CRP levels is more strongly associated with brain health outcomes than serum CRP levels.
Copyright © 2021 The Author(s). Published by Wolters Kluwer Health, Inc. on behalf of the American Academy of Neurology.
Figures
Similar articles
-
Inflammatory markers and imaging patterns of advanced brain aging in the general population.Brain Imaging Behav. 2020 Aug;14(4):1108-1117. doi: 10.1007/s11682-019-00058-y. Brain Imaging Behav. 2020. PMID: 30820858 Free PMC article.
-
Immuno-epigenetic signature derived in saliva associates with the encephalopathy of prematurity and perinatal inflammatory disorders.Brain Behav Immun. 2023 May;110:322-338. doi: 10.1016/j.bbi.2023.03.011. Epub 2023 Mar 21. Brain Behav Immun. 2023. PMID: 36948324
-
Early-life smoking, cardiovascular disease risk, and the mediating role of DNA methylation biomarkers of aging.J Transl Med. 2025 Apr 29;23(1):484. doi: 10.1186/s12967-025-06492-5. J Transl Med. 2025. PMID: 40301976 Free PMC article.
-
Characterisation of an inflammation-related epigenetic score and its association with cognitive ability.Clin Epigenetics. 2020 Jul 27;12(1):113. doi: 10.1186/s13148-020-00903-8. Clin Epigenetics. 2020. PMID: 32718350 Free PMC article.
-
A systematic review of neuroimaging epigenetic research: calling for an increased focus on development.Mol Psychiatry. 2023 Jul;28(7):2839-2847. doi: 10.1038/s41380-023-02067-2. Epub 2023 Apr 25. Mol Psychiatry. 2023. PMID: 37185958 Free PMC article.
Cited by
-
Associations of DNA-methylation measures of biological aging with social disparities in child and adolescent mental health.Clin Psychol Sci. 2024 Jul;12(4):551-562. doi: 10.1177/21677026231186802. Epub 2023 Aug 7. Clin Psychol Sci. 2024. PMID: 39421195 Free PMC article.
-
Blood-based epigenome-wide analyses of chronic low-grade inflammation across diverse population cohorts.Cell Genom. 2024 May 8;4(5):100544. doi: 10.1016/j.xgen.2024.100544. Epub 2024 Apr 30. Cell Genom. 2024. PMID: 38692281 Free PMC article.
-
Epigenomic insights into common human disease pathology.Cell Mol Life Sci. 2024 Apr 11;81(1):178. doi: 10.1007/s00018-024-05206-2. Cell Mol Life Sci. 2024. PMID: 38602535 Free PMC article. Review.
-
Lessons we learned from the Lothian Birth Cohorts of 1921 and 1936.Genom Psychiatry. 2025;1(1):47-60. doi: 10.61373/gp024i.0076. Epub 2024 Nov 7. Genom Psychiatry. 2025. PMID: 40469939 Free PMC article.
-
DNA Methylation at C-Reactive Protein-Associated CpG Sites May Mediate the Pathway Between Educational Attainment and Cognition.J Gerontol A Biol Sci Med Sci. 2024 Aug 1;79(8):glae159. doi: 10.1093/gerona/glae159. J Gerontol A Biol Sci Med Sci. 2024. PMID: 38896024 Free PMC article.
References
-
- Franceschi C, Campisi J. Chronic inflammation (inflammaging) and its potential contribution to age-associated diseases. J Gerontol A Biol Sci Med Sci. 2014;69(suppl 1):S4-S9. - PubMed
Publication types
MeSH terms
Substances
Grants and funding
- MR/K026992/1/MRC_/Medical Research Council/United Kingdom
- 108890/Z/15/Z/WT_/Wellcome Trust/United Kingdom
- MR/M020827/1/MRC_/Medical Research Council/United Kingdom
- 221890/Z/20/Z/WT_/Wellcome Trust/United Kingdom
- MR/V031260/1/MRC_/Medical Research Council/United Kingdom
- G0700704/MRC_/Medical Research Council/United Kingdom
- G0701120/MRC_/Medical Research Council/United Kingdom
- 203771/Z/16/Z/WT_/Wellcome Trust/United Kingdom
- R01 AG054628/AG/NIA NIH HHS/United States
- BB_/Biotechnology and Biological Sciences Research Council/United Kingdom
- G1001245/MRC_/Medical Research Council/United Kingdom
- MR/R024065/1/MRC_/Medical Research Council/United Kingdom
- MR/M013111/1/MRC_/Medical Research Council/United Kingdom
- MC_PC_17209/MRC_/Medical Research Council/United Kingdom
LinkOut - more resources
Full Text Sources
Research Materials
Miscellaneous