. 2021 Nov;9(11):e003213.
doi: 10.1136/jitc-2021-003213.

Empirical identification and validation of tumor-targeting T cell receptors from circulation using autologous pancreatic tumor organoids

Affiliations

Empirical identification and validation of tumor-targeting T cell receptors from circulation using autologous pancreatic tumor organoids

Qingda Meng et al. J Immunother Cancer. 2021 Nov.

Erratum in

Abstract

Background: Tumor-specific cytotoxic T cells and T cell receptors are effective tools for cancer immunotherapy. Most efforts to identify them rely on known antigens or lymphocytes that have infiltrated into the tumor bed. Approaches to empirically identify tumor-targeting T cells and T cell receptors by exploiting all antigens expressed on tumor cell surfaces are not well developed for most carcinomas, including pancreatic cancer.

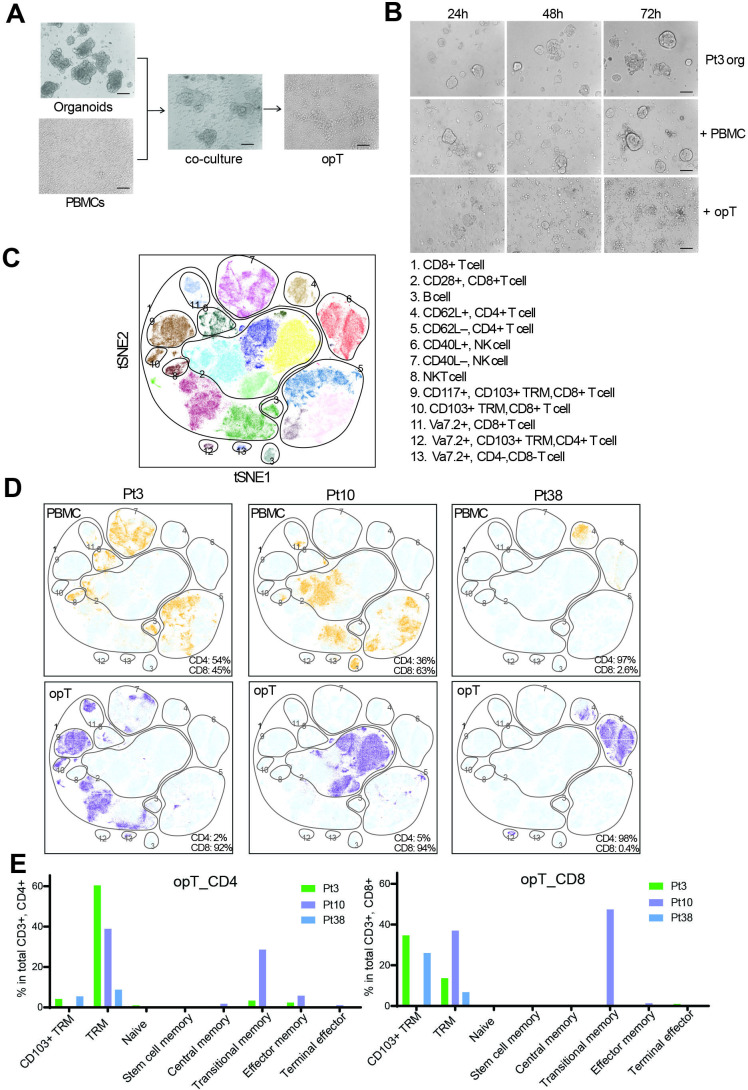
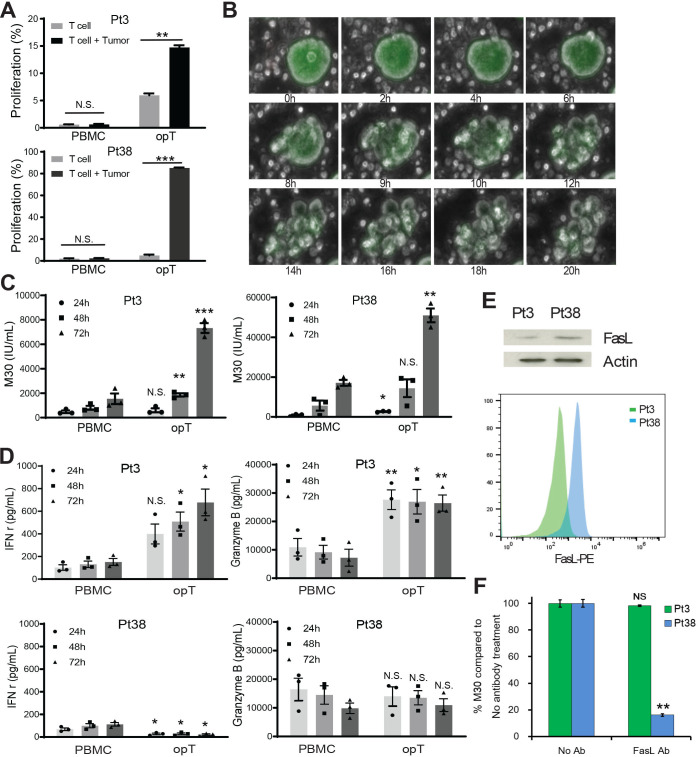
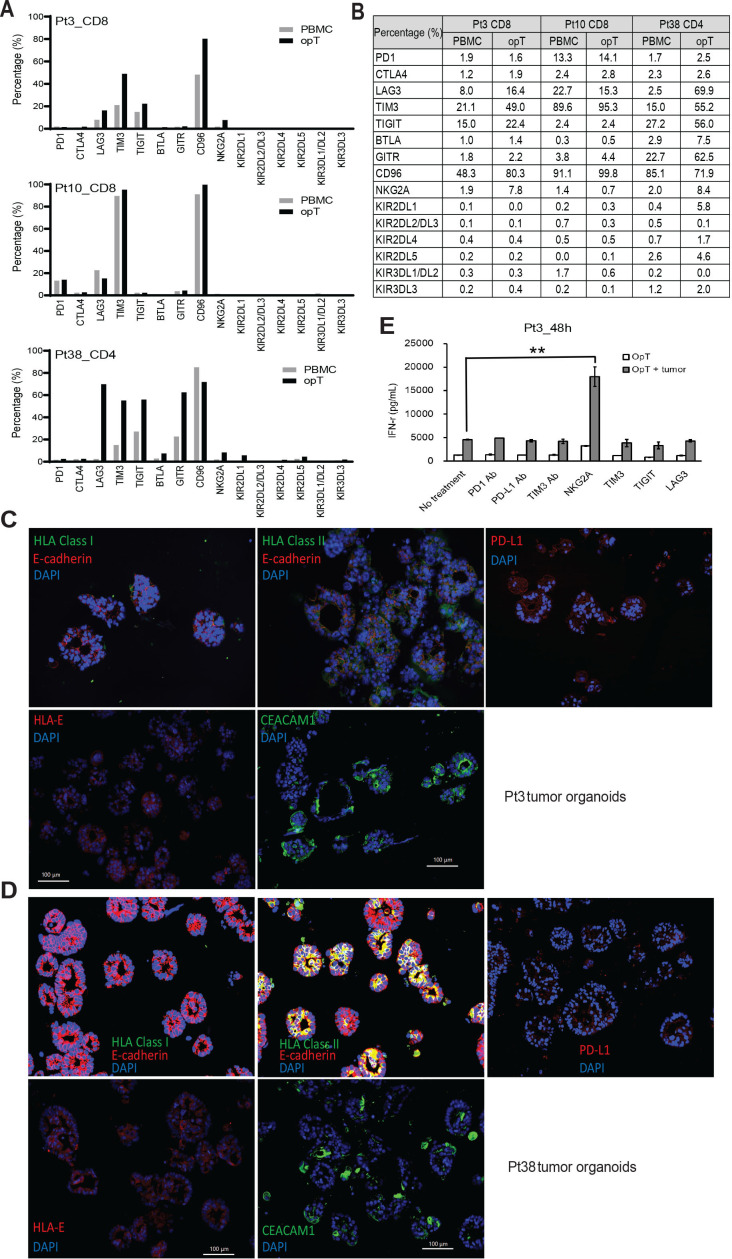
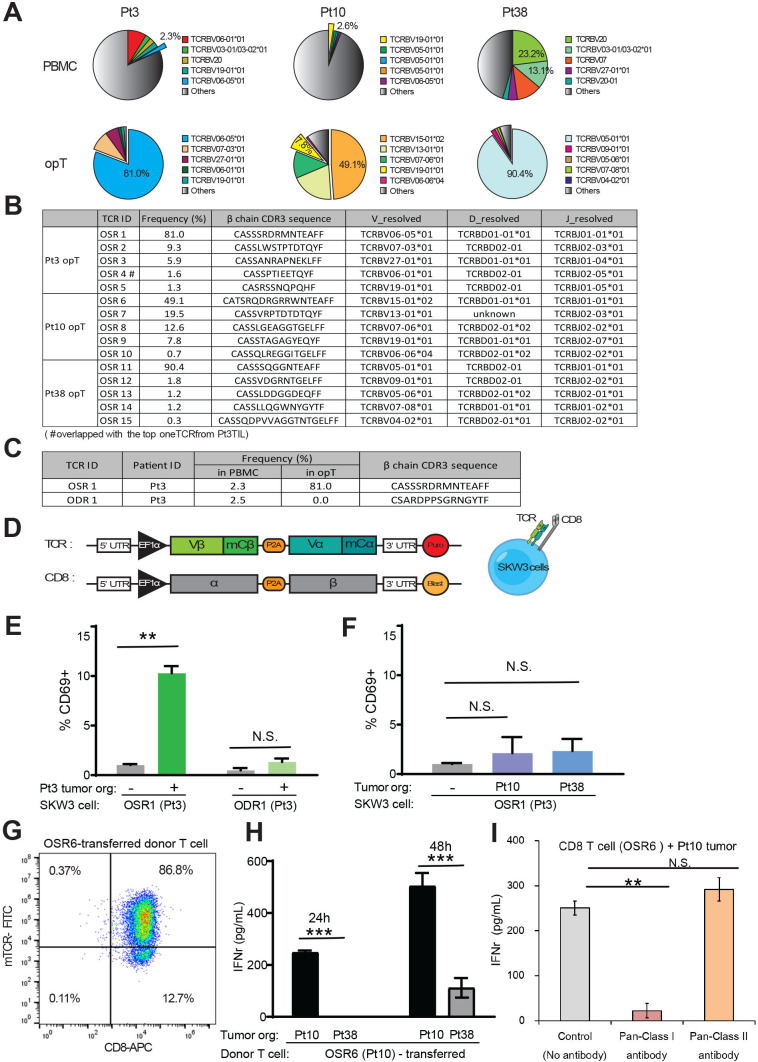
Methods: Autologous tumor organoids were stimulated with T cells from the patients' peripheral blood for 2 weeks to generate the organoid-primed T (opT) cells. opT cell phenotype was analyzed by monitoring changes in the expression levels of 28 cell surface and checkpoint proteins. Expression of ligands of the immune checkpoints was investigated by immunohistochemistry staining. T cells were labeled with carboxyfluorescein succinimidyl ester (CFSE) and assayed by flow cytometry to monitor tumor-induced T cell proliferation changes. opT cell-mediated killing of three-dimensional organoids was measured using an M30 ELISA kit. T cell receptors (TCRs) were identified by deep sequencing of gDNA isolated from T cells, and the TCR specificity was confirmed by transferring TCRs to the T cell line SKW-3 or donor T cells.

Results: The co-culture was effective in the generation of CD8 + or CD4+opT cells. The opT cells killed autologous tumors in a granzyme B or Fas-Fas ligand-dependent manner and expressed markers of tissue-resident memory phenotype. Each patient-derived opT cell culture displayed a unique complement of checkpoint proteins. Interestingly, only NKG2A blockade showed a potent increase in the interferon-γ production compared with blocking programmed cell death protein 1 (PD-1) or programmed cell death ligand 1 (PD-L1) or TIM3 or TIGIT or LAG3. Importantly, TCR sequencing demonstrated a dramatic clonal expansion of T cells with a restricted subset of TCRs. Cloning and transferring the TCRs to heterologous T cells was sufficient to confer tumor cell recognition and cytotoxic properties in a patient-specific manner.

Conclusion: We report a platform for expanding tumor-targeting T cells from the peripheral blood of patients with pancreatic cancer. We identify the NKG2A-HLA-E axis as a potentially important checkpoint for CD8 +T cells for pancreatic cancer. Lastly, we demonstrate empirical identification of tumor-targeting TCRs that can be used for TCR-therapeutics.

Keywords: antigen-mediated; clonal selection; gastrointestinal neoplasms; immunologic techniques.


Conflict of interest statement

Competing interests: LH and SKM have a patent application pending for the PTOM media used in this study (US20170267977A1). SKM consults for KAHR Medical. MH has stock and ownership interests in Champions Oncology, PharmaCyte Biotech, Bioncotech, Nelum, and Agenus; honoraria include Takeda, Agenus, InxMed, Pharmacyte, BioOncotech, Tolero, Novartis, Oncomatrix, KAHR Medical; he has a consulting or advisory role for Takeda, Agenus, InxMed, Pharmacyte, BioOncotech, Tolero, Novartis, Oncomatrix, KAHR Medical; his patents, royalties, and other intellectual property include: Myriad Genetics. Other authors declare no conflict of interest.

Figures

Figure 1
Figure 1
Generation and characterization of tumor-targeting cytotoxic T cells using autologous tumor organoids. (A) Patient tumor organoids co-cultured with autologous PBMC for 14 days for generation of organoid-primed T (opT) cells. Scale bar, 100 µm. (B) Representative phase-contrast images for Pt3 tumor organoids alone or co-culture with autologous PBMC or opT at different time points to demonstrate cell killing. Scale bar, 100 µm. (C) t-SNE plot showing all possible clusters detectable by CyTOF analysis of the six samples. The CyTOF clusters were assembled into 13 phenotypic groups for interpretation. (D) Comparison of PBMC (yellow) and opT (purple) cells for the presence of CyTOF clusters against the background of all possible clusters (light blue). The percentage of CD4 +and CD8+ cells within the CD3 + population is shown in the bottom right. (E) Phenotypes in CD4 + or CD8+ opT cell populations grouped per marker expression. See online supplemental table S2A for the makers used to define the phenotypes. CyTOF, cytometry by time-of-flight; h, hours; NK, natural killer; PBMCs, peripheral blood mononuclear cells; Pt, patient; TRM, tissue-resident memory; t-SNE, t-distributed Stochastic Neighbor Embedding.
Figure 2
Figure 2
Cytotoxic activity of opT cells. (A) CFSE (carboxyfluorescein succinimidyl ester) labeled PBMC and opT cell proliferation were co-cultured with autologous tumor organoids for 4 days and changes in percentage of CFSE-low T cell population shown. Mean±SEM from three independent experiments shown. N.S., not significant. **, p<0.01. ***, p<0.001. P value calculated using two-tailed, unpaired t-test. (B) Time lapse image of fluorescently labeled organoids (green) incubated with unlabeled opT cells over a period of 20 hours. Scale bar, 100 µm. (C) Changes in levels of epithelial cell-specific caspase-cleaved cytokeratin 18 (CK18) fragments containing the CK18Asp396 (‘M30’) neo-epitope in the media, quantitated by ELISA. Mean±SEM from three independent experiments shown. Each dot represents the mean of three technical replicates from independent experiments. N.S., not significant. *, p<0.05. **, p<0.01. ***, p<0.001. P value calculated using two-tailed, unpaired t-test. (D) Interferon gamma (IFN-γ) and granzyme B produced by PBMC or opT in the presence of autologous tumor organoids at different time points for Pt3 and Pt38. Mean±SEM from three independent experiments shown. Each dot represents the mean of at least two technical replicates from independent experiments. N.S., not significant. *, p<0.05. **, p<0.01. P value calculated using two-tailed, unpaired t-test. (E) FasL expression in opT cells from Pt3 and Pt38 by immunoblot or flow cytometry. (F) Relative M30 production from the supernatants of Pt38 or Pt3 co-cultured in the presence or absence of anti-FasL blocking antibody for 72 hours. NS, not significant. **, p<0.01. P value calculated using two-tailed, unpaired t-test. FasL, Fas-Fas ligand; h, hours; opT, organoid-primed T; PBMCs, peripheral blood mononuclear cells; Pt, patient.
Figure 3
Figure 3
Expression of immunomodulatory proteins and response to checkpoint inhibition in opT cells. (A, B) Expression of checkpoint proteins in opT cells compared with the matched PBMCs by flow cytometry and CyTOF. (C, D) Immuno-staining for MHC-I, MHC-II, PD-L1, HLA-E and CEACAM1 in tumor organoids from Pt3 and Pt38. (E) Changes in interferon-γ secretion by opT cells after 48 hours of pretreatment with anti-PD-1, PD-L1 and TIM3 locking antibodies (10 µg/mL) or NKG2A, TIM3, TIGIT and LAG3 protein (2 µg/mL), in the presence or absence of autologous tumor organoids from Pt3. **, p<0.01 compared with opT plus tumor without antibody treatment. P value calculated using two-tailed, unpaired t-test. CyTOF, cytometry by time-of-flight; opT, organoid-primed T; PBMCs, peripheral blood mononuclear cells; Pt, patient.
Figure 4
Figure 4
Clonal expansion in opT cells and identification of TCR. (A) Pie-charts showing representation of a given TCR beta-chain as a percentage of the all the independent TCRs detected. (B) Frequencies and CDR3 beta-chain sequences for the top five organoid-selected TCR (OSR) from each patient. (C) TCR enriched in Pt3 opT and organoid-depleted TCR (ODR1) used for generation of recombinant TCR. (D) A schematic of chimeric TCR that comprised of human Vα and Vβ chains and mouse constant α and β chains and co-expressed with human CD8 gene in SKW-3 cells. (E) Expression of T cell activation marker (CD69) in TCR-expressing SKW-3 cells exposed to autologous (Pt3) tumor organoids. N.S., not significant. **, p<0.01. P value calculated using two-tailed, unpaired t-test. (F) Expression of CD69 in OSR1 expressing SKW-3 cells exposed to allogenic (Pt10 and Pt38) tumor organoids. N.S., not significant. (G) CD8 + T cells from a donor PBMC were transduced with the chimeric TCR (OSR6) and flow sorted by mouse-TCR chimera (mTCR-FITC) expression. (H) OSR6 expressing CD8 + T cells were exposed to autologous (Pt10) or allogenic (Pt38) organoids and media analyzed for IFN-γ by ELISA. ***, p<0.001. P value calculated using two-tailed, unpaired t-test. (I) OSR6 expressing CD8 + T cells were exposed to autologous (Pt10) organoids with either Pan-MHC Class I antibody (W6/32) or Pan-MHC Class II antibody (Tu39) and media analyzed for IFN-γ by ELISA. N.S., not significant. **, p<0.01. P value calculated using two-tailed, unpaired t-test. IFN, interferon; opT, organoid-primed T; PBMCs, peripheral blood mononuclear cells; Pt, patient; TCR, T cell receptor.

Similar articles

Cited by

References

    1. Rosenberg SA, Restifo NP. Adoptive cell transfer as personalized immunotherapy for human cancer. Science 2015;348:62–8. 10.1126/science.aaa4967 - DOI - PMC - PubMed
    1. Rosenberg SA, Spiess P, Lafreniere R. A new approach to the adoptive immunotherapy of cancer with tumor-infiltrating lymphocytes. Science 1986;233:1318–21. 10.1126/science.3489291 - DOI - PubMed
    1. Stevanović S, Draper LM, Langhan MM, et al. . Complete regression of metastatic cervical cancer after treatment with human papillomavirus-targeted tumor-infiltrating T cells. J Clin Oncol 2015;33:1543–50. 10.1200/JCO.2014.58.9093 - DOI - PMC - PubMed
    1. Rosenberg SA, Packard BS, Aebersold PM, et al. . Use of tumor-infiltrating lymphocytes and interleukin-2 in the immunotherapy of patients with metastatic melanoma. A preliminary report. N Engl J Med 1988;319:1676–80. 10.1056/NEJM198812223192527 - DOI - PubMed
    1. Gros A, Robbins PF, Yao X, et al. . PD-1 identifies the patient-specific CD8⁺ tumor-reactive repertoire infiltrating human tumors. J Clin Invest 2014;124:2246–59. 10.1172/JCI73639 - DOI - PMC - PubMed

Publication types

Substances