

Antagonistic cotranscriptional regulation through ARGONAUTE1 and the THO/TREX complex orchestrates FLC transcriptional output
- PMID: 34789567
- PMCID: PMC8617408
- DOI: 10.1073/pnas.2113757118
Antagonistic cotranscriptional regulation through ARGONAUTE1 and the THO/TREX complex orchestrates FLC transcriptional output
Abstract
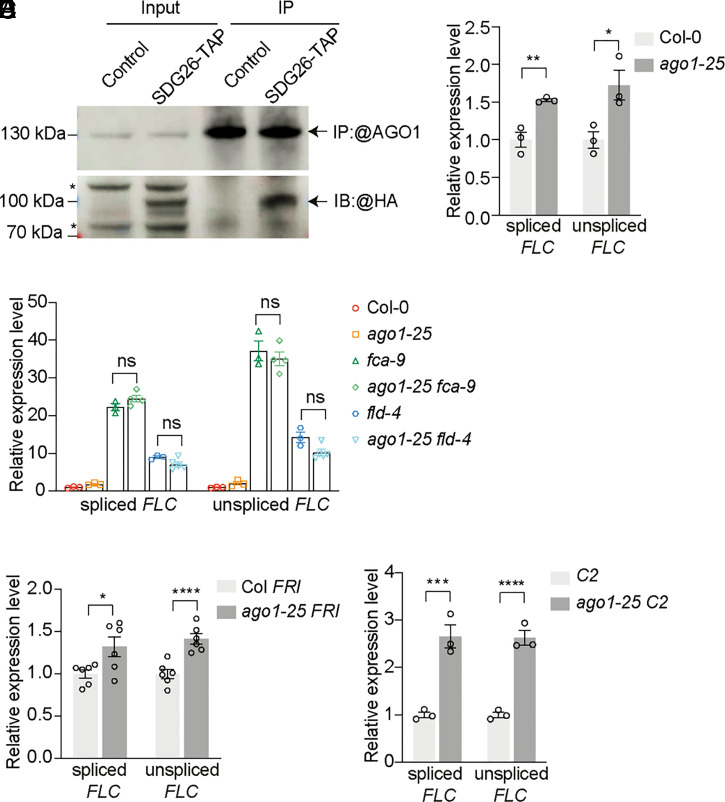
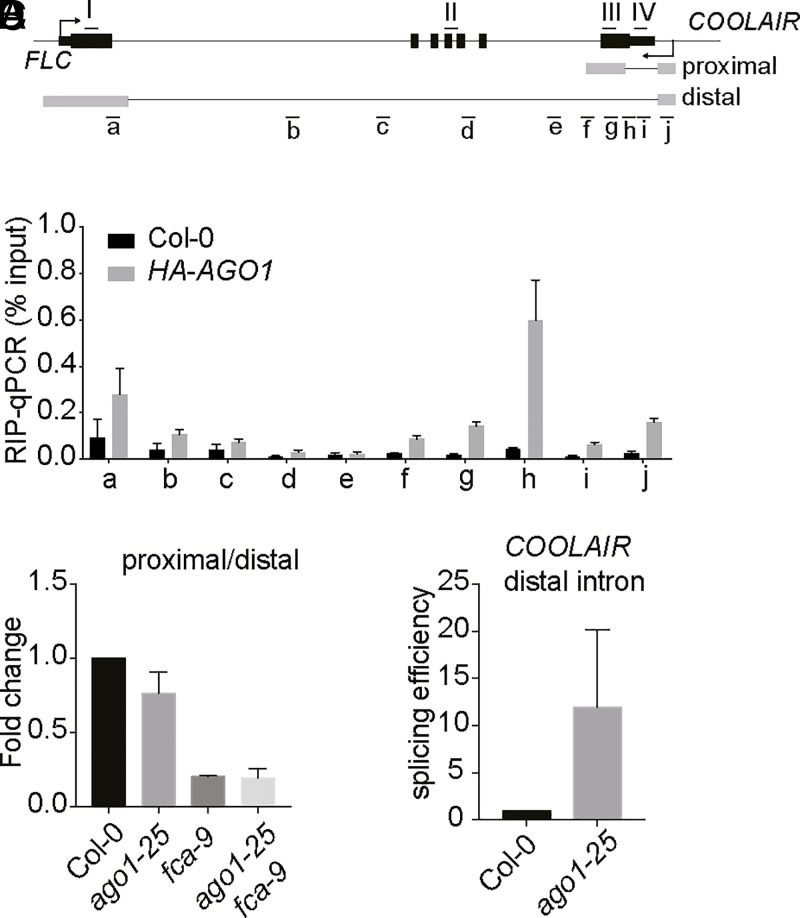
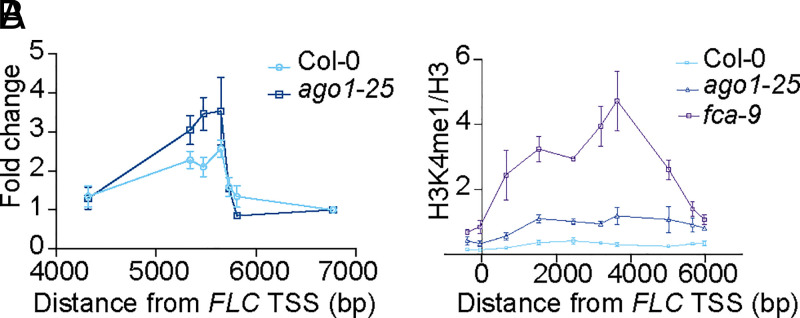
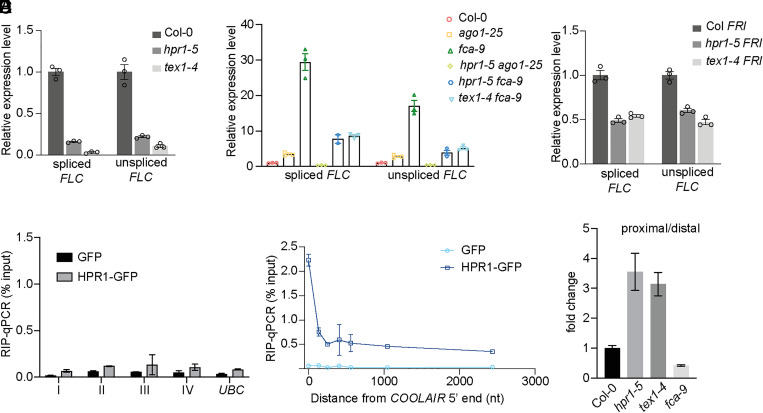
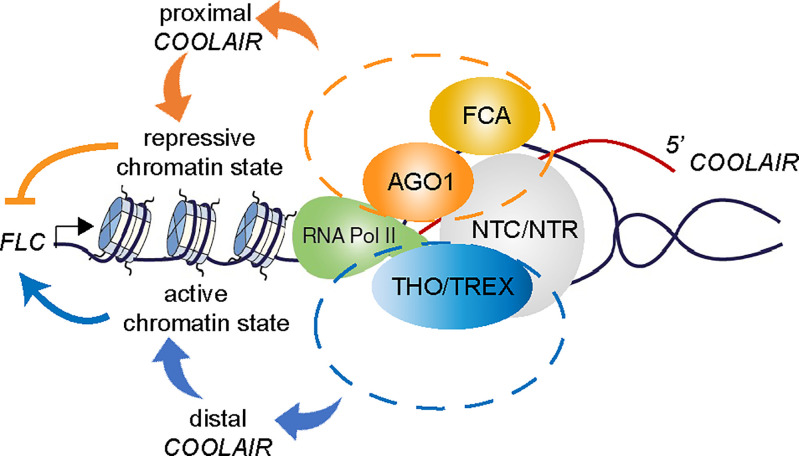
Quantitative transcriptional control is essential for physiological and developmental processes in many organisms. Transcriptional output is influenced by cotranscriptional processes interconnected to chromatin regulation, but how the functions of different cotranscriptional regulators are integrated is poorly understood. The Arabidopsis floral repressor locus FLOWERING LOCUS C (FLC) is cotranscriptionally repressed by alternative processing of the antisense transcript COOLAIR. Proximal 3'-end processing of COOLAIR resolves a cotranscriptionally formed R-loop, and this process physically links to a histone-modifying complex FLD/SDG26/LD. This induces a chromatin environment locally that determines low transcription initiation and a slow elongation rate to both sense and antisense strands. Here, we show that ARGONAUTE1 (AGO1) genetically functions in this cotranscriptional repression mechanism. AGO1 associates with COOLAIR and influences COOLAIR splicing dynamics to promote proximal COOLAIR, R-loop resolution, and chromatin silencing. Proteomic analyses revealed physical associations between AGO1, subunits of RNA Polymerase II (Pol II), the splicing-related proteins-the spliceosome NineTeen Complex (NTC) and related proteins (NTR)-and the THO/TREX complex. We connect these activities by demonstrating that the THO/TREX complex activates FLC expression acting antagonistically to AGO1 in COOLAIR processing. Together these data reveal that antagonistic cotranscriptional regulation through AGO1 or THO/TREX influences COOLAIR processing to deliver a local chromatin environment that determines FLC transcriptional output. The involvement of these conserved cotranscriptional regulators suggests similar mechanisms may underpin quantitative transcriptional regulation generally.
Keywords: ARGONAUTE1; RNA processing; THO/TREX complex; cotranscription.
Copyright © 2021 the Author(s). Published by PNAS.
Conflict of interest statement
The authors declare no competing interest.
Figures
Comment in
-
Nuclear roles for Argonaute proteins in the control of flowering.Proc Natl Acad Sci U S A. 2021 Dec 28;118(52):e2120124118. doi: 10.1073/pnas.2120124118. Proc Natl Acad Sci U S A. 2021. PMID: 34949645 Free PMC article. No abstract available.
Similar articles
-
Quantitative regulation of FLC via coordinated transcriptional initiation and elongation.Proc Natl Acad Sci U S A. 2016 Jan 5;113(1):218-23. doi: 10.1073/pnas.1518369112. Epub 2015 Dec 22. Proc Natl Acad Sci U S A. 2016. PMID: 26699513 Free PMC article.
-
Functional consequences of splicing of the antisense transcript COOLAIR on FLC transcription.Mol Cell. 2014 Apr 10;54(1):156-165. doi: 10.1016/j.molcel.2014.03.026. Mol Cell. 2014. PMID: 24725596 Free PMC article.
-
Cotranscriptional splicing is required in the cold to produce COOLAIR isoforms that repress Arabidopsis FLC.Proc Natl Acad Sci U S A. 2024 Nov 19;121(47):e2407628121. doi: 10.1073/pnas.2407628121. Epub 2024 Nov 15. Proc Natl Acad Sci U S A. 2024. PMID: 39546565 Free PMC article.
-
Role of chromatin modification in flowering-time control.Trends Plant Sci. 2005 Jan;10(1):30-5. doi: 10.1016/j.tplants.2004.11.003. Trends Plant Sci. 2005. PMID: 15642521 Review.
-
Flowering time control: another window to the connection between antisense RNA and chromatin.Trends Genet. 2012 Sep;28(9):445-53. doi: 10.1016/j.tig.2012.06.002. Epub 2012 Jul 10. Trends Genet. 2012. PMID: 22785023 Review.
Cited by
-
Quantifying the role of genome size and repeat content in adaptive variation and the architecture of flowering time in Amaranthus tuberculatus.PLoS Genet. 2023 Dec 27;19(12):e1010865. doi: 10.1371/journal.pgen.1010865. eCollection 2023 Dec. PLoS Genet. 2023. PMID: 38150485 Free PMC article.
-
R-loops at microRNA encoding loci promote co-transcriptional processing of pri-miRNAs in plants.Nat Plants. 2022 Apr;8(4):402-418. doi: 10.1038/s41477-022-01125-x. Epub 2022 Apr 21. Nat Plants. 2022. PMID: 35449404 Free PMC article.
-
Flowering time: From physiology, through genetics to mechanism.Plant Physiol. 2024 Apr 30;195(1):190-212. doi: 10.1093/plphys/kiae109. Plant Physiol. 2024. PMID: 38417841 Free PMC article. Review.
-
Plants use molecular mechanisms mediated by biomolecular condensates to integrate environmental cues with development.Plant Cell. 2023 Sep 1;35(9):3173-3186. doi: 10.1093/plcell/koad062. Plant Cell. 2023. PMID: 36879427 Free PMC article. Review.
-
Nuclear roles for Argonaute proteins in the control of flowering.Proc Natl Acad Sci U S A. 2021 Dec 28;118(52):e2120124118. doi: 10.1073/pnas.2120124118. Proc Natl Acad Sci U S A. 2021. PMID: 34949645 Free PMC article. No abstract available.
References
-
- Penny G. D., Kay G. F., Sheardown S. A., Rastan S., Brockdorff N., Requirement for Xist in X chromosome inactivation. Nature 379, 131–137 (1996). - PubMed
Publication types
MeSH terms
Substances
Grants and funding
LinkOut - more resources
Full Text Sources
Molecular Biology Databases
Research Materials
