. 2021 Nov 17;12(1):6655.
doi: 10.1038/s41467-021-26821-8.

Cold and heterogeneous T cell repertoire is associated with copy number aberrations and loss of immune genes in small-cell lung cancer

Affiliations

Cold and heterogeneous T cell repertoire is associated with copy number aberrations and loss of immune genes in small-cell lung cancer

Ming Chen et al. Nat Commun. .

Abstract

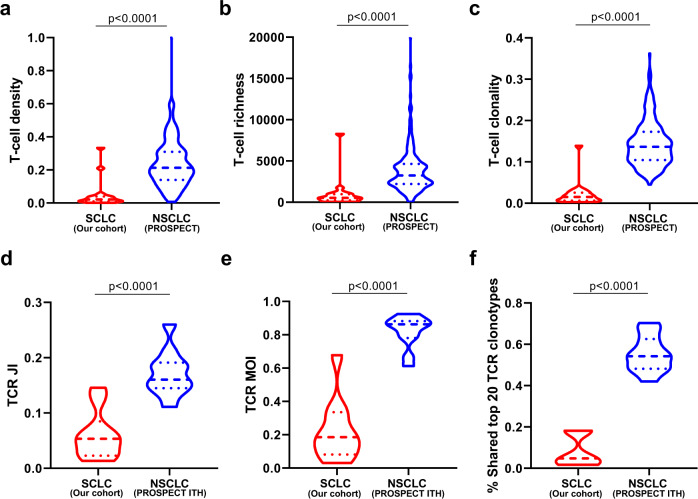
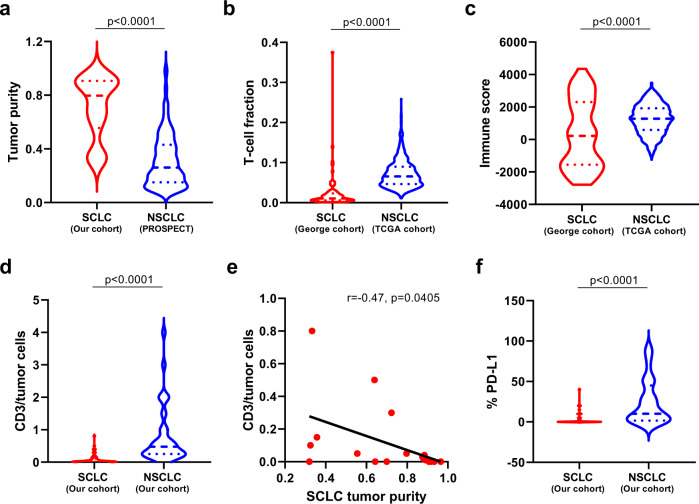
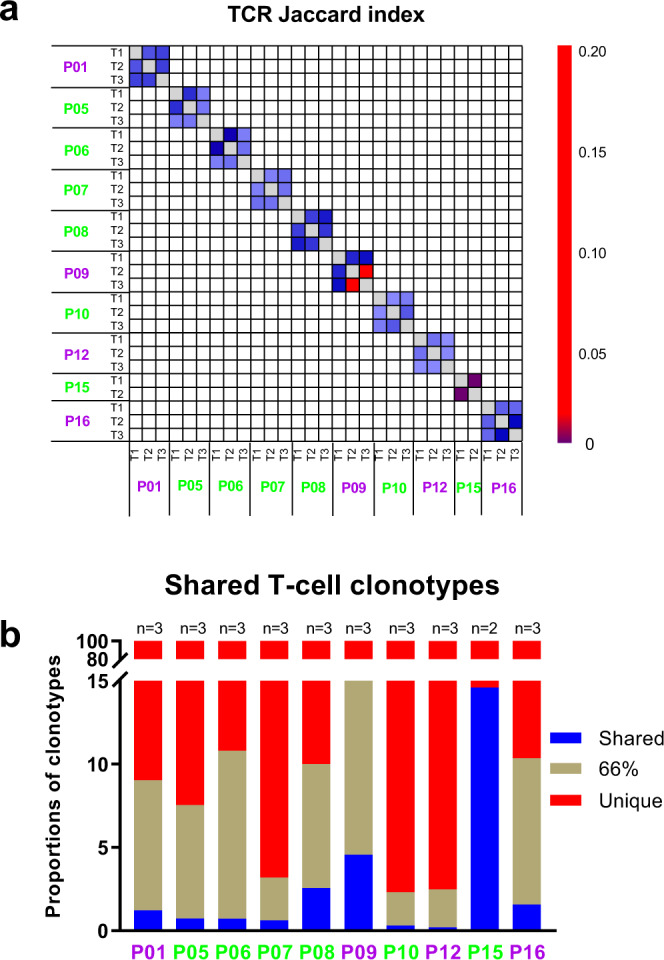
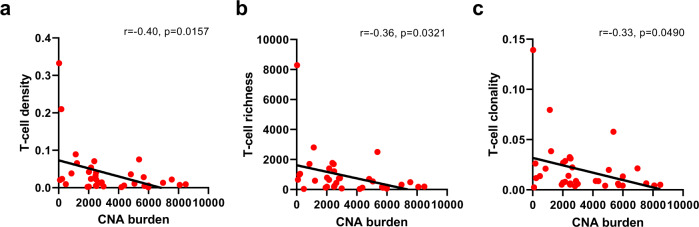
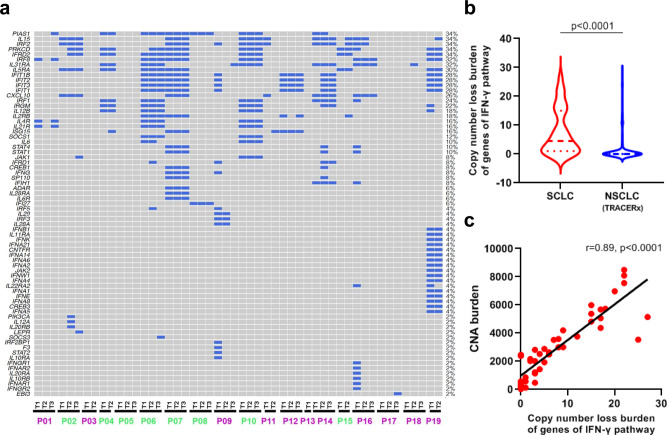
Small-cell lung cancer (SCLC) is speculated to harbor complex genomic intratumor heterogeneity (ITH) associated with high recurrence rate and suboptimal response to immunotherapy. Here, using multi-region whole exome/T cell receptor (TCR) sequencing as well as immunohistochemistry, we reveal a rather homogeneous mutational landscape but extremely cold and heterogeneous TCR repertoire in limited-stage SCLC tumors (LS-SCLCs). Compared to localized non-small cell lung cancers, LS-SCLCs have similar predicted neoantigen burden and genomic ITH, but significantly colder and more heterogeneous TCR repertoire associated with higher chromosomal copy number aberration (CNA) burden. Furthermore, copy number loss of IFN-γ pathway genes is frequently observed and positively correlates with CNA burden. Higher mutational burden, higher T cell infiltration and positive PD-L1 expression are associated with longer overall survival (OS), while higher CNA burden is associated with shorter OS in patients with LS-SCLC.


Conflict of interest statement

L.A.B. serves on advisory committees for AstraZeneca, AbbVie, GenMab, BergenBio, Pharma Mar SA, Sierra Oncology, Merck, Bristol Myers Squibb, Genentech, and Pfizer, and has research support from AbbVie, AstraZeneca, GenMab, Sierra Oncology, and Tolero Pharmaceuticals. I.W. reports grants and personal fees from Genentech/Roche, Bayer, Bristol-Myers Squibb, AstraZeneca/Medimmune, Pfizer, HTG Molecular, Merck, and Guardant Health; personal fees from GlaxoSmithKline and MSD; grants from Oncoplex, DepArray, Adaptive, Adaptimmune, EMD Serono, Takeda, Amgen, Karus, Johnson & Johnson, Iovance, 4D, Novartis, Oncocyte, and Akoya. J.Z. reports research funding from Merck, Johnson and Johnson, and consultant fees from BMS, Johnson and Johnson, AstraZeneca, Geneplus, OrigMed, and Innovent outside the submitted work. J.V.H. reports honorariums from AstraZeneca, Boehringer-Ingelheim, Catalyst, Genentech, GlaxoSmithKline, Guardant Health, Foundation medicine, Hengrui Therapeutics, Eli Lilly, Novartis, Spectrum, EMD Serono, Sanofi, Takeda, Mirati Therapeutics, BMS, BrightPath Biotherapeutics, Janssen Global Services, Nexus Health Systems, EMD Serono, Pneuma Respiratory, Kairos Venture Investments, Roche, and Leads Biolabs. A.R. serves on the Scientific Advisory Board and has received honoraria from Adaptive Biotechnologies. X.L. receives consulting/advisory fees from EMD Serono (Merck KGaA), AstraZeneca, Spectrum Pharmaceutics, Novartis, Eli Lilly, Boehringer Ingelheim, Janssen, Hengrui Therapeutics, and AbbVie, and research funding to the institute from Eli Lilly and Boehringer Ingelheim. R.K.T. is a founder of NEO New Oncology, acquired by Siemens Healthcare, a founder of PearlRiver Bio, acquired by Centessa, a founder of Epiphanes Inc. and a shareholder of Centessa and Epiphanes. R.K.T. has received honoraria from PearlRiver Bio. The other authors declare no competing interests.

Figures

Fig. 1
Fig. 1. Genomic intratumor heterogeneity (ITH) and clonal architecture of limited-stage small-cell lung cancers (LS-SCLCs).
a Phylogenetic trees of 18 limited-stage SCLC tumors (LS-SCLCs) with multi-region whole-exome sequencing (WES). Blue, brown and red lines represent trunk, branch, and private mutations, respectively. The length of trunk (blue), branch (brown), and private branch (red) is proportional to the numbers of mutations shared by 3, 2, or 1 tumor regions. The total number of mutations is listed above the phylogenetic tree of each tumor. TP53 and RB1 mutations are mapped to the phylogenetic trees as indicated. b Global clonal architecture of SCLC at tumor level. PyClone was run on merged bam files from different regions of the same tumors. Mutations were classified as clonal (present in the cluster with the highest cellular prevalence, blue) or subclonal (orange) in each tumor. The total number of mutations in each tumor is listed on the top of each bar. Note: the numbers of mutations in each tumor are less than those in phylogenetic analysis as the clonal status of some mutations could not be inferred by PyClone. Patient ID: purple = alive; green = deceased. Source data are provided as a Source Data file.
Fig. 2
Fig. 2. TCR metrics in small-cell lung cancer (SCLC) versus non-small cell lung-cancer (NSCLC) tumors (the PROSPECT cohort).
a T-cell density—an estimate of the proportion of T cells in a specimen, b T-cell richness—a measure of T-cell diversity and (c) T-cell clonality—a metric indicating T-cell expansion and reactivity, were derived from 19 SCLCs (red) versus 236 NSCLCs (blue) from the PROSPECT cohort. TCR intratumor heterogeneity (ITH) in 10 SCLC versus 11 NSCLC using (d) the average Jaccard index (JI), a metric representing the proportion of shared T-cell clonotypes, e Morisita index (MOI), a metric taking into consideration not only the composition of T-cell clonotypes but also the abundance of individual T-cell clonotypes and (f) proportion of shared top 20 TCR clonotypes between any paired samples within the same tumors in SCLC (blue) versus NSCLC tumors (red) with multiregional TCR data available. The difference of TCR metrics between SCLC and NSCLC was evaluated using two-sided Mann–Whitney test. Source data are provided as a Source Data file.
Fig. 3
Fig. 3. Comparison of immune features in small-cell lung cancer (SCLC) versus non-small cell lung cancer (NSCLC).
a Tumor purity in SCLCs versus NSCLCs. Tumor purity was derived from whole-exome sequencing (WES) data from 19 SCLC tumors (blue) versus 242 NSCLC tumors (red) from the PROSPECT cohort. b T-cell infiltration in SCLCs compared with NSCLCs. T-cell infiltration was derived by deconvolution of RNA sequencing (RNA-seq) data of 81 SCLC tumors (George cohort) versus 1027 NSCLC tumors from TCGA. c Immune score in SCLCs compared with NSCLCs. The immune score was calculated from RNA-seq data to quantify all immune cells within the tumors from 81 SCLC tumors (George cohort) versus 1027 NSCLC tumors from TCGA. d CD3 + tumor-infiltrating lymphocytes (TILs) of SCLC (n = 67) versus NSCLC (n = 68) tumors by immunohistochemistry (IHC). The y axis represents CD3 + TILs: tumor-cell ratio. e Association of tumor purity with CD3 + TILs in SCLCs (n = 19). The y axis represents CD3 + TILs: tumor-cell ratio. f Expression of programmed death ligand-1 (PD-L1) by IHC in SCLC (n = 67) versus NSCLC (n = 68) tumors. The difference of immune features between SCLC and NSCLC was evaluated using two-sided Mann–Whitney test. The correlation coefficient (r) of tumor purity with CD3 + TILs was assessed by two-tailed Spearman’s rank-correlation test. Source data are provided as a Source Data file.
Fig. 4
Fig. 4. Substantial T cell receptor (TCR) repertoire intratumor heterogeneity (ITH) in small-cell lung cancer (SCLC).
a Quantification of TCR ITH by Jaccard index (JI), a metric representing the proportion of shared T-cell clonotypes between two samples in 10 SCLC patients with multiregion TCR sequencing data. b Proportions of T-cell clonotypes detected in all regions (shared, blue), in 2/3 (brown) and restricted to a single region (red) from the same tumors in 10 SCLC patients with multiregion TCR sequencing data. Patient ID: purple = alive; green = deceased. Source data are provided as a Source Data file.
Fig. 5
Fig. 5. Associations of chromosomal copy number aberrations (CNAs) with T cell receptor (TCR) repertoire.
CNA burden and its negative correlations with T-cell (a) density, (b) richness, and (c) clonality in 36 small-cell lung cancer (SCLC) samples with both CNA and TCR data available. The correlation coefficient (r) was assessed by two-tailed Spearman’s rank-correlation test. Source data are provided as a Source Data file.
Fig. 6
Fig. 6. Copy number loss of interferon gamma (IFN-γ) pathway genes in small-cell lung cancer (SCLC) and comparison with non-small cell lung-cancer (NSCLC) tumors.
a Copy number loss of IFN-γ pathway genes in 50 SCLC samples from 19 SCLC patients. Purple patient IDs = alive; Green patient IDs = deceased. b Copy-number loss burden of IFN-γ pathway genes in 50 SCLC samples (blue) versus 327 NSCLC samples (red) from TRACERx. c Correlation of copy number alteration (CNA) burden of IFN-γ pathway genes with overall CNA burden in SCLC (n = 50). The difference of copy number loss burden of IFN-γ pathway genes between SCLC and NSCLC was evaluated using two-sided Mann–Whitney test. The correlation coefficient (r) of CNA burden of IFN-γ pathway genes with overall CNA burden was assessed by two-tailed Spearman’s rank-correlation test. Source data are provided as a Source Data file.
Fig. 7
Fig. 7. Association of overall survival (OS) with immunogenomic landscape.
a OS of patients with higher (above median, blue) tumor mutational burden (TMB) versus patients with lower (below median, red) TMB. b OS of patients with higher (above median, blue) copy number aberration (CNA) burden versus patients with lower (below median, red) CNA burden. c OS of patients with more homogeneous T-cell receptor (TCR) repertoire (higher above-median TCR Jaccard index (JI), blue) versus patients with more heterogeneous TCR repertoire (lower below-median TCR JI, red). d OS of patients with tumors of higher (above median, blue) tumor purity versus patients with tumors of lower (below median, red) tumor purity. e OS of patients with tumors of higher (no less than median, blue) CD3 + tumor-infiltrating lymphocytes (TILs) versus patients with tumors of lower (below median, red) CD3 + TILs. f OS of patients with tumors of positive (above 0, blue) programmed death ligand-1 (PD-L1) expression versus patients with tumors of negative (equal to 0, red) PD-L1 expression. Two-sided log-rank test was used for survival analysis. Source data are provided as a Source Data file.

References

    1. Howlader, N. et al. SEER Cancer Statistics Review, 1975–2016 (National Cancer Institute, 2019).
    1. Alvarado-Luna G, Morales-Espinosa D. Treatment for small cell lung cancer, where are we now?—a review. Transl. Lung Cancer Res. 2016;5:26–38. - PMC - PubMed
    1. Govindan R, et al. Changing epidemiology of small-cell lung cancer in the United States over the last 30 years: analysis of the surveillance, epidemiologic, and end results database. J. Clin. Oncol. 2006;24:4539–4544. - PubMed
    1. Kalemkerian GP, et al. Small cell lung cancer. J. Natl Compr. Canc Netw. 2013;11:78–98. - PMC - PubMed
    1. Micke P, et al. Staging small cell lung cancer: Veterans Administration Lung Study Group versus International Association for the Study of Lung Cancer—what limits limited disease? Lung Cancer. 2002;37:271–276. - PubMed

Publication types

MeSH terms