TRAIL/DR5 pathway promotes AKT phosphorylation, skeletal muscle differentiation, and glucose uptake
- PMID: 34789726
- PMCID: PMC8599458
- DOI: 10.1038/s41419-021-04383-3
TRAIL/DR5 pathway promotes AKT phosphorylation, skeletal muscle differentiation, and glucose uptake
Abstract
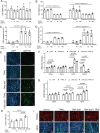
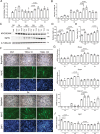
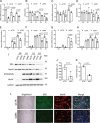
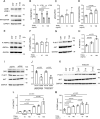
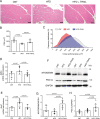
TNF-related apoptosis-inducing ligand (TRAIL) is a protein that induces apoptosis in cancer cells but not in normal ones, where its effects remain to be fully understood. Previous studies have shown that in high-fat diet (HFD)-fed mice, TRAIL treatment reduced body weight gain, insulin resistance, and inflammation. TRAIL was also able to increase skeletal muscle free fatty acid oxidation. The aim of the present work was to evaluate TRAIL actions on skeletal muscle. Our in vitro data on C2C12 cells showed that TRAIL treatment significantly increased myogenin and MyHC and other hallmarks of myogenic differentiation, which were reduced by Dr5 (TRAIL receptor) silencing. In addition, TRAIL treatment significantly increased AKT phosphorylation, which was reduced by Dr5 silencing, as well as glucose uptake (alone and in combination with insulin). Our in vivo data showed that TRAIL increased myofiber size in HFD-fed mice as well as in db/db mice. This was associated with increased myogenin and PCG1α expression. In conclusion, TRAIL/DR5 pathway promotes AKT phosphorylation, skeletal muscle differentiation, and glucose uptake. These data shed light onto a pathway that might hold therapeutic potential not only for the metabolic disturbances but also for the muscle mass loss that are associated with diabetes.
© 2021. The Author(s).
Conflict of interest statement
The authors declare no competing interests.
Figures
Similar articles
-
TRAIL (TNF-related apoptosis-inducing ligand) regulates adipocyte metabolism by caspase-mediated cleavage of PPARgamma.Cell Death Dis. 2013 Jan 24;4(1):e474. doi: 10.1038/cddis.2012.212. Cell Death Dis. 2013. PMID: 23348588 Free PMC article.
-
Pro-survival effects by NF-κB, Akt and ERK(1/2) and anti-apoptosis actions by Six1 disrupt apoptotic functions of TRAIL-Dr4/5 pathway in ovarian cancer.Biomed Pharmacother. 2016 Dec;84:1078-1087. doi: 10.1016/j.biopha.2016.10.028. Epub 2016 Oct 22. Biomed Pharmacother. 2016. PMID: 27780136
-
Resistance to TRAIL-induced apoptosis caused by constitutional phosphorylation of Akt and PTEN in acute lymphoblastic leukemia cells.Exp Hematol. 2008 Oct;36(10):1343-53. doi: 10.1016/j.exphem.2008.04.011. Epub 2008 Jul 2. Exp Hematol. 2008. PMID: 18599181
-
TRAIL treatment prevents renal morphological changes and TGF-β-induced mesenchymal transition associated with diabetic nephropathy.Clin Sci (Lond). 2020 Sep 18;134(17):2337-2352. doi: 10.1042/CS20201004. Clin Sci (Lond). 2020. PMID: 32857135
-
Rac1 muscle knockout exacerbates the detrimental effect of high-fat diet on insulin-stimulated muscle glucose uptake independently of Akt.J Physiol. 2018 Jun;596(12):2283-2299. doi: 10.1113/JP275602. Epub 2018 May 10. J Physiol. 2018. PMID: 29749029 Free PMC article.
Cited by
-
TNF-Related Apoptosis-Inducing Ligand: Non-Apoptotic Signalling.Cells. 2024 Mar 16;13(6):521. doi: 10.3390/cells13060521. Cells. 2024. PMID: 38534365 Free PMC article. Review.
-
The Dual Role of TRADD in Liver Disease: From Cell Death Regulation to Inflammatory Microenvironment Remodeling.Int J Mol Sci. 2025 Jun 19;26(12):5860. doi: 10.3390/ijms26125860. Int J Mol Sci. 2025. PMID: 40565323 Free PMC article. Review.
-
Repositioning the Role of Tumor Necrosis Factor-Related Apoptosis-Inducing Ligand (TRAIL) on the TRAIL to the Development of Diabetes Mellitus: An Update of Experimental and Clinical Evidence.Int J Mol Sci. 2022 Mar 17;23(6):3225. doi: 10.3390/ijms23063225. Int J Mol Sci. 2022. PMID: 35328646 Free PMC article. Review.
-
Advances in the study of death receptor 5.Front Pharmacol. 2025 Mar 12;16:1549808. doi: 10.3389/fphar.2025.1549808. eCollection 2025. Front Pharmacol. 2025. PMID: 40144653 Free PMC article. Review.
-
Novel Proteome Targets Marking Insulin Resistance in Metabolic Syndrome.Nutrients. 2024 Jun 10;16(12):1822. doi: 10.3390/nu16121822. Nutrients. 2024. PMID: 38931177 Free PMC article.
References
-
- Wiley SR, Schooley K, Smolak PJ, Din WS, Huang CP, Nicholl JK, et al. Identification and characterization of a new member of the TNF family that induces apoptosis. Immunity. 1995;3:673–82. - PubMed
-
- Pitti RM, Marsters SA, Ruppert S, Donahue CJ, Moore A, Ashkenazi A. Induction of apoptosis by Apo-2 ligand, a new member of the tumor necrosis factor cytokine family. J Biol Chem. 1996;271:12687–90. - PubMed
-
- Armitage RJ. Tumor necrosis factor receptor superfamily members and their ligands. Curr Opin Immunol. 1994;6:407–13. - PubMed
-
- Harith HH, Morris MJ, Kavurma MM. On the TRAIL of obesity and diabetes. Trends Endocrinol Metab. 2013;24:578–87. - PubMed
Publication types
MeSH terms
Substances
LinkOut - more resources
Full Text Sources
Miscellaneous

