. 2021 Nov 17;11(1):22430.
doi: 10.1038/s41598-021-01138-0.

Detection of cancer stem cells by EMT-specific biomarker-based peptide ligands

Affiliations

Detection of cancer stem cells by EMT-specific biomarker-based peptide ligands

Yi-An Chen et al. Sci Rep. .

Abstract

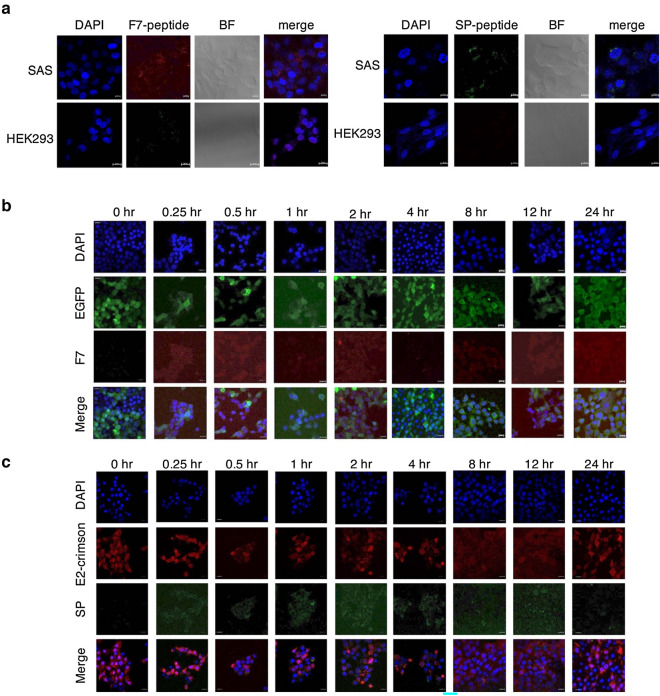
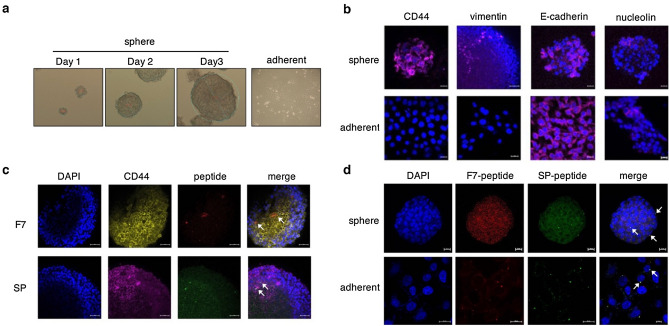
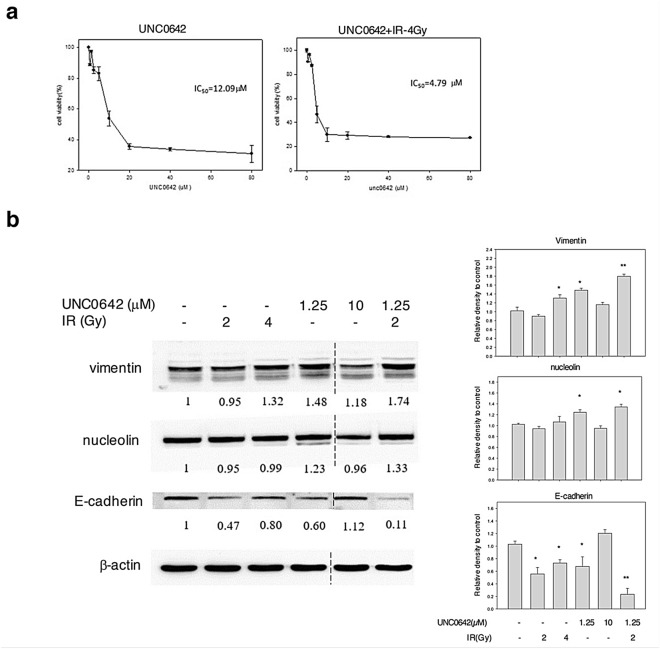
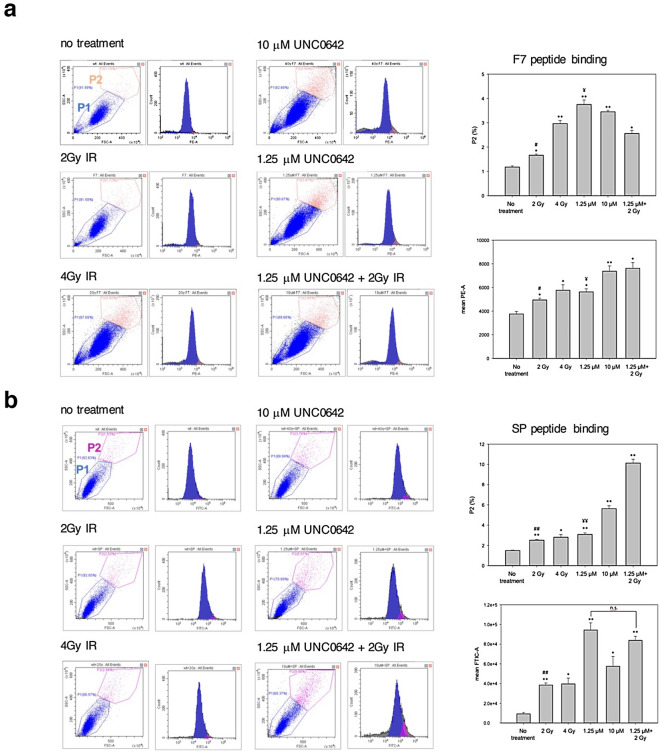
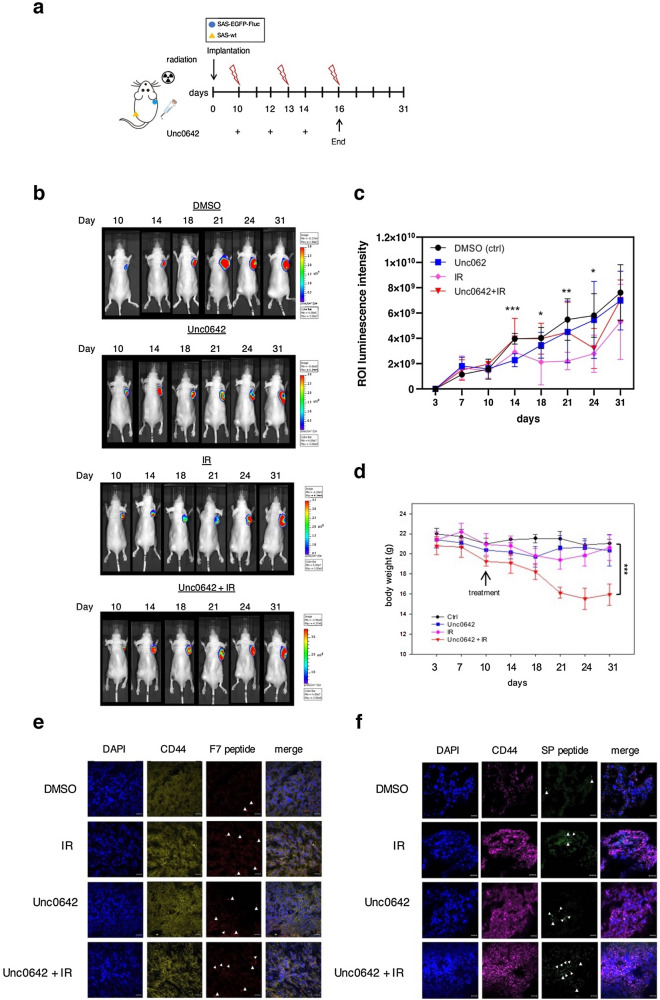
The occurrence of epithelial-mesenchymal transition (EMT) within tumors, which enables invasion and metastasis, is linked to cancer stem cells (CSCs) with drug and radiation resistance. We used two specific peptides, F7 and SP peptides, to detect EMT derived cells or CSCs. Human tongue squamous carcinoma cell line-SAS transfected with reporter genes was generated and followed by spheroid culture. A small molecule inhibitor-Unc0642 and low-dose ionizing radiation (IR) were used for induction of EMT. Confocal microscopic imaging and fluorescence-activated cell sorting analysis were performed to evaluate the binding ability and specificity of peptides. A SAS xenograft mouse model with EMT induction was established for assessing the binding affinity of peptides. The results showed that F7 and SP peptides not only specifically penetrated into cytoplasm of SAS cells but also bound to EMT derived cells and CSCs with high nucleolin and vimentin expression. In addition, the expression of CSC marker and the binding of peptides were increased in tumors isolated from Unc0642/IR-treated groups. Our study demonstrates the potential of these peptides for detecting EMT derived cells or CSCs and might provide an alternative isolation method for these subpopulations within the tumor in the future.


Conflict of interest statement

The authors declare no competing interests.

Figures

Figure 1
Figure 1
Evaluation of peptide binding activity to SAS cells. (a) IF analysis of F7 peptide and SP peptide binding to SAS cells. HEK293 cell that does not express vimentin and nucleolin served as a negative control. Red: Lissamine Rhodamine labeled F7 peptide, Green: FITC labeled SP peptide, Blue: DAPI; BF, bright field; Scale bar, 10 μm. (b) The kinetics of F7 peptide binding to SAS-EGFP-Fluc cells. Cells were incubated in the presence of 50 ng/μl peptides at 37 °C for the indicated periods of time. (c) The kinetics of SP peptide binding to SAS-E2-crimson-P2A::ttksr39 cells at indicated time points.
Figure 2
Figure 2
Expression of CSC markers corresponding to peptide binding. (a) Phase-contrast photomicrographs of the spheres cultured from SAS-E2-crimson-P2A::ttksr39 cell line using the ultra-low attachment plate. Right panel: adherent cells. magnification, 100×. (b) ICC results showing the expression of representative CSC marker, CD44 and EMT markers, vimentin and nucleolin in spheres (upper panel) and adherent cells (lower panel). E-cadherin is an epithelial cell marker. (c) The peptide binding to tumor spheres which highly expressed CD44. The arrow indicates the presence of F7 and SP peptide. Red: Lissamine Rhodamine labeled F7 peptide, Green: FITC labeled SP peptide, Blue: DAPI; Scale bar, 20 μm. (d) Comparison of peptides binding to spheres and adherent cells. Yellow: colocalization.
Figure 3
Figure 3
In vitro induction of EMT and stemness with Unc0642/IR. (a) SAS cells were treated with indicated concentration of Unc0642 and Unc0642 + 2 Gy of radiation for 72 h respectively. Cell viability was assessed by AlamarBlue assay. All data were normalized to cells without treatment. Data are presented as mean ± SD. IC50 was calculated using SigmaPlot12 software. (b) Western blot analysis of CSC and EMT markers in SAS cells treated with different concentration of Unc 0642 (1.25 and 10 µM) and different dose of radiation (2 and 4 Gy) respectively. Internal control: b-actin. Right graph: the quantification of protein expression levels normalized against b-actin levels in each sample. *p < 0.05; **p < 0.01 by Student’s t-test. The blots were cropped from different parts of the same gel. The original blots and all replicates are presented in Supplementary Fig. 4.
Figure 4
Figure 4
Evaluation of peptide binding activity to EMT derived cells induced by Unc0642/IR. After treatment of Unc0642 or radiation, EMT derived cells were incubated for 24 h in the presence of 50 ng/μl of fluorescein-labeled F7 (a) and SP peptide (b) at 37 °C respectively. FACS analysis was performed on gated live cells and light scatter parameters were measured using the 488 nm laser. The dot plot represented the particle size (FSC) versus granularity (SSC) of the cell population. The histogram represented the number of cells from P1 and P2 regions displaying a given fluorescence signal. Right graph: the quantitative analysis in the ratio of fluorescein-labeled peptides binding to SAS cells. Symbols (*) denotes significantly different from no treatment group, (#) and (¥) denote significantly different from 1.25 μM + 2 Gy group, respectively. *, #, ¥p < 0.05, **, ##, ¥¥p < 0.01, n.s., nonsignificant by Student’s t-test.
Figure 5
Figure 5
Evaluation of peptide binding ability in SAS xenograft mouse model after the treatment of Unc0642/IR. (a) Schematic diagram for in vivo EMT induction via the treatment of Unc0642 and radiation. (b) Evaluation of the effect of Unc0642/IR in SAS-EGFP-Fluc-bearing mice by optical bioluminescence image. (c) Tumor burden of each group was monitored at indicated time points. Data represent mean ± SD (n = 5–6/group). *p < 0.05, **p < 0.01, ***p < 0.001 by Student’s t-test. ***p = 0.00058, Ctrl versus Unc0642 on day 14; *p = 0.049, Ctrl versus IR on day 18; **p = 0.0023, Ctrl versus IR on day 21; *p = 0.0179, Ctrl versus IR on day 24; *p = 0.036, Ctrl versus Unc0642 + IR on day 24. (d) The body weights of mice were recorded during the period of monitoring. Data are mean ± SD (n = 5–6/group). (e, f) Mice were given an intra-tumoral injection of peptide. At 24 h later, tumor samples were excised and the signal derived from the peptide was observed using confocal microscopy. Representative confocal micrographs of tissue sections immunolabeled with CD44. The arrowheads indicate the presence of F7 and SP peptide. Blue: DAPI. Scale bar, 20 μm.

Similar articles

Cited by

References

    1. Gupta PB, et al. Identification of selective inhibitors of cancer stem cells by high-throughput screening. Cell. 2009;138:645–659. doi: 10.1016/j.cell.2009.06.034. - DOI - PMC - PubMed
    1. Keitel U, Scheel C, Dobbelstein M. Overcoming EMT-driven therapeutic resistance by BH3 mimetics. Oncoscience. 2014;1:706–708. doi: 10.18632/oncoscience.93. - DOI - PMC - PubMed
    1. Shibue T, Weinberg RA. EMT, CSCs, and drug resistance: The mechanistic link and clinical implications. Nat. Rev. Clin. Oncol. 2017;14:611–629. doi: 10.1038/nrclinonc.2017.44. - DOI - PMC - PubMed
    1. Masui T, et al. Snail-induced epithelial-mesenchymal transition promotes cancer stem cell-like phenotype in head and neck cancer cells. Int. J. Oncol. 2014;44:693–699. doi: 10.3892/ijo.2013.2225. - DOI - PubMed
    1. Krisanaprakornkit S, Iamaroon A. Epithelial-mesenchymal transition in oral squamous cell carcinoma. ISRN Oncol. 2012;2012:681469. doi: 10.5402/2012/681469. - DOI - PMC - PubMed

Publication types

MeSH terms