

Field metabolic rates of giant pandas reveal energetic adaptations
- PMID: 34789821
- PMCID: PMC8599739
- DOI: 10.1038/s41598-021-01872-5
Field metabolic rates of giant pandas reveal energetic adaptations
Abstract
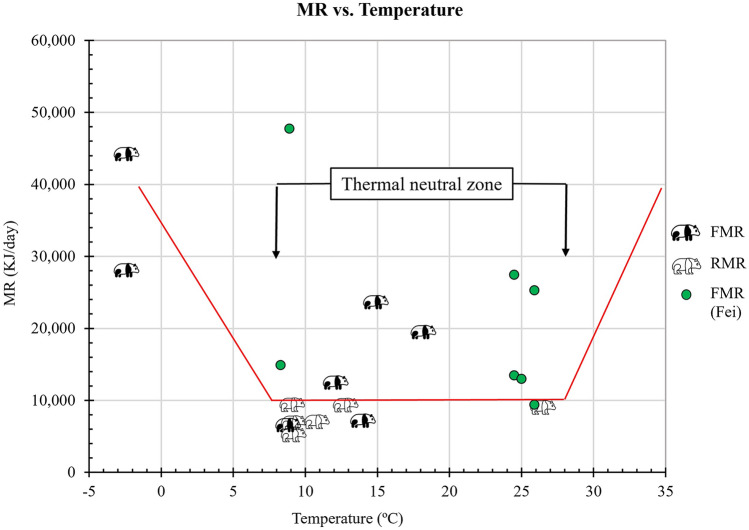
Knowledge of energy expenditure informs conservation managers for long term plans for endangered species health and habitat suitability. We measured field metabolic rate (FMR) of free-roaming giant pandas in large enclosures in a nature reserve using the doubly labeled water method. Giant pandas in zoo like enclosures had a similar FMR (14,182 kJ/day) to giant pandas in larger field enclosures (13,280 kJ/day). In winter, giant pandas raised their metabolic rates when living at - 2.4 °C (36,108 kJ/day) indicating that they were below their thermal neutral zone. The lower critical temperature for thermoregulation was about 8.0 °C and the upper critical temperature was about 28 °C. Giant panda FMRs were somewhat lower than active metabolic rates of sloth bears, lower than FMRs of grizzly bears and polar bears and 69 and 81% of predicted values based on a regression of FMR versus body mass of mammals. That is probably due to their lower levels of activity since other bears actively forage for food over a larger home range and pandas often sit in a patch of bamboo and eat bamboo for hours at a time. The low metabolic rates of giant pandas in summer, their inability to acquire fat stores to hibernate in winter, and their ability to raise their metabolic rate to thermoregulate in winter are energetic adaptations related to eating a diet composed almost exclusively of bamboo. Differences in FMR of giant pandas between our study and previous studies (one similar and one lower) appear to be due to differences in activity of the giant pandas in those studies.
© 2021. The Author(s).
Conflict of interest statement
The authors declare no competing interests.
Figures


References
-
- Li BV, Pimm SL. China’s endemic vertebrates sheltering under the protective umbrella of the giant panda. Conserv. Biol. 2016;30:329–339. - PubMed
-
- Porter WP, Gates DM. Thermodynamic equilibria of animals with environment. Ecol. Monogr. 1969;39:227–244.
-
- Dunham AE, Grant BW, Overall KL. Interfaces between biophysical and physiological ecology and the population ecology of terrestrial vertebrate ectotherms. Physiol. Zool. 1989;62:335–355.
-
- Nowak RM. Walker’s Mammals of the World. Johns Hopkins University Press; 1991.
-
- Nelson RA, Wahner HW, Jones JD, Ellefson RD, Zollman PE. Metabolism of bears before, during, and after winter sleep. Am. J. Physiol. 1973;224:491–496. - PubMed
Publication types
MeSH terms
LinkOut - more resources
Full Text Sources
