. 2021 Nov 17;4(1):1298.
doi: 10.1038/s42003-021-02818-3.

Transcriptional changes and the role of ONECUT1 in hPSC pancreatic differentiation

Affiliations

Transcriptional changes and the role of ONECUT1 in hPSC pancreatic differentiation

Sandra Heller et al. Commun Biol. .

Abstract

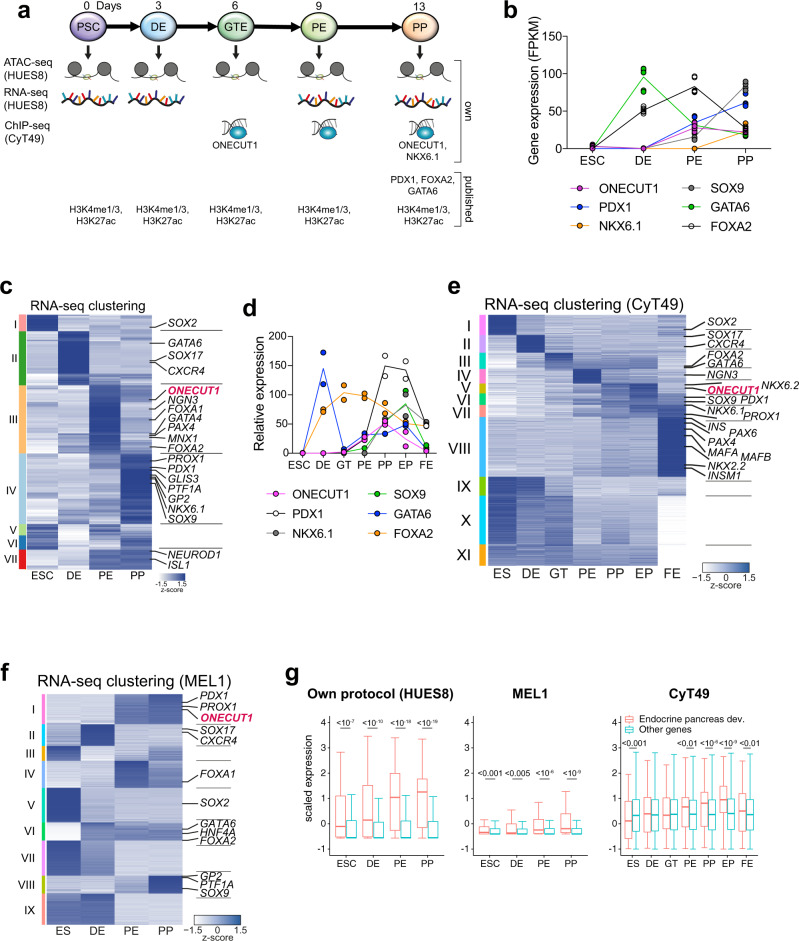
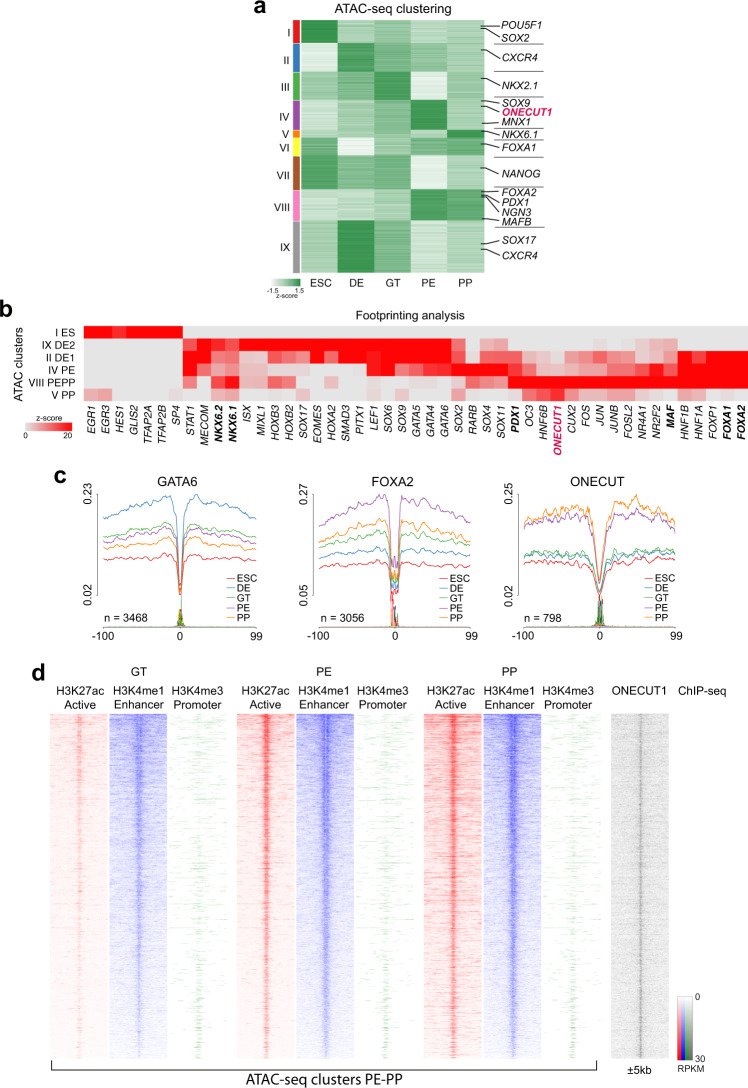
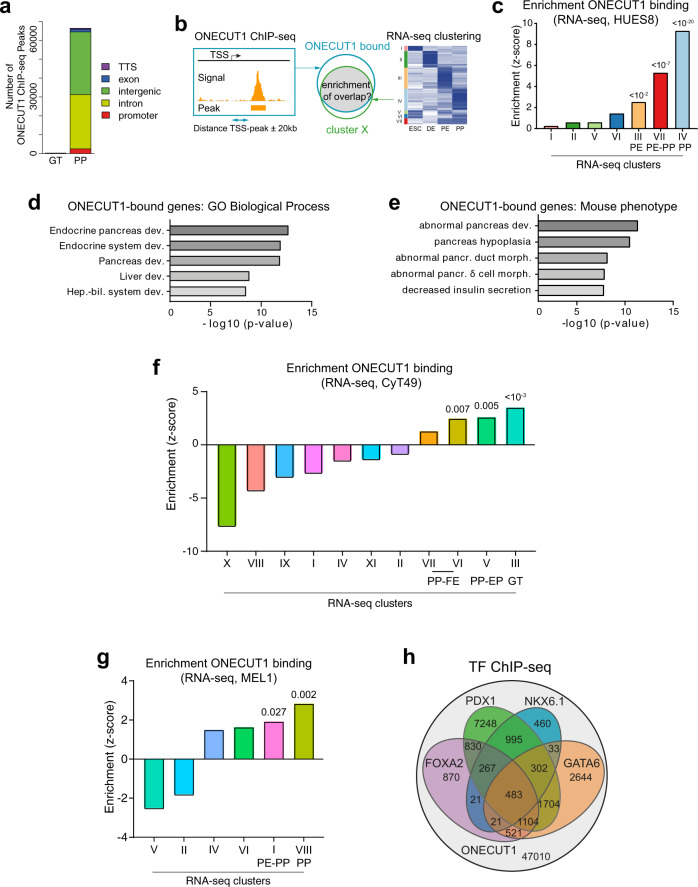
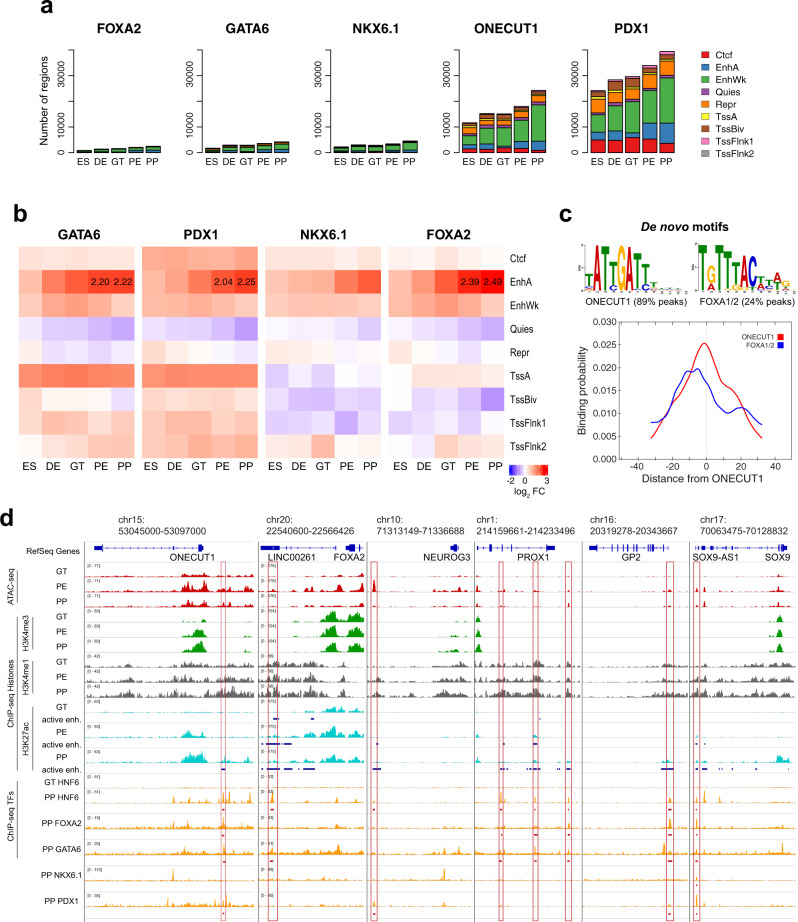
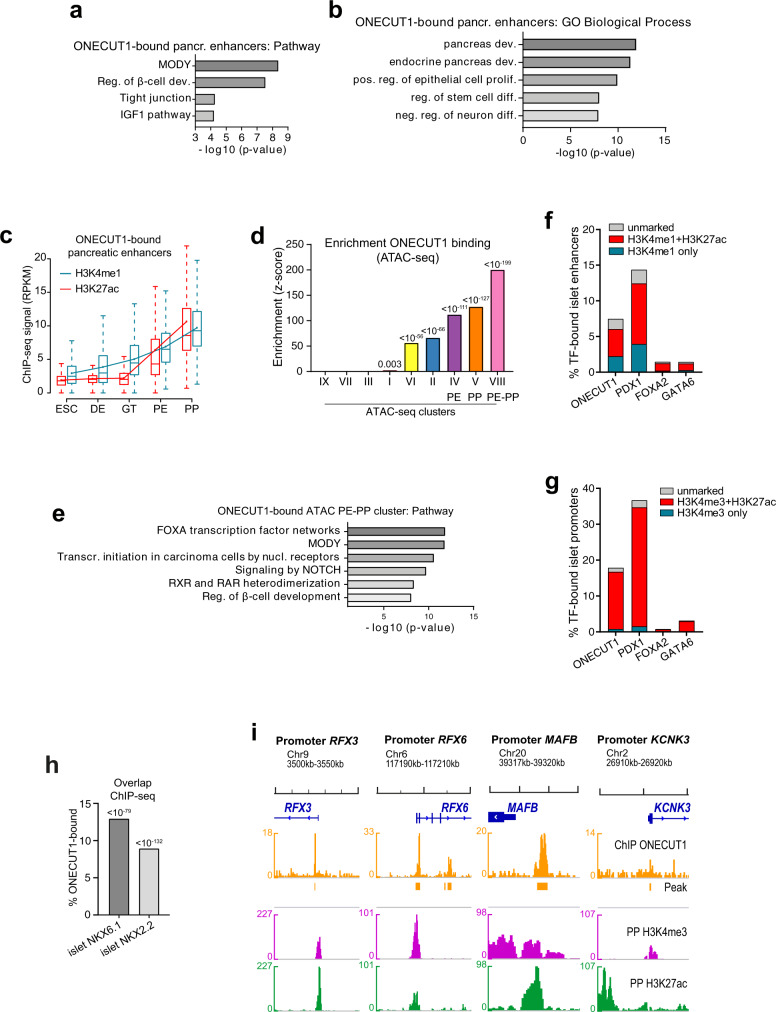
Cell type specification during pancreatic development is tightly controlled by a transcriptional and epigenetic network. The precise role of most transcription factors, however, has been only described in mice. To convey such concepts to human pancreatic development, alternative model systems such as pancreatic in vitro differentiation of human pluripotent stem cells can be employed. Here, we analyzed stage-specific RNA-, ChIP-, and ATAC-sequencing data to dissect transcriptional and regulatory mechanisms during pancreatic development. Transcriptome and open chromatin maps of pancreatic differentiation from human pluripotent stem cells provide a stage-specific pattern of known pancreatic transcription factors and indicate ONECUT1 as a crucial fate regulator in pancreas progenitors. Moreover, our data suggest that ONECUT1 is also involved in preparing pancreatic progenitors for later endocrine specification. The dissection of the transcriptional and regulatory circuitry revealed an important role for ONECUT1 within such network and will serve as resource to study human development and disease.


Conflict of interest statement

The authors declare no competing interests.

Figures

Fig. 1
Fig. 1. Stage-specific transcriptome analysis reveals ONECUT1 expression during stem cell-based pancreatic differentiation.
a Schematic outline of applied pancreatic differentiation strategy of human pluripotent stem cells and subsequent stage-specific large-scale sequencing analysis. RNA-seq data (own and E-MTAB-1086), ATAC-seq data (own), ChIP-seq data of ONECUT1 (own), FOXA1, FOXA2, PDX1 (GSE54471, GSE149148) and NKX6.1 (own), and histone data (H3K4me1, H3K27ac, GSE54471; H3K4me3, ArrayExpress E-MTAB-1086) were used for analysis. b Stage-specific expression analysis of depicted genes during pancreas differentiation of HUES8 cells (RNA-seq, n = 6 biologically independent samples). c Fuzzy c-means (FCM) clustering of the differentially expressed genes (RNA-seq) at the varying differentiation stages of hESCs (HUES8) displaying selected genes at respective clusters. d Stage-specific expression analysis of depicted genes during pancreas differentiation of CyT49 cells (RNA-seq, n = 2 biologically independent samples). e Heatmap of fuzzy c-means clustering of differentially expressed genes (RNA-seq) at distinct pancreatic differentiation stages of CyT49 cells. Selected genes of particular clusters are highlighted. f Heatmap of fuzzy c-means clustering of differentially expressed genes (RNA-seq, n = 4) at the distinct pancreas differentiation stages of MEL1. Selected genes of particular clusters are displayed. Of note, cells at PP stage were purified for PDX1 and NKX6.1. g Expression of genes associated with endocrine pancreas differentiation obtained from Gene Ontology (ID GO:0031018) for all protocols. Boxplots depict median (center), interquartile range (box) and extreme values (whiskers). A statistical test (Wilcoxon Rank Sum test; one sided) was used to compare the expression of endocrine genes vs. all other genes.
Fig. 2
Fig. 2. ONECUT1 binding and chromatin opening is relevant for pancreas development.
a Fuzzy c-means clustering of the differential open chromatin peaks (ATAC-seq) during pancreatic differentiation of HUES8 cells. b TF binding motif enrichment at distinct open chromatin clusters of ATAC-seq. c Average chromatin accessibility profiles around footprint-supported bindings sites of selected TFs. d Heatmap ChIP-seq signals (+/− 5 kb of peak center) of H3K4me1, H3K4me3, and H3K27ac at ATAC-seq peaks from cluster PE-PP (VIII; clustering is shown in Fig. 2a). Peaks are ordered by the decrease in the H3K4me1 mark at PE stage. We also depict ONECUT1 ChIP-seq signals (PP stage) in the vicinity of the peak (+/− 5 kb).
Fig. 3
Fig. 3. ONECUT1 binds to regulatory gene clusters relevant for pancreas and endocrine development.
a Distribution of ONECUT1 ChIP-seq peaks at GT and PP stages relative to genomic regions. b Schematic of the binding enrichment analysis evaluating whether ONECUT1-bound genes (binding observed 20 kb upstream or downstream of the respective promoter regions) are enriched in particular RNA-seq clusters. c Binding enrichment (z-score) test of ONECUT1 (ChIP-seq, PP stage) in genes of the RNA-seq clusters of HUES8 cells (z-test; one-sided). d, e Enrichment analysis (GREAT) of ONECUT1-bound genes (ChIP-seq, PP stage) (Fischer Exact test; one-sided). f Binding enrichment (z-score) test of ONECUT1 (ChIP-seq, PP stage) in genes of the RNA-seq clusters of CyT49 cells (z-test; one-sided). Significance is indicated above bars (Fischer Exact test; one-sided). g Binding enrichment test of ONECUT1 (ChIP-seq, PP) for MEL1 RNA-seq specific gene clusters. Data show binding score (z-score) with p-value (z-test; one-sided). h Overlap of ONECUT1 ChIP-seq peaks (PP stage, own data set) with peaks from other TFs (previously published at GSE54471, GSE149148, or NKX6.1; own data set). For the other TFs, only the number of binding peaks overlapping with ONECUT1 is shown.
Fig. 4
Fig. 4. ONECUT1 cobinding during early pancreas differentiation regulation.
a Overlap of peaks of distinct TFs on chromatin states as delineated by chromHMM. These states include active enhancers (EnhA), weak/poised enhancers (EnhWk.), repressed regions (Repr.), active promoters (TssA), poised promoters (TssBiv) and regions flanking active promoters (TssFlnk1-2). b Log2 fold change (FC) of the frequency of ONECUT1 co-binding events (ONECUT1 with either GATA6, PDX1, NKX6.1, and FOXA2) vs. ONECUT1 exclusive binding sites for distinct chromatin states and differentiation stages. Red values indicate chromatin stages over-represented in co-binding events. We highlight values with abs(log2(FC)) > 2. c We show MEME de novo motifs around ONECUT1 ChIP-seq peaks, which are found in 89% of peaks, and FOXA2 motif, which is found in 24% of peaks. Both motifs have a preference relative to the peak center, i.e., ONECUT1 is mostly localized in the peak middle, while FOXA2 is located 9–10 bps downstream of peak center. d IGV Genome browser view of ONECUT1 and PE/PP expressed genes with ChIP-seq and ATAC-seq profiles from GT, PE, and PP stages. We highlight ONECUT1 peaks overlapping with active enhancers (blue tracks below H3K27ac tracks) gained at PE or PP stage, as well as co-binding partners.
Fig. 5
Fig. 5. Pancreatic and islet enhancers are bound by ONECUT1.
a, b Enrichment analysis (GREAT) of ONECUT1-bound pancreatic enhancers (FG/PE and PE clusters from ref. ) for “pathway terms” (a) from the MSigDB pathway genes subset CP and for “GO Biological Process” (b) from the Gene Ontology Consortium (Binomial test; one side). c Distribution of stage-specific H3K4me1 and H3K27ac ChIP-seq signal at ONECUT1-bound pancreatic enhancers (FG/PE and PE clusters from ref. ). Boxplots depict median (center), interquartile range (box) and extreme values (whiskers), point and connecting line mean value. d Binding enrichment (z-score) test of ONECUT1 (ChIP-seq, PP stage) in distinct OC clusters of HUES8 ATAC-seq (z-test; one side). e Enrichment analysis (GREAT) of ONECUT1-bound genes overlapping with PE/PP ATAC-seq (cluster VIII) for “pathway terms” (Binomial test; one side). f, g Overlap between ChIP-seq peaks of ONECUT1 (PP stage) and depicted TFs with islet enhancers (f) and islet promoters (g) together with distinct histone modification as defined by ref. . h Overlap between ONECUT1 ChIP-seq peaks (PP stage) with islet TF peaks (NKX6.1 and NKX2.2 ChIP-seq from human islets; intersection test, one side). i Interactive Genome Viewer (IGV) plots illustrates ONECUT1 binding peaks and histone marks in promoter regions for selected endocrine genes. Genomic locations refer to human genome assembly GRCh37 (Hg19).

Similar articles

Cited by

References

    1. Merger SR, Leslie RD, Boehm BO. The broad clinical phenotype of Type 1 diabetes at presentation. Diabet. Med. 2013;30:170–178. - PubMed
    1. Müller JA, et al. SARS-CoV-2 infects and replicates in cells of the human endocrine and exocrine pancreas. Nat. Metab. 2021;3:149–165. - PubMed
    1. Schwitzgebel VM. Many faces of monogenic diabetes. J. Diabetes Investig. 2014;5:121–133. - PMC - PubMed
    1. Shepherd M, et al. Systematic population screening, using biomarkers and genetic testing, identifies 2.5% of the U.K. pediatric diabetes population with monogenic diabetes. Diabetes Care. 2016;39:1879–1888. - PMC - PubMed
    1. Russ HA, et al. Controlled induction of human pancreatic progenitors produces functional beta-like cells in vitro. EMBO J. 2015;34:1759–1772. - PMC - PubMed

Publication types

Substances