. 2022 Mar;27(3):1416-1434.
doi: 10.1038/s41380-021-01316-6. Epub 2021 Nov 17.

Schizophrenia is defined by cell-specific neuropathology and multiple neurodevelopmental mechanisms in patient-derived cerebral organoids

Affiliations

Schizophrenia is defined by cell-specific neuropathology and multiple neurodevelopmental mechanisms in patient-derived cerebral organoids

Michael Notaras et al. Mol Psychiatry. 2022 Mar.

Abstract

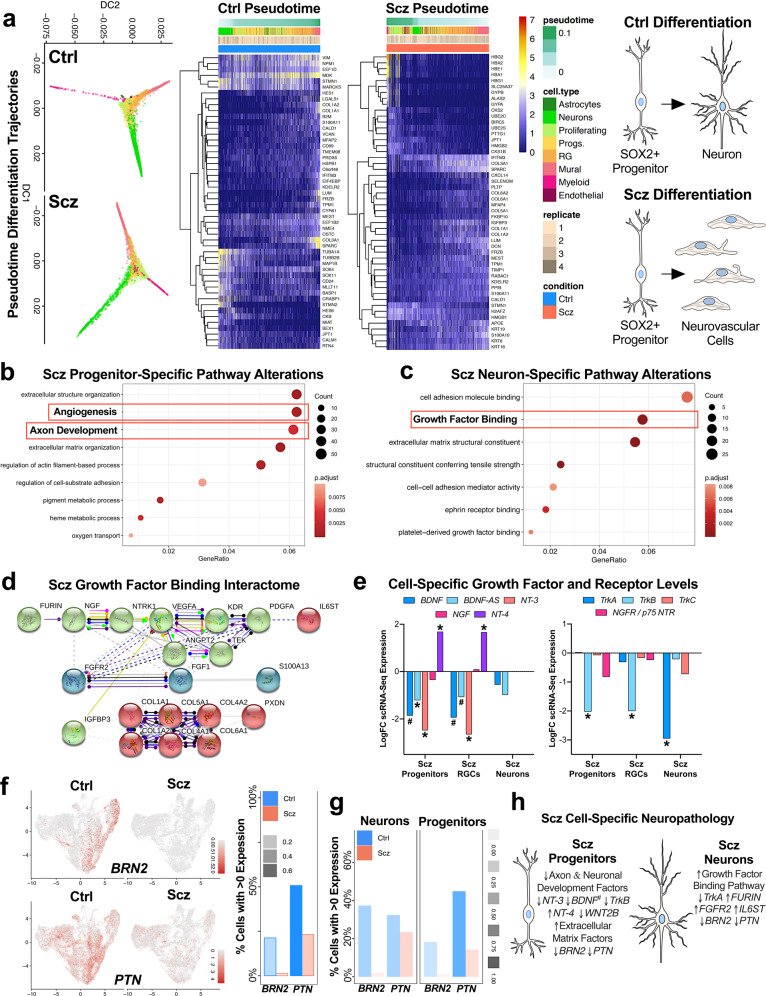
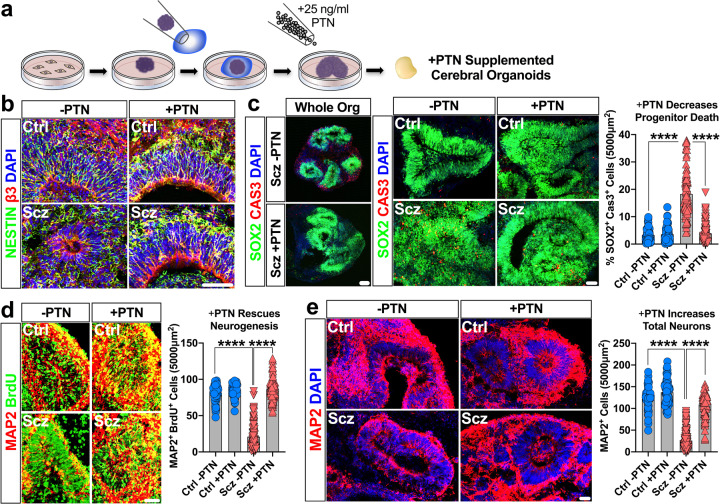
Due to an inability to ethically access developing human brain tissue as well as identify prospective cases, early-arising neurodevelopmental and cell-specific signatures of Schizophrenia (Scz) have remained unknown and thus undefined. To overcome these challenges, we utilized patient-derived induced pluripotent stem cells (iPSCs) to generate 3D cerebral organoids to model neuropathology of Scz during this critical period. We discovered that Scz organoids exhibited ventricular neuropathology resulting in altered progenitor survival and disrupted neurogenesis. This ultimately yielded fewer neurons within developing cortical fields of Scz organoids. Single-cell sequencing revealed that Scz progenitors were specifically depleted of neuronal programming factors leading to a remodeling of cell-lineages, altered differentiation trajectories, and distorted cortical cell-type diversity. While Scz organoids were similar in their macromolecular diversity to organoids generated from healthy controls (Ctrls), four GWAS factors (PTN, COMT, PLCL1, and PODXL) and peptide fragments belonging to the POU-domain transcription factor family (e.g., POU3F2/BRN2) were altered. This revealed that Scz organoids principally differed not in their proteomic diversity, but specifically in their total quantity of disease and neurodevelopmental factors at the molecular level. Single-cell sequencing subsequently identified cell-type specific alterations in neuronal programming factors as well as a developmental switch in neurotrophic growth factor expression, indicating that Scz neuropathology can be encoded on a cell-type-by-cell-type basis. Furthermore, single-cell sequencing also specifically replicated the depletion of BRN2 (POU3F2) and PTN in both Scz progenitors and neurons. Subsequently, in two mechanistic rescue experiments we identified that the transcription factor BRN2 and growth factor PTN operate as mechanistic substrates of neurogenesis and cellular survival, respectively, in Scz organoids. Collectively, our work suggests that multiple mechanisms of Scz exist in patient-derived organoids, and that these disparate mechanisms converge upon primordial brain developmental pathways such as neuronal differentiation, survival, and growth factor support, which may amalgamate to elevate intrinsic risk of Scz.


Conflict of interest statement

The authors declare no competing interests.

Figures

Fig. 1
Fig. 1. Ventricular progenitors are disrupted in Scz patient-derived organoids.
a Schematic of 3D cerebral organoid generation pipeline. Briefly, two-dimensional iPSC colonies were dissociated, cultured into 3D embryoid body aggregates, differentiated towards a neuroectodermal fate, embedded in a Matrigel droplet to provide a matrix for expansion, and maturated upon an orbital shaker. b Representative images of neural induction in 3D cerebral organoids. Shown is a representative image of a single ventricular zone from each group, exhibiting filamentous processes of neural stem cells (NESTIN+ cells), ventricular neural progenitors (SOX2+ cells), and their radially organized fibers which lead to dense neuronal fields (β-tubulin III; β3). c Scz ventricular zone neural progenitors exhibit increased apoptosis. Analysis of co-localization of cleaved (activated) CAS3+ with SOX2+ cells revealed that neural progenitor apoptosis was significantly elevated in Scz organoids compared to Ctrl organoids (total n = 20 iPSC donors; Ctrl n = 5 and Scz n = 15). Scz organoids exhibited increased progenitor death irrespective of ventricular zone size and exhibited stable rates of error across ventricular zones (data not shown). In follow-up orthogonal validation experiments, increased death was replicated in an independent cohort via single-cell analysis of DNA fragmentation, DNA damage induction, and expression of cleaved PARP (see Fig. S2). Together, these data establish progenitor entropy as an intrinsic Scz phenotype in cultures of 3D patient-derived neural tissue. d Schematic of progenitor neuropathology in Scz organoids. Cortical development is defined by the sequential differentiation of neural progenitors into neurons that reside within the developing cortical plate. Due to a disruption in the survival of ventricular progenitors, we next assessed neuron numbers in Ctrl and Scz organoids. Scz organoids exhibited a decrease in the numbers of MAP2+ neurons relative to Ctrls (total n = 21 iPSC donors; Ctrl n = 4 and Scz n = 17). e Neuronal differentiation is disrupted in Scz organoids. Last, we sought to determine if disrupted differentiation also contributes to neuronal depletion in Scz organoids. To label dividing progenitor cells and assess their fate, we used a 24hr BrdU pulse and 7d chase paradigm in a pseudorandomly selected cross-sectional cohort. Data is provided as a Sankey flow visualization so that differentiation can be evaluated as the proportion of all BrdU+ cells within a field. Approximately half of the BrdU+ cells differentiated into CTIP2+ early-born cortical neurons (48.6%) in Ctrl organoids. Contrary to this, Scz organoids exhibited a disrupted developmental trajectory whereby only 16.1% of cells differentiated into early-born CTIP2+ neurons (total n = 8 iPSC donors; n = 4 Ctrl and n = 4 Scz). While a trend for increased self-renewal of PAX6+ progenitors was detected in Scz organoids (43.7% BrdU+ cells) relative to Ctrls (34.4% BrdU+ cells), this comparison was not significant. Thus, in addition to progenitor death, Scz organoids exhibit fewer neurons in developing cortical fields due to a mechanism that restrained neurogenesis by altering the differentiation trajectory of neural progenitors. *p < 0.05, ****p < 0.0001. Error bars reflect Standard Error of the Mean. Scale bar: b and d = 60 µm, whole organoid panel in c = 60 µm, far right panel of c = 100 µm. Ctrl control, Scz schizophrenia, VZ ventricular zone.
Fig. 2
Fig. 2. Proteomics and single-cell transcriptomics identify novel disease signatures of Scz patient organoids.
a Schematic of proteome mapping pipeline using tandem mass tag (TMT) chemistry and liquid chromatography-mass spectrometry (LC-MS). Briefly, whole organoids were subjected to tryptic digestion to isolate proteins from each sample. Proteins were next isobarically barcoded with TMT reagents, and then condensed into a single multiplexed suspension. This allowed samples to be run concurrently, eliminating batch-specific technical variance, and a low-noise assessment of both organoid variability (using a 4x2 design) and the identification of translated disease factors. Multiplexed suspensions were subsequently subjected to quantitative TMT-LC-MS for peptide detection, deconvolution, and quantification, and then computationally analyzed. b Scz organoids recapitulate the developmental proteome. Given numerous cellular signatures of Scz that separated cases from Ctrls (Fig. 1), we sought to determine the proteome diversity of Ctrl and Scz 3D organoids. The Scz organoid proteome was 99.95% identical in pooled protein diversity relative to Ctrls. Thus, Scz proteome differences are likely to be explained not in the induction of differential factors at the posttranslational level, but rather their total molecular quantity. c Individual proteins exhibit low variability in expression between groups. Given the high degree of conservation in peptide diversity between both Ctrl and Scz organoids, we next examined dispersion of individual proteins by generating their coefficient of variation (CVs) for each group. In both Ctrl and Scz samples, over 3000 detectable peptides for each group exhibited low variability (<20% CVs; blue dots). Only 3 and 10 proteins exhibited “high” variability in Ctrls and Scz organoids, respectively (red dots). In these panels, the black lines/box segregate proteins with median expression differences within groups. This reflects that Ctrl and Scz organoids exhibited similar patterns of proteome reproducibility in this particular analysis. d Subtle proteome differences in Scz patient-derived organoids. A heat-map of differentially expressed proteins shows differences in LC-MS expression intensities in Ctrl versus Scz organoids. Specifically, Scz organoids are defined by the differential expression of just 222 peptides, or ~5.9% of the detected proteome (heat-map). This heat-map thus provides a visualization of the individual peptide factors identified via LC-MS, and the consistency of expression differences at the single-protein level. Thus, consistent with our hypothesis, Scz organoid samples principally differed in their quantity, rather than diversity, of developmental factors. e Disease factors are detected and differentially expressed in Scz organoids. A heat-map of selected differentially expressed proteins in Scz organoids (Log2 key from panel d still applies). This included POU-domain peptide fragments that putatively mapped to the forebrain neuronal-development factor POU3F2 (BRN2), and disease factors with known and/or likely involvement in disease pathophysiology (e.g., COMT/PLCL1). In addition, factors with putative genetic risk but otherwise unestablished disease biology (e.g., PTN) were also differentially expressed in Scz organoids. f Schematic of pipeline for live single-cell RNA sequencing of organoids and clustering of 26,335 transcriptomes recapitulates fetal brain cellular identities. Briefly, organoids from 4 Ctrl and 3 Scz lines were generated concurrently, pooled by-line, and dissociated to a single-cell suspension. We rapidly conducted survival-based high-throughput FACS to purify samples to 2000 live cells/ µm per line. For robustness, post-FACS live cell viability was also cross-confirmed using Countess-II. Live cell suspensions were next rapidly loaded into 10x chromium microfluidic devices to produce barcoded single-cell nanodroplet emulsions. This emulsion was later broken, barcoded samples were amplified, libraries prepared, subjected to Illumina sequencing, and then parsed through a suite of unbiased computational analyses. Clustering of marker genes for cell-type specific clusters was conducted via pairwise comparisons of the normalized expression values for cells of a given cluster vs. the cells of all other clusters. Thus yielded unbiased gene sets, which were defined by the top 10 gene markers for each cluster that met a high-pass FDR threshold of 1% and >15,000 total read counts. Many of these prototypic markers defined cell-types consistent with human fetal tissue (see below). Here we present UMAP coordinates for 26,335 transcriptomes split by Ctrl and Scz cases, presenting the cell-type clusters identified in our unbiased clustering analysis. Cell-type labels were determined via a variety of approaches including marker gene-expression, automated annotation, and, namely, comparison with human fetal samples (see Methods for analysis pipeline). Bar chart (right) depicts cell-type proportions, illustrating that ~93% of Ctrl scRNA-Seq transcriptomes were identified as neural progenitors, proliferating cells, or terminal cortical cell-types (e.g., neurons and glia). Compared to this, only ~75% of Scz cell-types exhibited a similar conservation of identity. Compared to remaining cell types in Ctrl organoids (~7% cells), the remaining ~25% of Scz scRNA-Seq transcriptomes reflected enrichment for brain-related cell-types including putative neuroendothelial cells, structural markers, developing vasculature, retinal, and choroid plexus markers in Scz organoids. This analysis therefore revealed the cell-types produced at the expense of neurons in Scz organoids alluded to in pulse-chase experimentation depicted in Fig. 1e. Of note, all cell-types exhibited reproducible proportions across individual iPSC donors within respective groups (i.e., all Scz organoids exhibited similarly reproducible alterations in cell-type diversity, which was defined by an overarching loss of neurons). g Confirmation of progenitor and neuronal depletion in Scz organoids. Scz organoids exhibited a striking depletion of progenitors (SOX2+ and PAX6+) and pan-neuronal markers (MAP2+, DCX+, and STMN2+). These expression differences reflect both abundance and magnitude. Thus, replicating our prior results (see Fig. 1), scRNA-Seq analysis confirmed that progenitors and neurons are depleted in Scz organoids. Representative UMAPs for SOX2 and MAP2 are provided given that these are the same markers shown for progenitor and neuronal depletion in Fig. 1c, d. For Fig. 2f–j, total n = 26, 335 transcriptomes, n = 20,844 genes from 7 iPSC lines; Ctrl n = 15,089 transcriptomes from 4 Ctrl iPSC lines, and Scz n = 11,246 transcriptomes from 3 Scz iPSC lines. Ctrl: Control, Scz: Schizophrenia.
Fig. 3
Fig. 3. Altered cell-lineages and cell-specific neuropathology in Scz organoids.
a Computational analyses reveal altered single-cell lineages in Scz organoids. Diffusion maps of single-cell differentiation trajectories were generated for all 26,335 cells via harmonized principal components. This revealed similar, but subtly altered, differentiation trajectories in Scz organoids (a). Heat-maps of slingshot-identified genes most-associated with pseudotime cell lineages of Scz organoids are also presented. Note differences in enrichment for collagen and matrix organization factors in Scz single-cell transcriptomes, whereas Ctrl organoids tended to exhibit up-regulation of neuronal factors (e.g., STMN2, TUBB2B, CRABP1) as expected. Notably, markers such as IFITM3 and POU5F1 (OCT4), as well as cell adhesion and vascularization factors, segregated Scz from Ctrl transcriptomes within pseudotime trajectories. Expression of these markers did not appear to identify a broader pool of undifferentiated stem cells, but rather indicated a series of intrinsic alterations within pseudotime trajectories of Scz cell-types and their differentiation patterns. These pseudotime differentiation trajectory analyses broadly replicated data presented in Figs. 1–2, notably disrupted neuronal differentiation dynamics that contributed to fewer total neurons in Scz organoids. In addition, these computational data support the notion that progenitors are diverted towards altered lineages (notably, neuroendothelial and vascularization-related lineages, see Fig. 2f) via differentially enriched gene-sets in Scz organoids. The net result of these transcriptional differences is that while Scz progenitors and organoids produce some neurons, vascular-related cell-types tend to be overproduced in Scz organoids. b Scz progenitors exhibit disrupted transcription of axon development factors. SOX2+ progenitor scRNA-Seq transcriptomes were isolated and differentially expressed genes (DEG) examined (5% FDR threshold average logFC Scz/Ctrl ≤2.5, and >3). This revealed down-regulation of a gene-set involved in axon development. Other DEG targets in Scz progenitors by biological process are presented here as a dotplot, and resulted in gene-set enrichment for extracellular organization, adhesion, as well as angiogenesis in Scz progenitors. These differentially enriched gene-sets further support the notion that Scz progenitors exhibit cell-specific transcriptional remodeling, which is consistent with the fact that very early progenitor cell-types retain the ability to putatively differentiate into neuronal or neuroendothelial lineages. cd, Scz neurons exhibit pathway enrichment for growth factor binding. Similar to progenitors, neuron scRNA-Seq transcriptomes were examined for DEGs (5% FDR threshold average LogFC Scz/Ctrl ≤ 2.5, and >3). Analysis of gene ontologies by molecular function revealed enrichment for “growth factor binding” in Scz neurons (c), which was defined by down-regulation of TrkA (NTRK1) neurotrophin receptor gene expression and up-regulation of factors such as FURIN (neurotrophin pro→mature processing), FGFR2, PDGFA, TGFBR3, and the interleukin-6 signal transducer IL6ST (d). Protein–protein interactions between enriched growth factor binding factors in Scz neurons revealed notable interplay and interaction pathways (e.g., Furin →NGF→NTRK1) that place neuron-specific DEGs such as IL6ST and S100A13 as downstream targets of growth factor binding enrichment (d). Alternatively, these downstream factors may be putatively repressed by the inhibitory interaction effect of IGFBP3 on VEGFA (d), which are prototypic markers of neurovascular cells which also exhibited increased abundance within Scz organoids (see Fig. 2f). Other pathway analysis (e.g., KEGG) identified altered Pl3K-Akt signaling in Scz neurons (see Fig. S4). e Cell-specific disruption of neurotrophic factors and receptors in Scz organoids. Given unbiased detection of alterations in NT-3 (NTF3) in Scz progenitors and TrkA (NTRK1) receptors in Scz neurons, we next examined progenitor cell-types for specific differences in neurotrophins (BDNF, BDNF-Antisense/BDNF-AS, NGF, NT-3, and NT-4; left) and their cognate tyrosine kinase receptors (TrkA, TrkB, TrkC, & p75 NTR/NGFR; right). SOX2+ progenitors and radial glial cell (RGC) progenitors examined almost identical neurotrophin dysregulation and were defined by the trend for decreased expression of BDNF, BDNF-AS, NT-3, and TrkB expression. Curiously, NT-4 was up-regulated in Scz progenitor cell-types. Scz neurons were defined only by their near 3-fold reduction of TrkA gene expression. Thus, Scz progenitors and neurons exhibit a developmental “switch” in neurotrophic growth factor pathology within organoids. fg, Validating gene-expression differences of candidate proteome-derived targets, BRN2 (POU3F2) and PTN, in specific cell-types of Scz organoids. Candidate proteome targets (Fig. 2e) were cross-examined for differences at the single-cell level (see Fig. S5 for expression of proteome targets in global, progenitor-only and neuron-only scRNA-Seq datasets). Given survival, differentiation, and diminished growth factor support, here we emphasize the neuronal transcription factor BRN2 (POU3F2) and putative growth factor PTN as putative targets for mechanism experiments. Scz progenitors exhibited almost complete depletion of BRN2 relative to Ctrl progenitors, indicating disrupted induction of neuronal differentiation. PTN expression was disrupted in both Scz progenitors and neurons but exhibited a greater difference in progenitors. h Resolving cell-type specificity of Scz neuropathology in 3D cerebral organoids. Schematic summary of cell-specific alterations in Scz progenitors (left) and neurons (right). Scz progenitors exhibited entropy in neurotrophic growth factors, specific reduction of TrkB (NTRK2), and depletion of axon development factors. Scz progenitors also exhibit enrichment for extracellular structure, matrix organization, and angiogenesis factors, which partially explains the intrinsic alteration in cell lineage (Fig. 3a) and differentiation trajectories towards neuroendothelial factors and cell types (Figs. 2, 3). Total scRNA-Seq dataset comprised n = 26, 335 cells, n = 20,844 genes from 7 iPSC lines; Ctrl n = 15,089 scRNA-Seq transcriptomes from 4 Ctrl iPSC lines, and Scz n = 11, 246 scRNA-seq transcriptomes from 3 Scz iPSC lines. * significant p and FDR values. # = p value significant, with a final FDR score at the cut-off threshold. Ctrl control, Scz schizophrenia.
Fig. 4
Fig. 4. BRN2 rescues neurogenesis, but not survival, in Scz organoids.
a Schematic of self-regulating BRN2 lentiviral vector and supplementation strategy for BRN2 rescue experiments. Briefly, we modified a previously validated lentiviral construct that transiently induces exogenous BRN2 expression but “switches-off” upon completion of neuronal differentiation and assumption of a post-mitotic neuronal fate. After supplementing neuronal transcriptional programs, exogenous BRN2-Virus transcripts are decayed via binding of the neuron-specific noncoding RNA, miRNA-124, to recognition units embedded within viral transcripts (see Fig. S7). This BRN2-Virus construct thus allows transient supplementation of BRN2 levels in Scz progenitors undergoing differentiation without sustained overexpression of this target in mature neurons. be, BRN2 supplementation increases neuron numbers in Scz organoids. Ctrl and Scz organoids were infected with CTRL-Virus and BRN2-Virus during organoid neural induction. Images show GFP+ cells within ventricular zones. Viral infection rates appeared similar between Ctrl and Scz organoids, and viral GFP expression was detected within progenitor pools as expected (b). Scz organoids infected with CTRL-Virus exhibited fewer neurons than Ctrl organoids. However, when comparing Scz organoids infected with CTRL-Virus versus BRN2-Virus, we observed a significant rescue of BRN2+ neuron number. Scz organoids infected with BRN2-Virus exhibited substantially increased BRN2+ neuron numbers, which were comparable to Ctrl organoids. Enlarged whole-organoid images are provided in Supplementary Material (see Fig. S8), and graphs reflect raw data for complete data transparency of rescue effects (d, CTRL-Virus Ctrl organoids n = 43 fields, n = 16 organoids, and n = 3 independent Ctrl lines; BRN2-Virus Ctrl organoids n = 40 fields, n = 18 organoids, and n = 3 Ctrl independent lines; CTRL-Virus Scz organoids n = 65 fields, n = 25 organoids, and n = 5 independent Scz lines; BRN2-Virus Scz organoids n = 42 fields, n = 14 organoids, and n = 4 independent Scz lines). To determine if this effect was reflected in pan neuronal numbers, we also examined MAP2+ neurons in infected organoids. Consistent with data in Fig. 2, CTRL-Virus+ Scz organoids exhibited a decreased number of MAP2+ neurons compared to Ctrl organoids. However, MAP2+ neuron numbers were significantly increased in the BRN2-Virus+ Scz organoids (e, CTRL-Virus Ctrl organoids n = 73 fields, n = 35 organoids, and n = 5 independent Ctrl lines; BRN2-Virus Ctrl organoids n = 55 fields, n = 26 organoids, and n = 3 Ctrl independent lines; CTRL-Virus Scz organoids n = 52 fields, n = 25 organoids, and n = 5 independent Scz lines; BRN2-Virus Scz organoids n = 64 fields, n = 28 organoids, and n = 5 independent Scz lines). Thus, transient BRN2 supplementation resulted in a significant recovery of neurons in 3D Scz patient-derived organoids, which confirms a mechanistic role for BRN2 within Scz organoids. Each data point on graphs reflects raw data (an independent, non-overlapping, cortical field) for complete data transparency, with the average of individual iPSC lines provided in Supplementary Material (see Fig. S7d). f No effect of BRN2 supplementation on progenitor cell death in Scz organoids. Scz organoids are associated with increased rates of cell death of ventricular zone neural progenitors (Fig. 1). To determine if BRN2 regulates the survival of progenitors, we assessed the number of CAS3+ in infected organoids. In both CTRL- and BRN2-Virus infected Scz organoids, there was an increase in progenitor death relative to Ctrl samples (e, CTRL-Virus Ctrl organoids n = 34 fields, n = 19 organoids, and n = 3 independent Ctrl lines; BRN2-Virus Ctrl organoids n = 35 fields, n = 19 organoids, and n = 3 independent Ctrl lines; CTRL-Virus Scz organoids n = 35 fields, n = 20 organoids, and n = 4 independent Scz lines; BRN2-Virus Scz organoids n = 45 fields, n = 23 organoids, and n = 4 independent Scz lines). These data indicate that decreased levels of BRN2 do not contribute to the increased apoptosis of progenitors in Scz organoids. Each data point on graphs reflects raw data (comprising an independent ventricular zone) for complete data transparency (for the average of groups, see Fig. S7d). In sum, we found that BRN2 has a mechanistic role in promoting neuron production in Scz organoids, but not the survival of neuronal progenitors. This selective rescuing effect of BRN2 highlights that multiple factors and pathways likely combine to produce progenitor and neuronal pathology in developing cortical assemblies of Scz organoids. ****p < 0.0001. Error bars reflect Standard Error of the Mean. Scale bar: b-20x = 60 µm, b-40x = 20 µm, cf = 60 µm. Ctrl: Control, Scz: Schizophrenia. X in schematic denotes cell death.
Fig. 5
Fig. 5. PTN rescues both survival and neurogenesis in Scz Organoids.
a Schematic of PTN-supplementation regime for rescue experiments. Proteomics revealed a decrease in total PTN expression in Scz organoids (Fig. 2e). Similarly, scRNA-Seq revealed that Scz organoids exhibited lower PTN gene-expression in progenitors and neurons (Fig. 3f, g). We identified that organoids supplemented with 25 ng/ml PTN (a concentration for growth factor supplements) resulted in viable tissue without gross morphological evidence of deterioration. This subsequently permitted a laboratory-controlled examination of PTN’s role in intrinsically arising neuropathology of Scz in self-developing human-derived neural tissue. bc, PTN treatment promotes progenitor survival in Scz organoids. PTN is expressed in most cell type clusters in organoids (Fig. 3f) but is particularly enriched in neural progenitors (Fig. 3g). Post treatment, the ventricular zones of PTN-supplemented Scz organoids often appeared enriched for Nestin (b). PTN treatment rescued progenitor death in the ventricular zones of Scz organoids to levels consistent with Ctrl cultures (panel c; Vehicle Ctrl n = 69 fields, n = 28 organoids, and n = 5 independent Ctrl lines; PTN-supplemented Ctrl n = 70 fields, n = 30 organoids, and n = 5 independent Ctrl lines; Vehicle Scz n = 90 fields, n = 44 organoids, and n = 9 independent Scz lines; PTN-supplemented Scz n = 85 fields, n = 41 organoids, and n = 9 independent Scz lines). Enlarged, whole-organoid, images are also provided in the Supplementary Material (see Fig. S9). PTN treatment also broadly increased new-born cell survival in Scz organoids (see Fig. S10). These data suggest that PTN exerts neurotrophic-like effects on neural progenitors in organoids, and that low PTN expression in Scz organoids regulates neural progenitor cell death. As with our prior mechanistic rescue figure, raw data are graphed here for phenotype transparency and each data point on graphs reflects an independent ventricular zone (see Fig. S11 for averaged data). de, PTN supplementation restores neuronal differentiation in Scz organoids. We next sought to determine if PTN levels contribute to neurogenesis phenotype in Scz organoids. To do this, we time-locked our 24 h-7d BrdU pulse-chase paradigm to coincide with commencement of PTN treatment. As in previous experiments, Scz organoids exhibited disrupted neuronal differentiation relative to Ctrl organoids. However, PTN treatment rescued the disrupted neurogenesis of Scz organoids. PTN supplementation restored the number of MAP2+ BrdU+ neurons in Scz organoids to levels consistent with Ctrl cultures (panel d; Vehicle Ctrl n = 75 fields, n = 26 organoids, and n = 5 independent Ctrl lines; PTN-supplemented Ctrl n = 79 fields, n = 27 organoids, and n = 5 independent Ctrl lines; Vehicle Scz n = 130 fields, n = 45 organoids, and n = 10 independent Scz lines; PTN-supplemented Scz n = 106 fields, n = 42 organoids, and n = 10 independent Scz lines). Thus, in addition to promoting progenitor survival, PTN-supplementation also promotes neuronal differentiation in Scz organoids. Lastly, and consistent with all prior phenotypes, PTN treatment increased total MAP2+ neuron numbers in Scz cortical fields as expected (panel e; Vehicle Ctrl n = 58 fields, n = 19 organoids, and n = 4 independent Ctrl lines; PTN-supplemented Ctrl n = 67 fields, n = 25 organoids, and n = 4 independent Ctrl lines; Vehicle Scz n = 150 fields, n = 57 organoids, and n = 11 independent Scz lines; PTN-supplemented Scz n = 97 fields, n = 41 organoids, and n = 10 independent Scz lines). Together, these experiments established that PTN mechanistically contributes to neuron numbers in 3D cortical assemblies within Scz organoids. Each data point on graphs reflects an independent, non-overlapping, cortical field, for phenotype transparency, with averaged data provided in Supplementary Material (see Fig. S11). ****p < 0.0001. Error bars reflect Standard Error of the Mean. Scale bar: 60 µm. Ctrl control, Scz schizophrenia.

References

    1. Thompson PM, Vidal C, Giedd JN, Gochman P, Blumenthal J, Nicolson R, et al. Mapping adolescent brain change reveals dynamic wave of accelerated gray matter loss in very early-onset schizophrenia. Proc Nat Acad Sci. 2001;98:11650–5. doi: 10.1073/pnas.201243998. - DOI - PMC - PubMed
    1. Mednick SA, Machon RA, Huttunen MO, Bonett D. Adult schizophrenia following prenatal exposure to an influenza epidemic. Arch Gen Psychiatry. 1988;45:189–92. doi: 10.1001/archpsyc.1988.01800260109013. - DOI - PubMed
    1. Van Os J, Selten J-P. Prenatal exposure to maternal stress and subsequent schizophrenia: the May 1940 invasion of the Netherlands. Br J Psychiatry. 1998;172:324–6. doi: 10.1192/bjp.172.4.324. - DOI - PubMed
    1. St Clair D, Xu M, Wang P, Yu Y, Fang Y, Zhang F, et al. Rates of adult schizophrenia following prenatal exposure to the Chinese famine of 1959–1961. JAMA. 2005;294:557–62. doi: 10.1001/jama.294.5.557. - DOI - PubMed
    1. McGrath J. Hypothesis: is low prenatal vitamin D a risk-modifying factor for schizophrenia? Schizophr Res. 1999;40:173–7. doi: 10.1016/S0920-9964(99)00052-3. - DOI - PubMed

Publication types

Substances