. 2021 Dec;600(7887):121-126.
doi: 10.1038/s41586-021-04099-6. Epub 2021 Nov 17.

Mental health concerns during the COVID-19 pandemic as revealed by helpline calls

Affiliations

Mental health concerns during the COVID-19 pandemic as revealed by helpline calls

Marius Brülhart et al. Nature. 2021 Dec.

Abstract

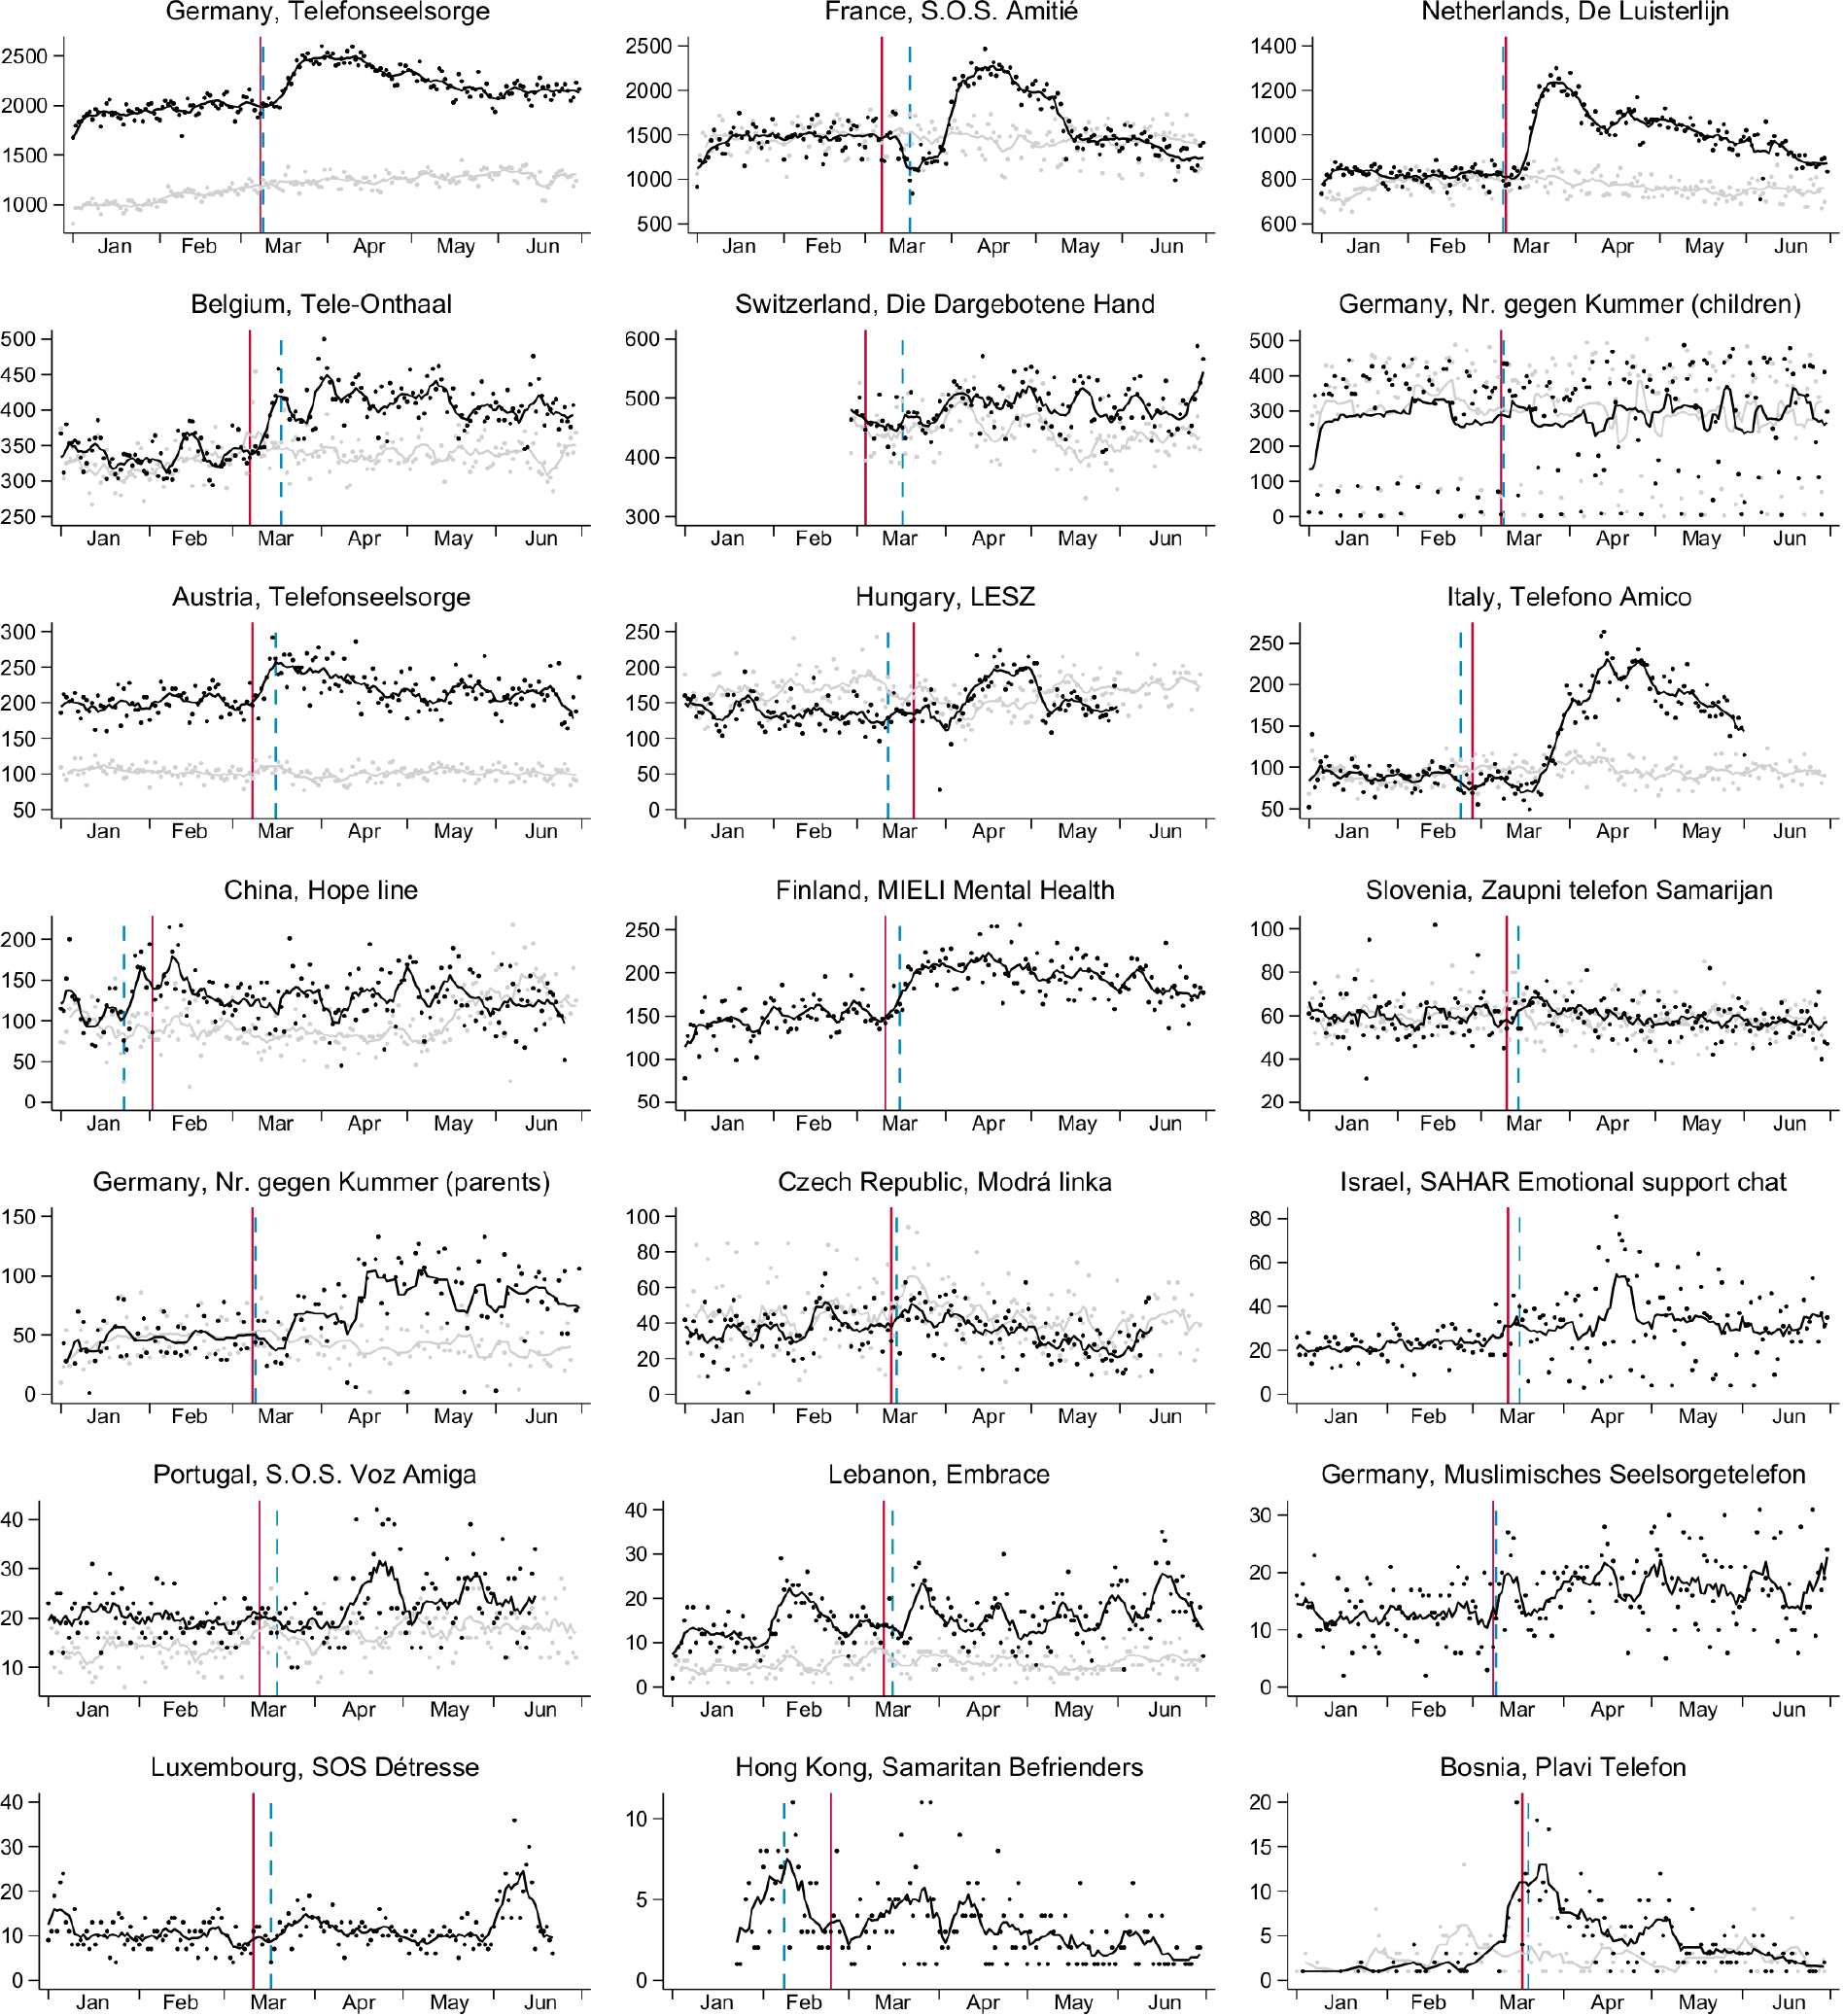
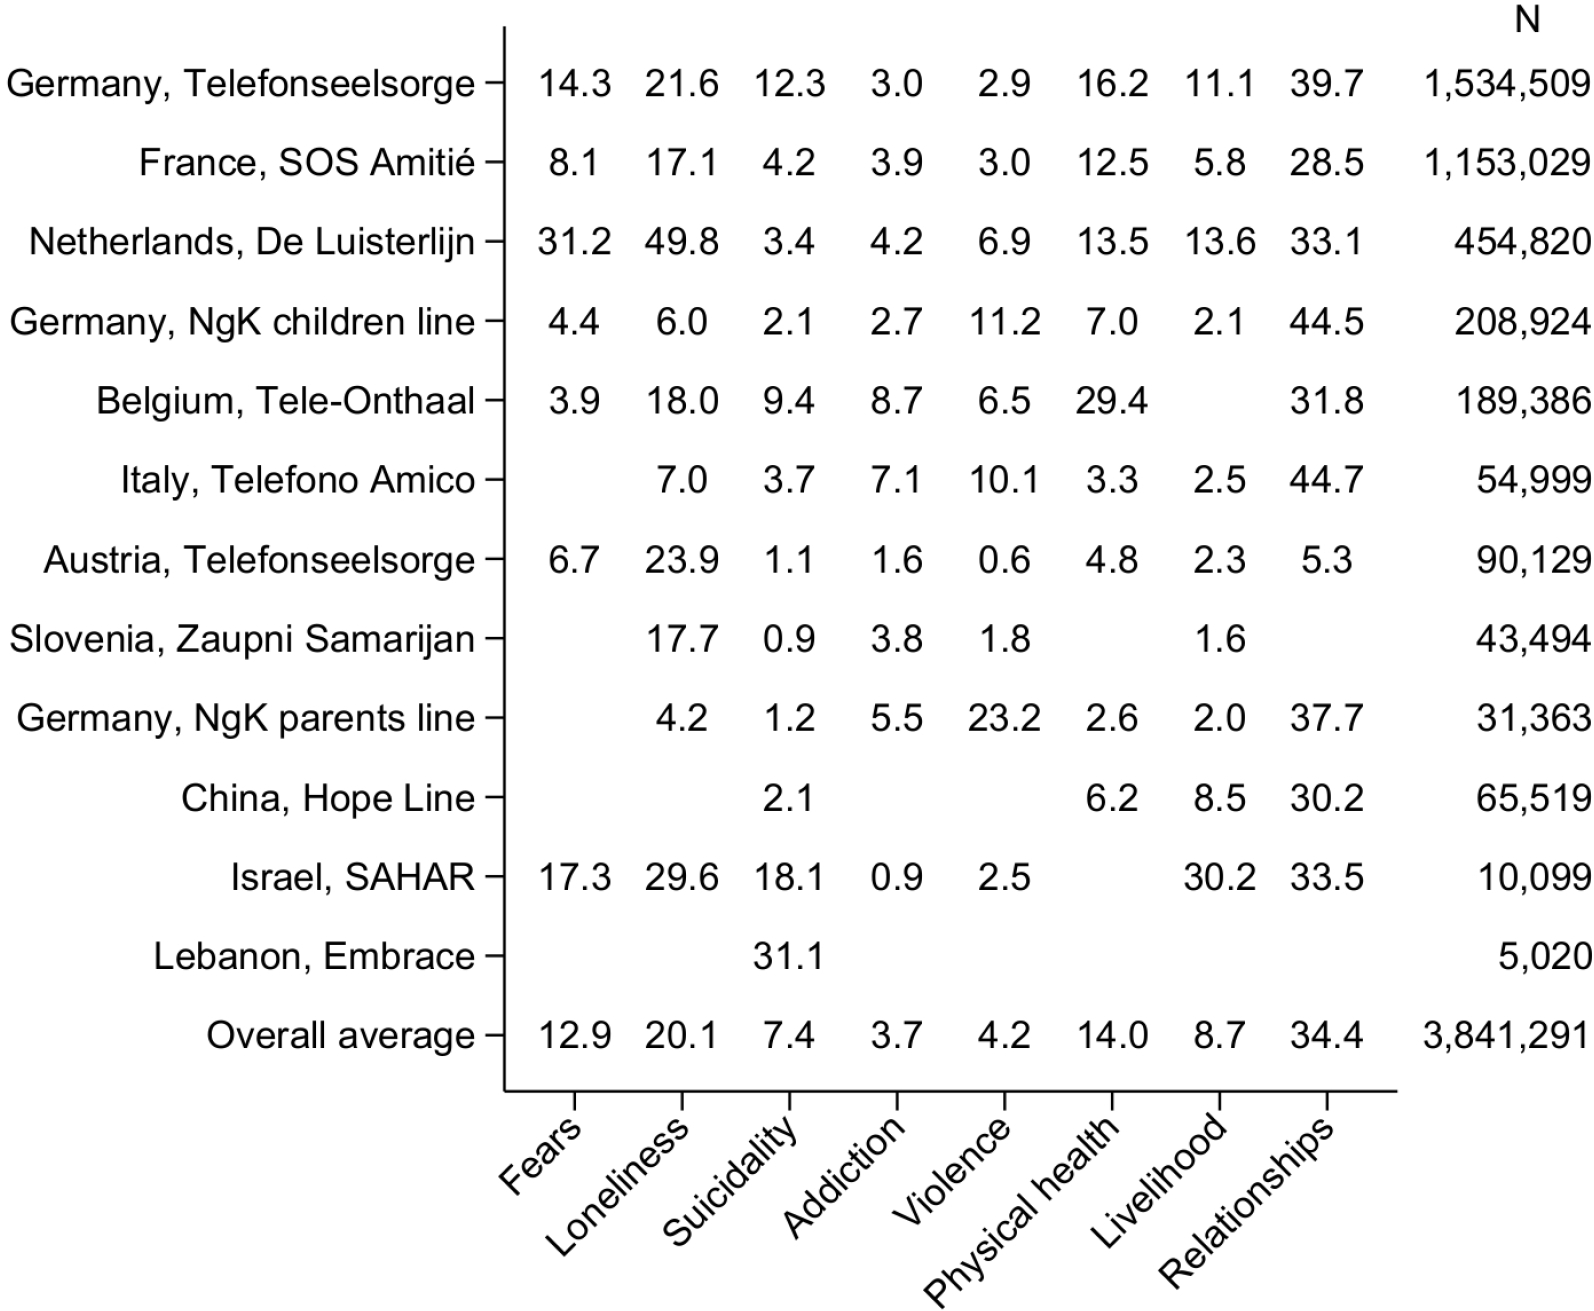
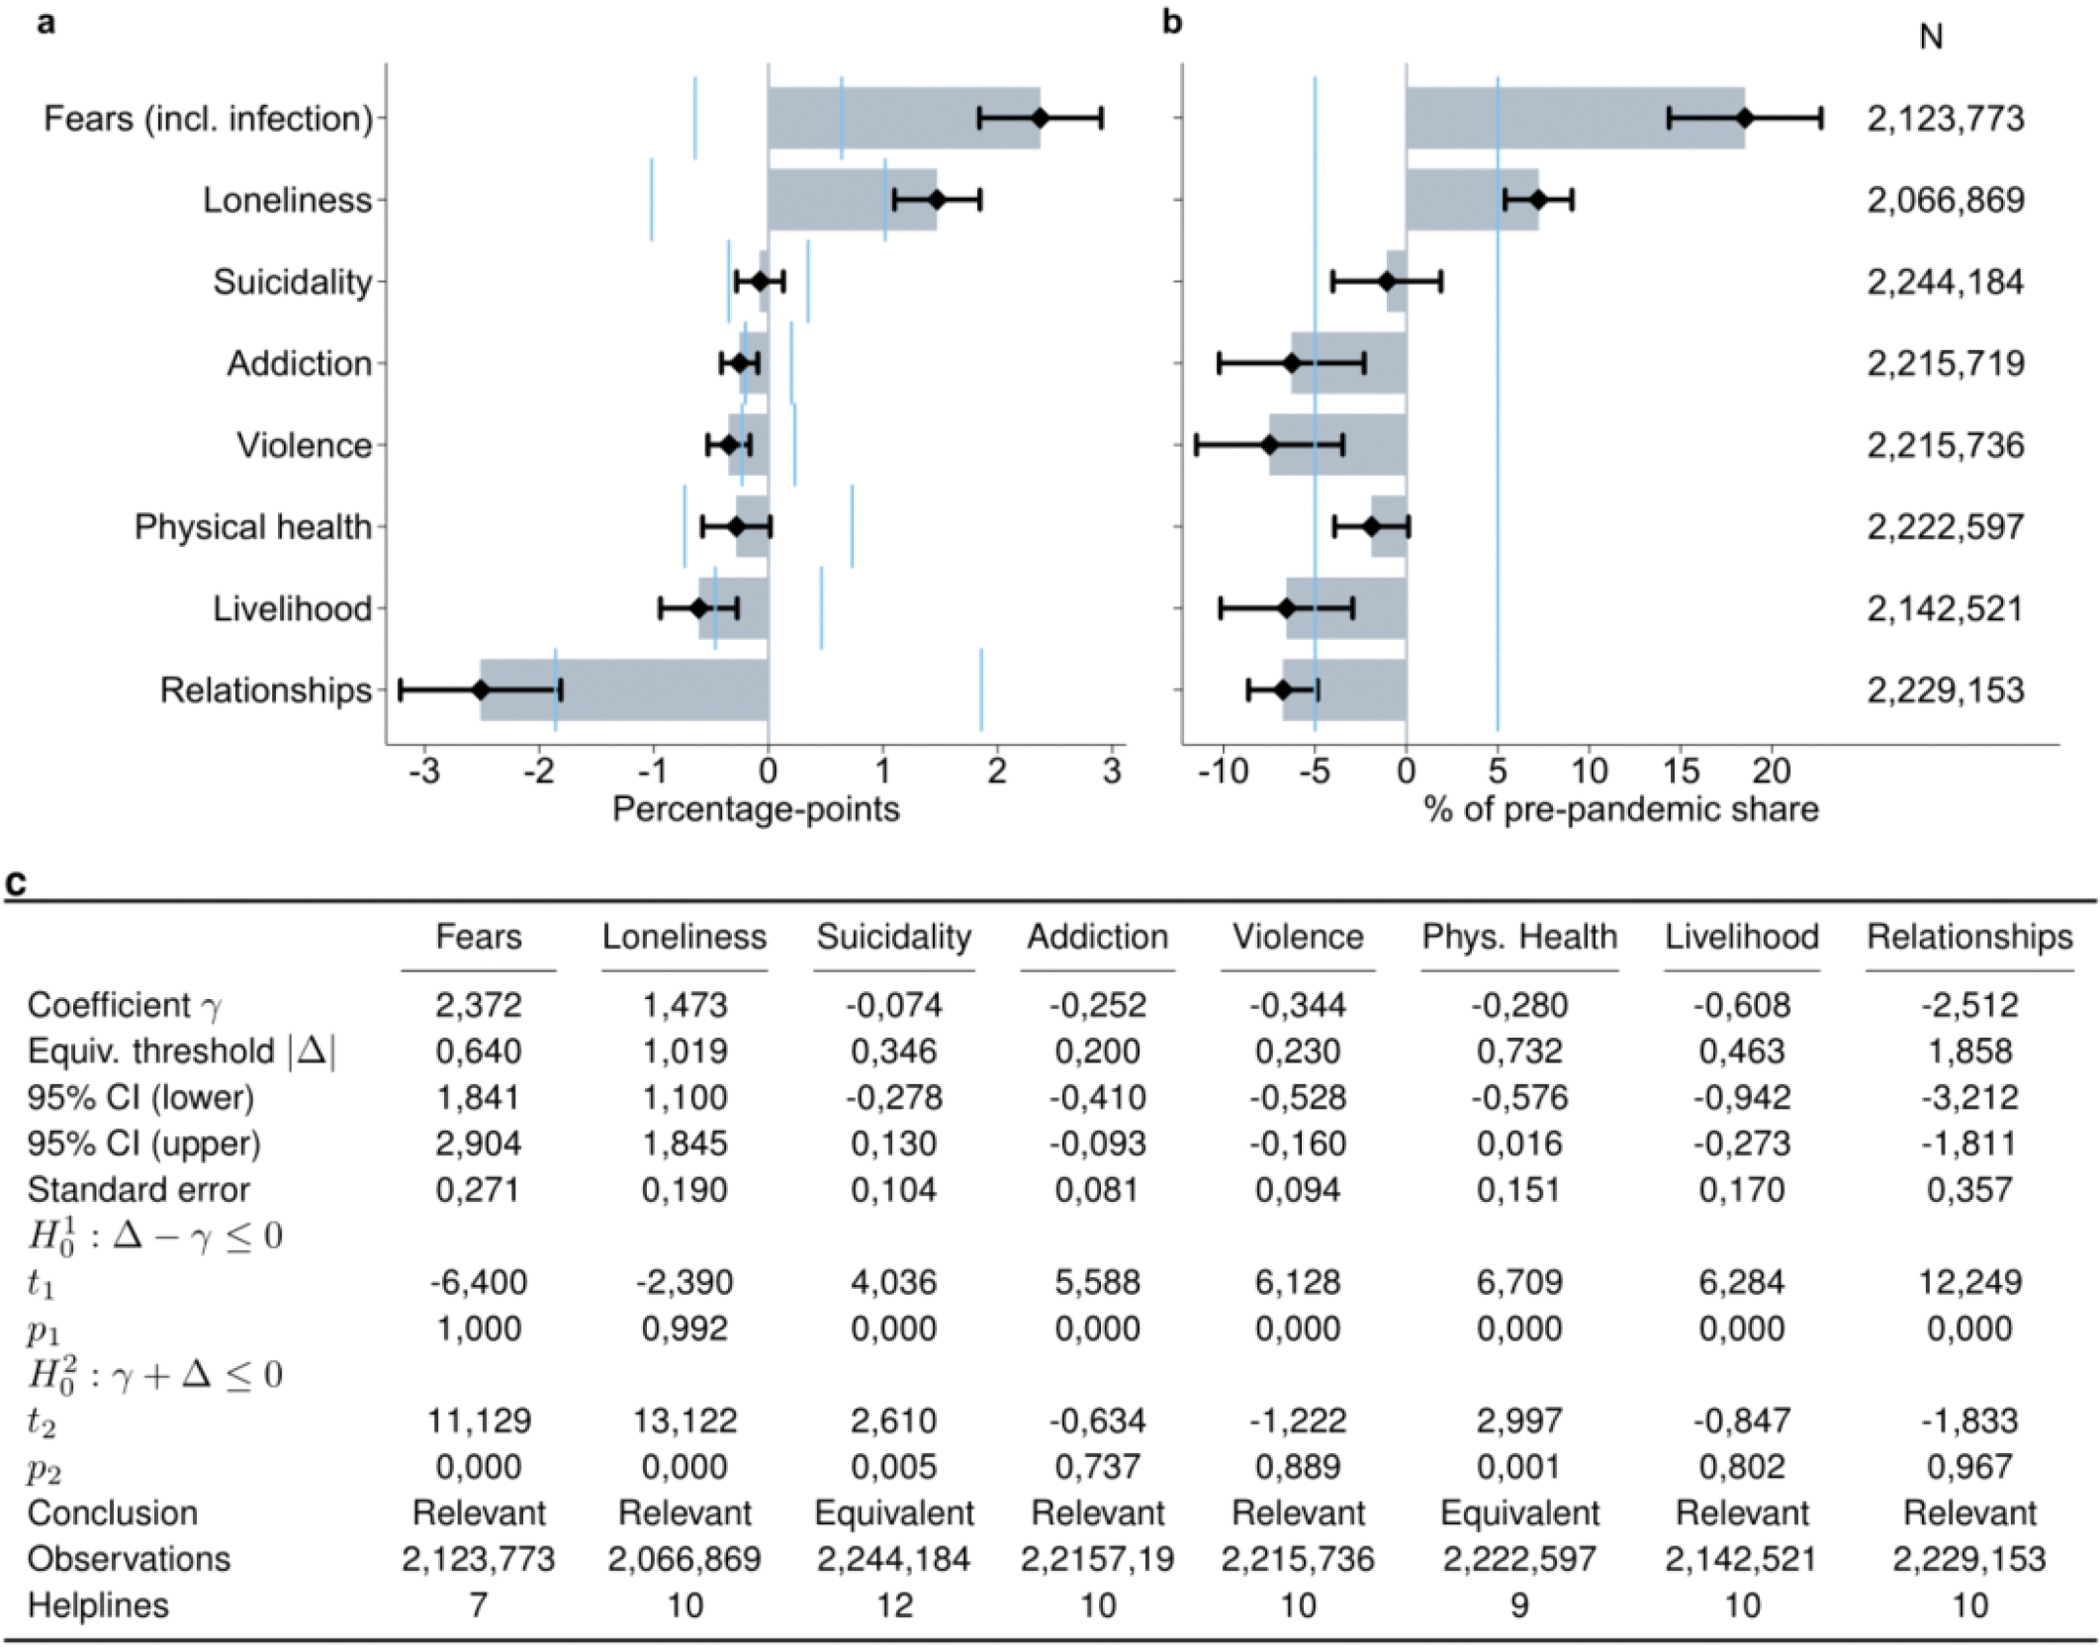
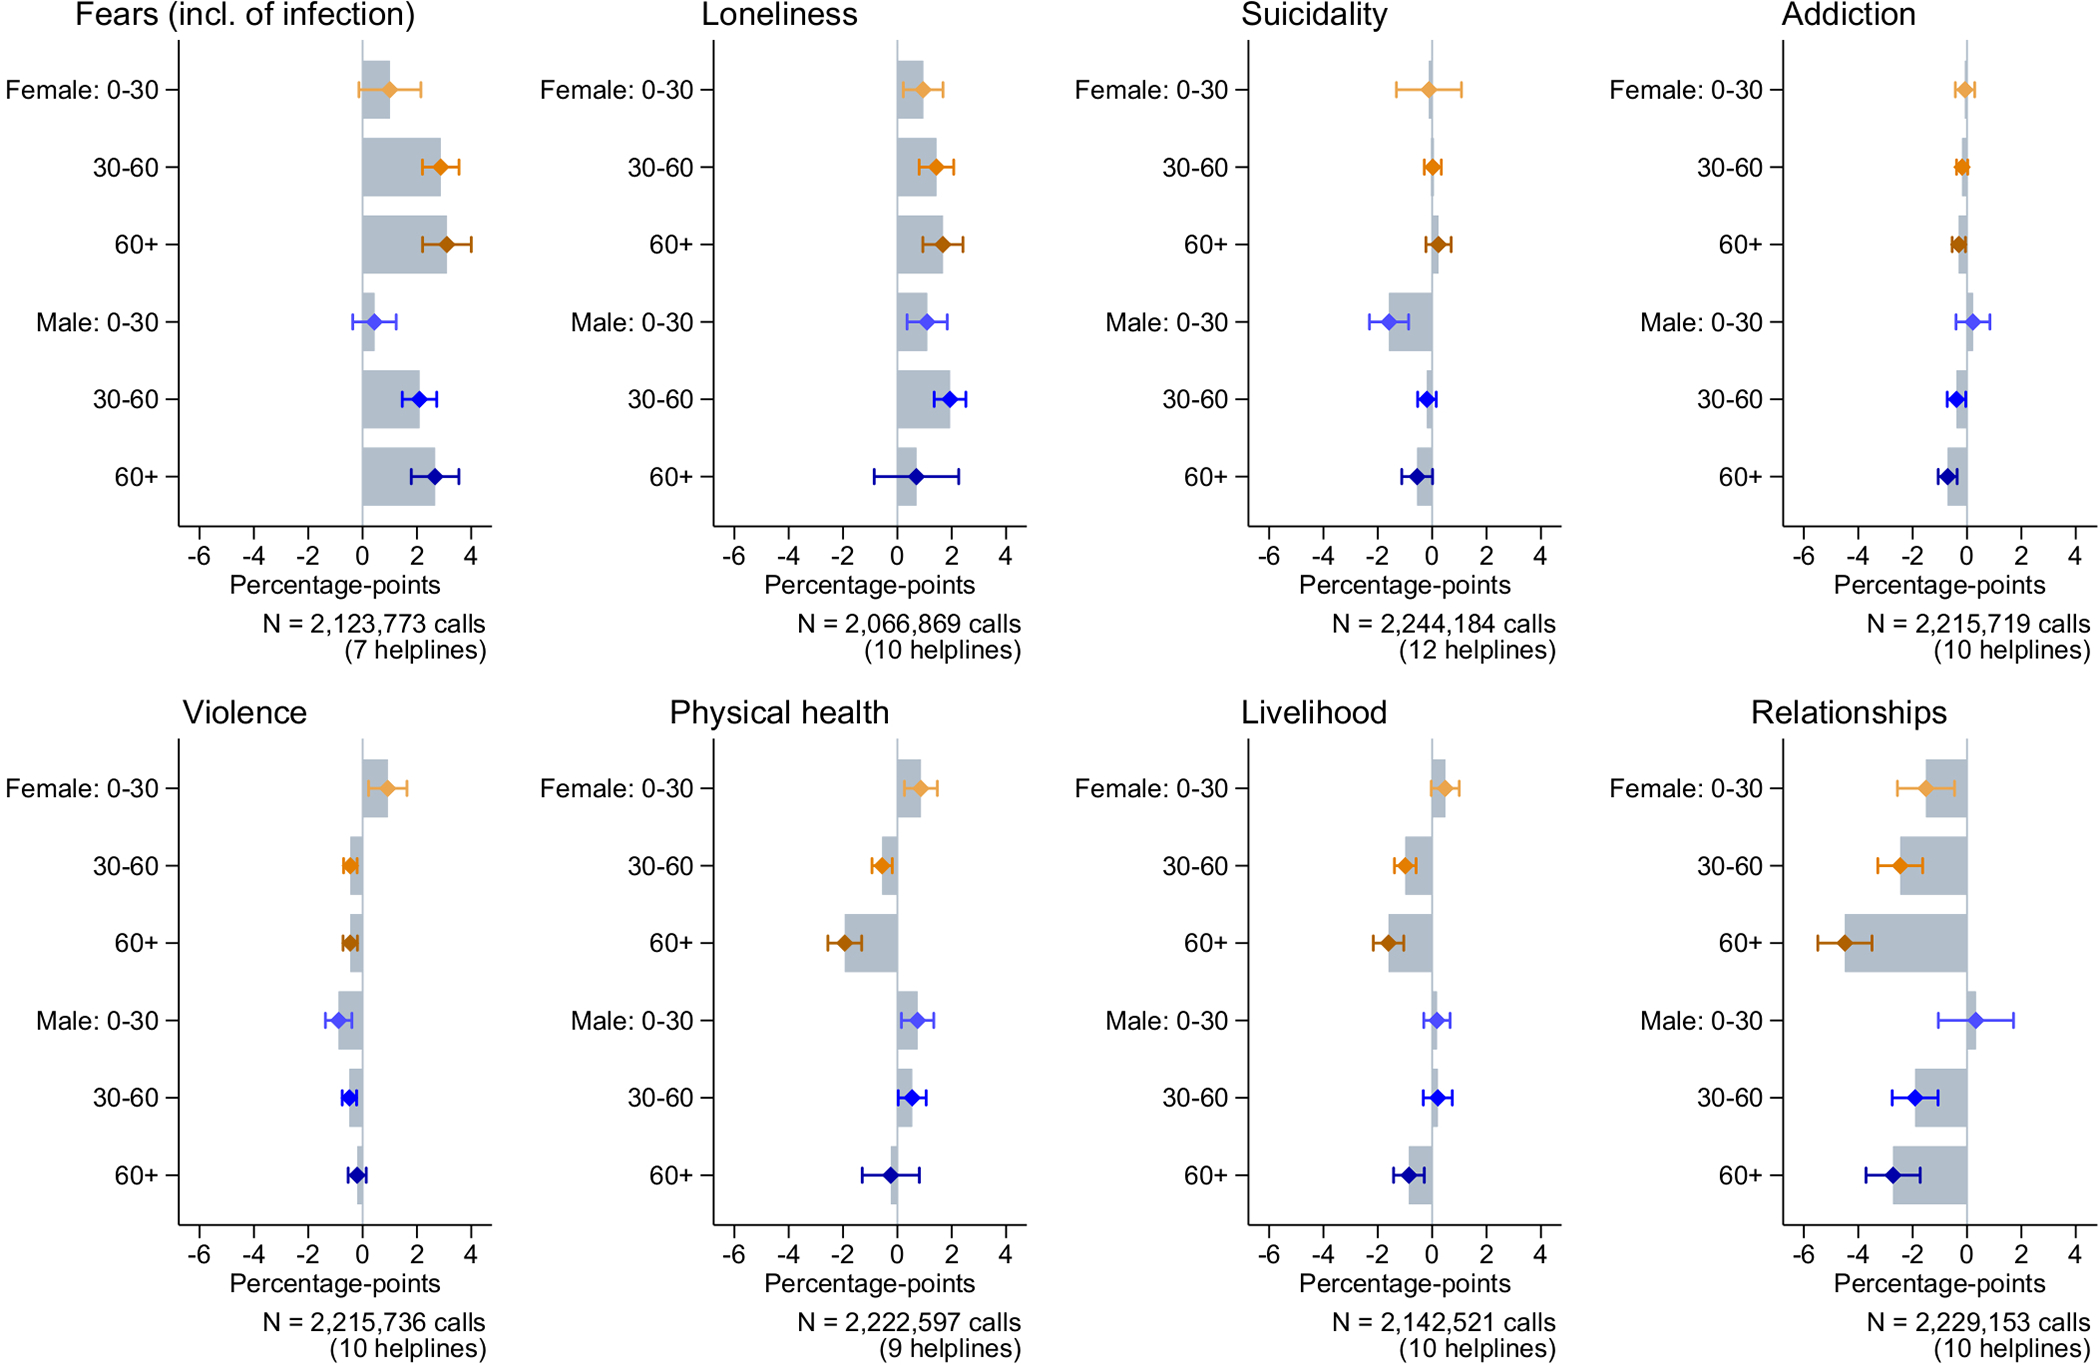
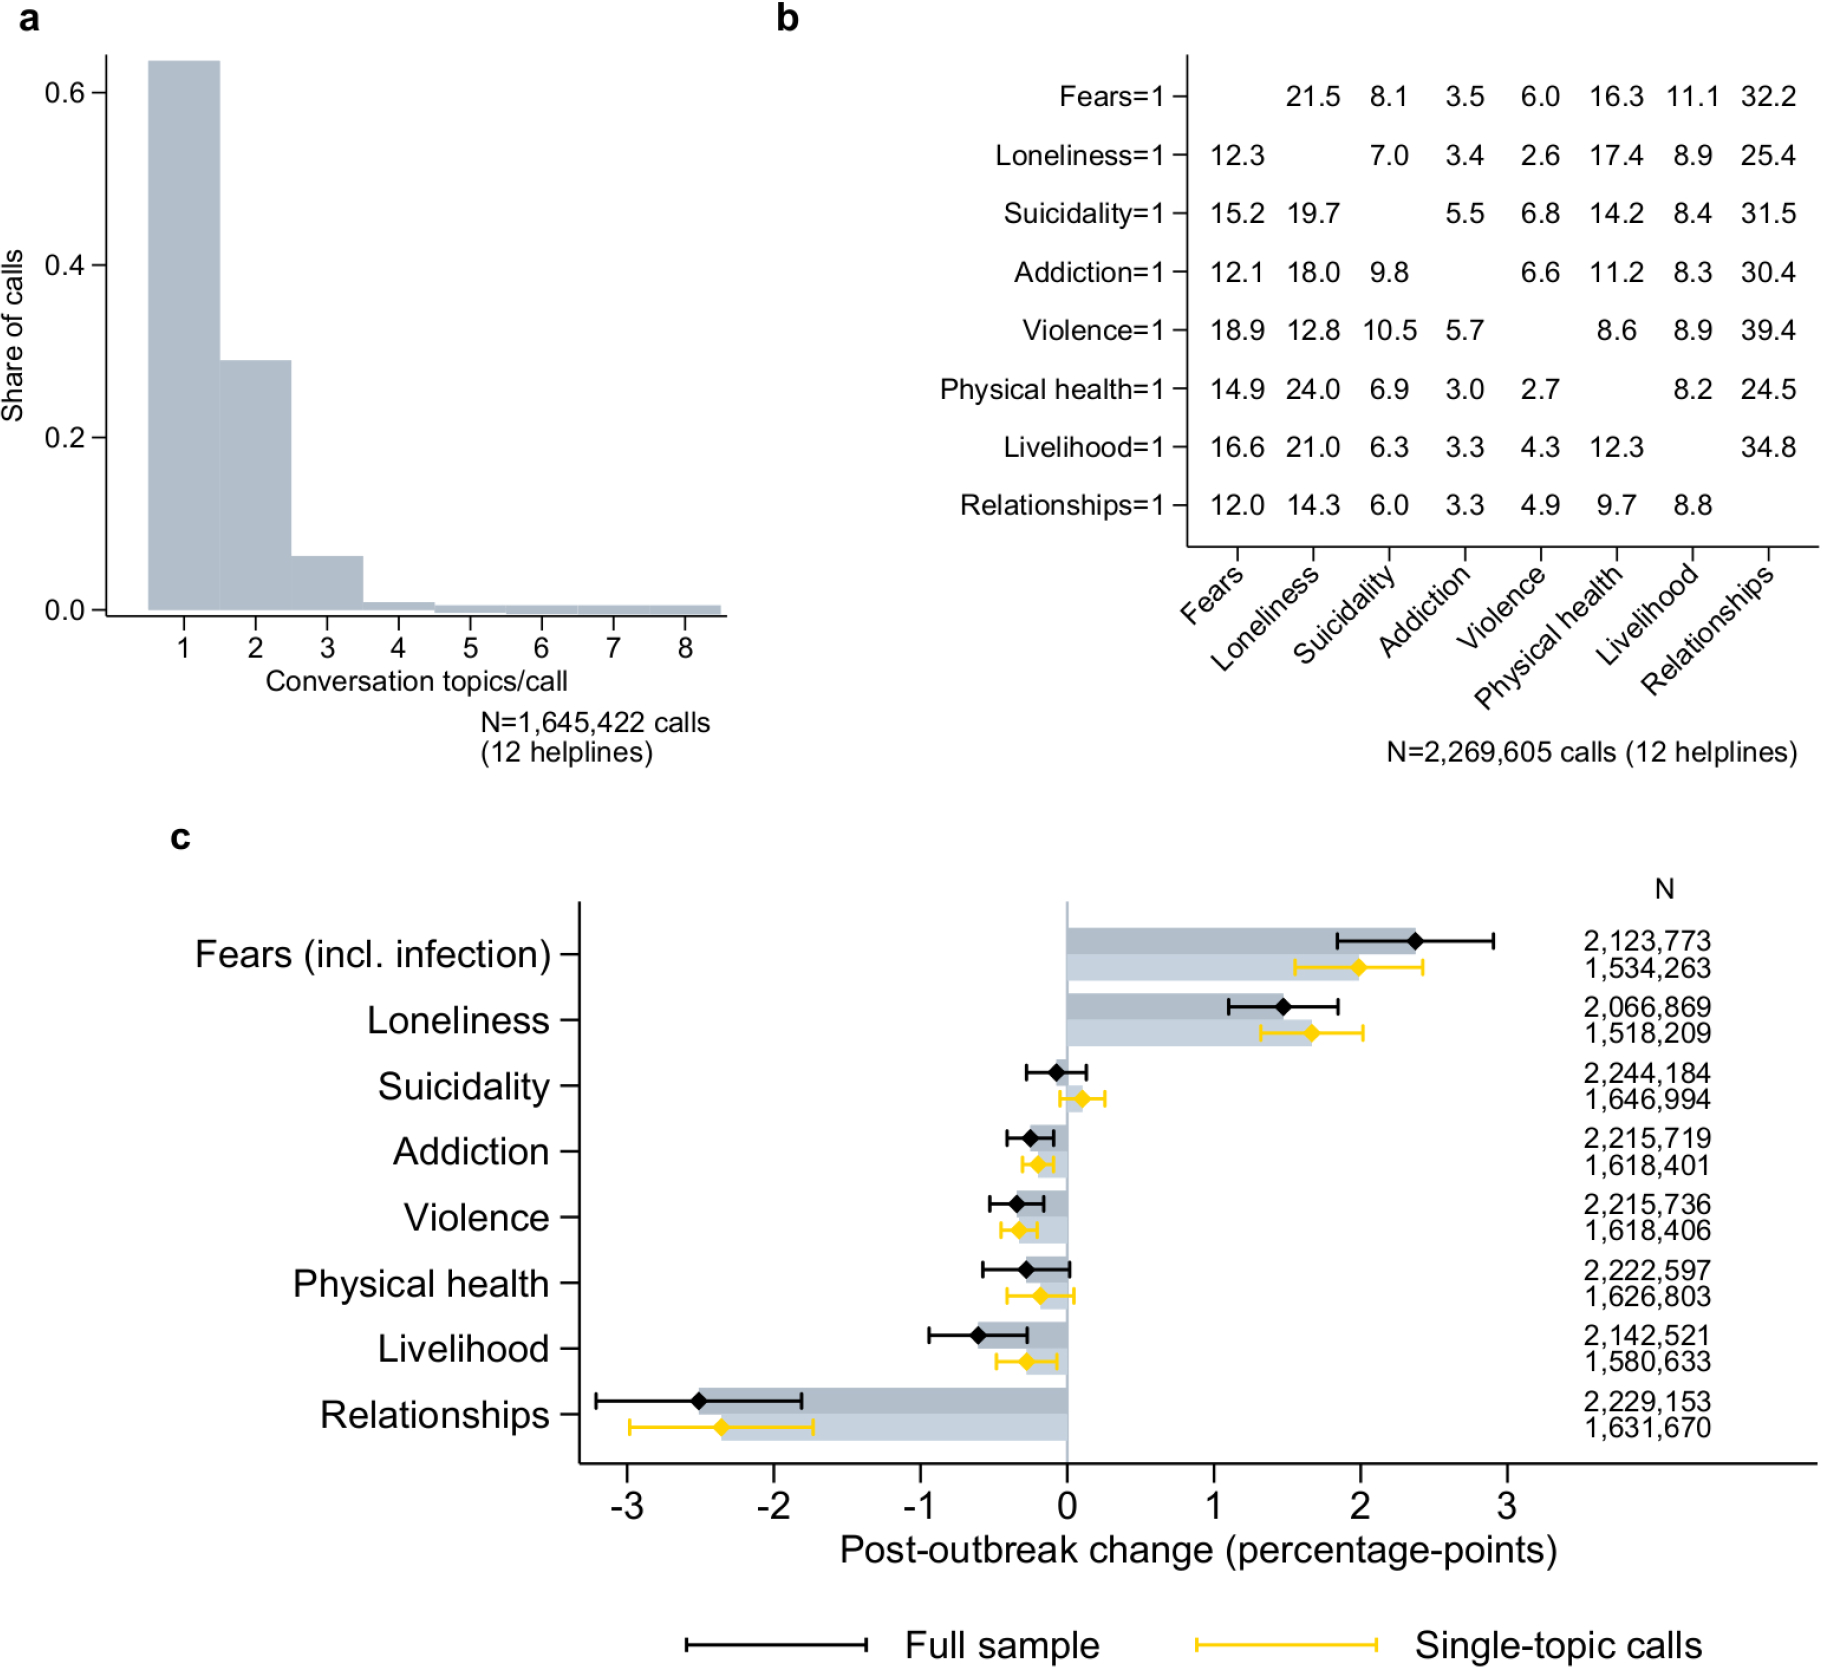
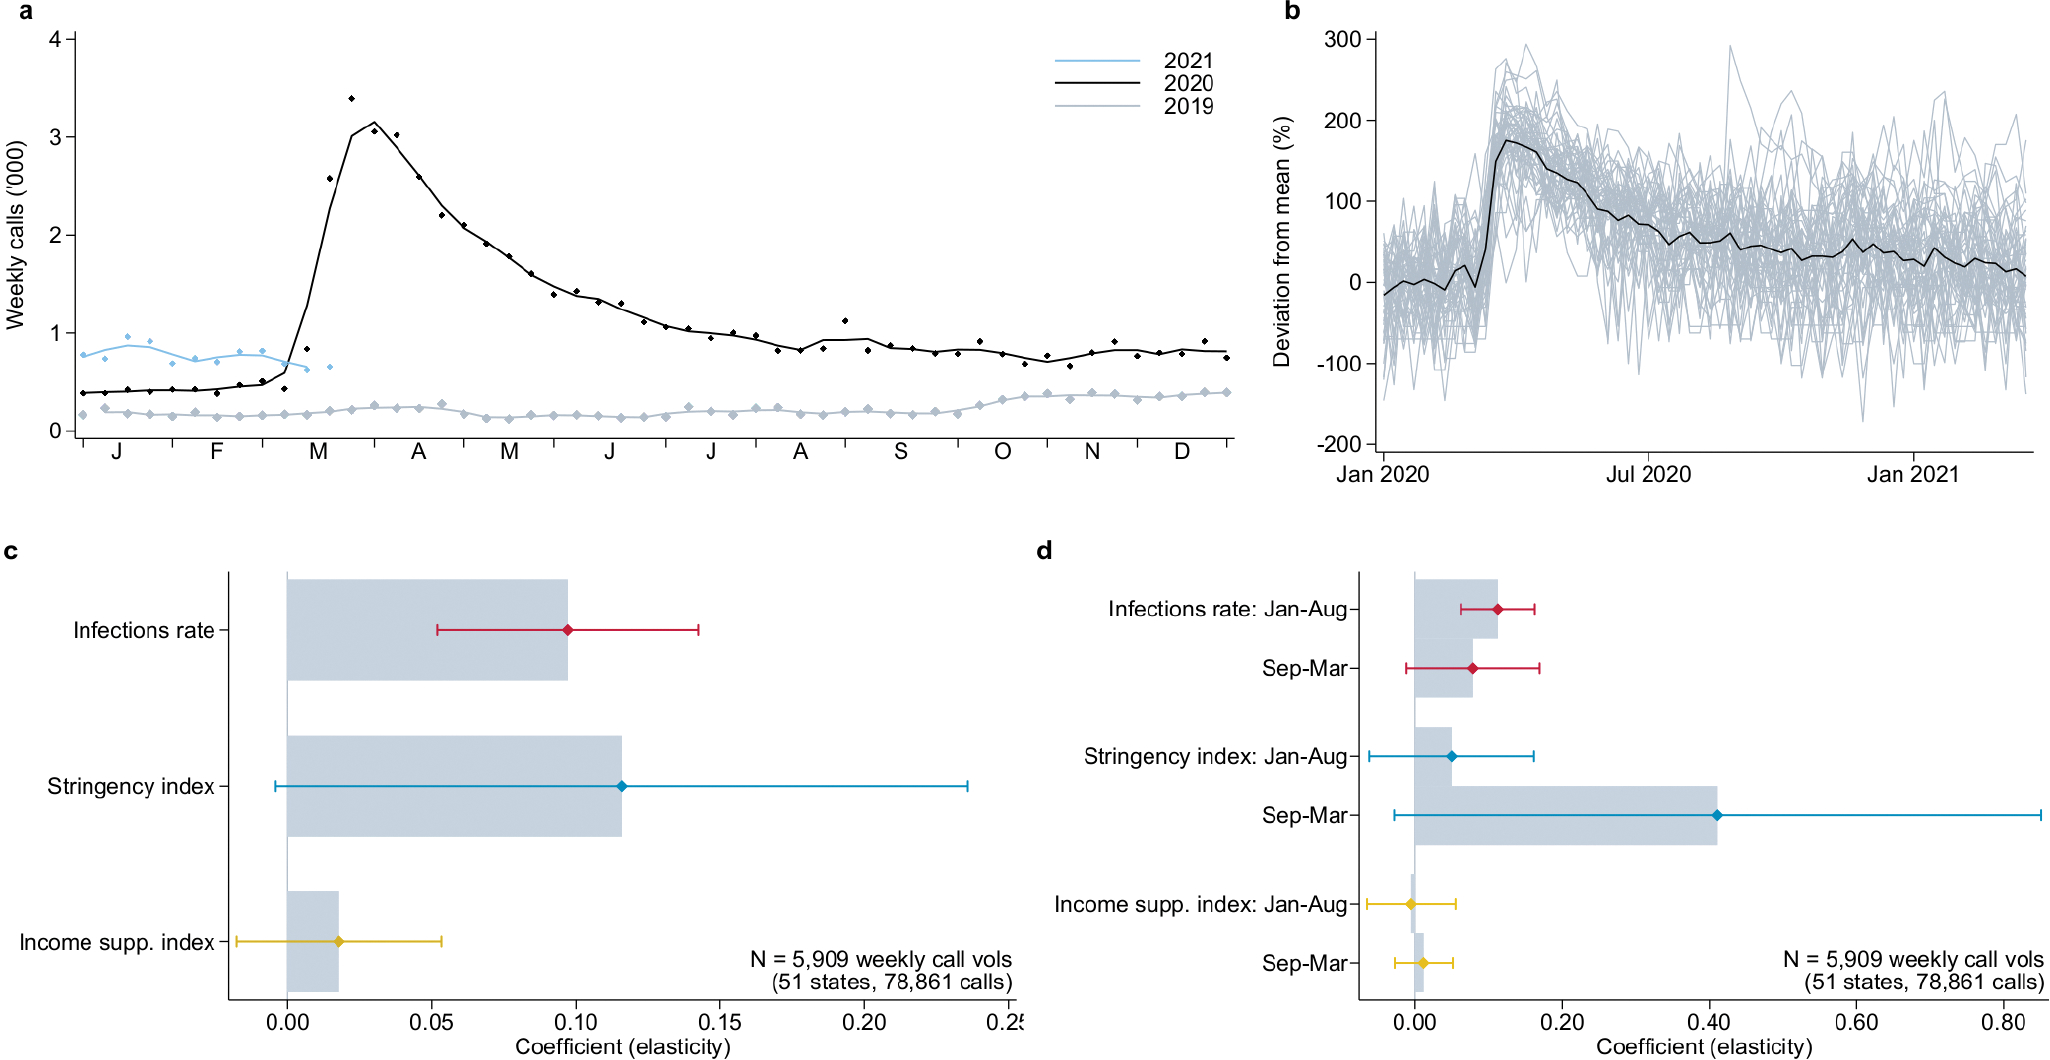
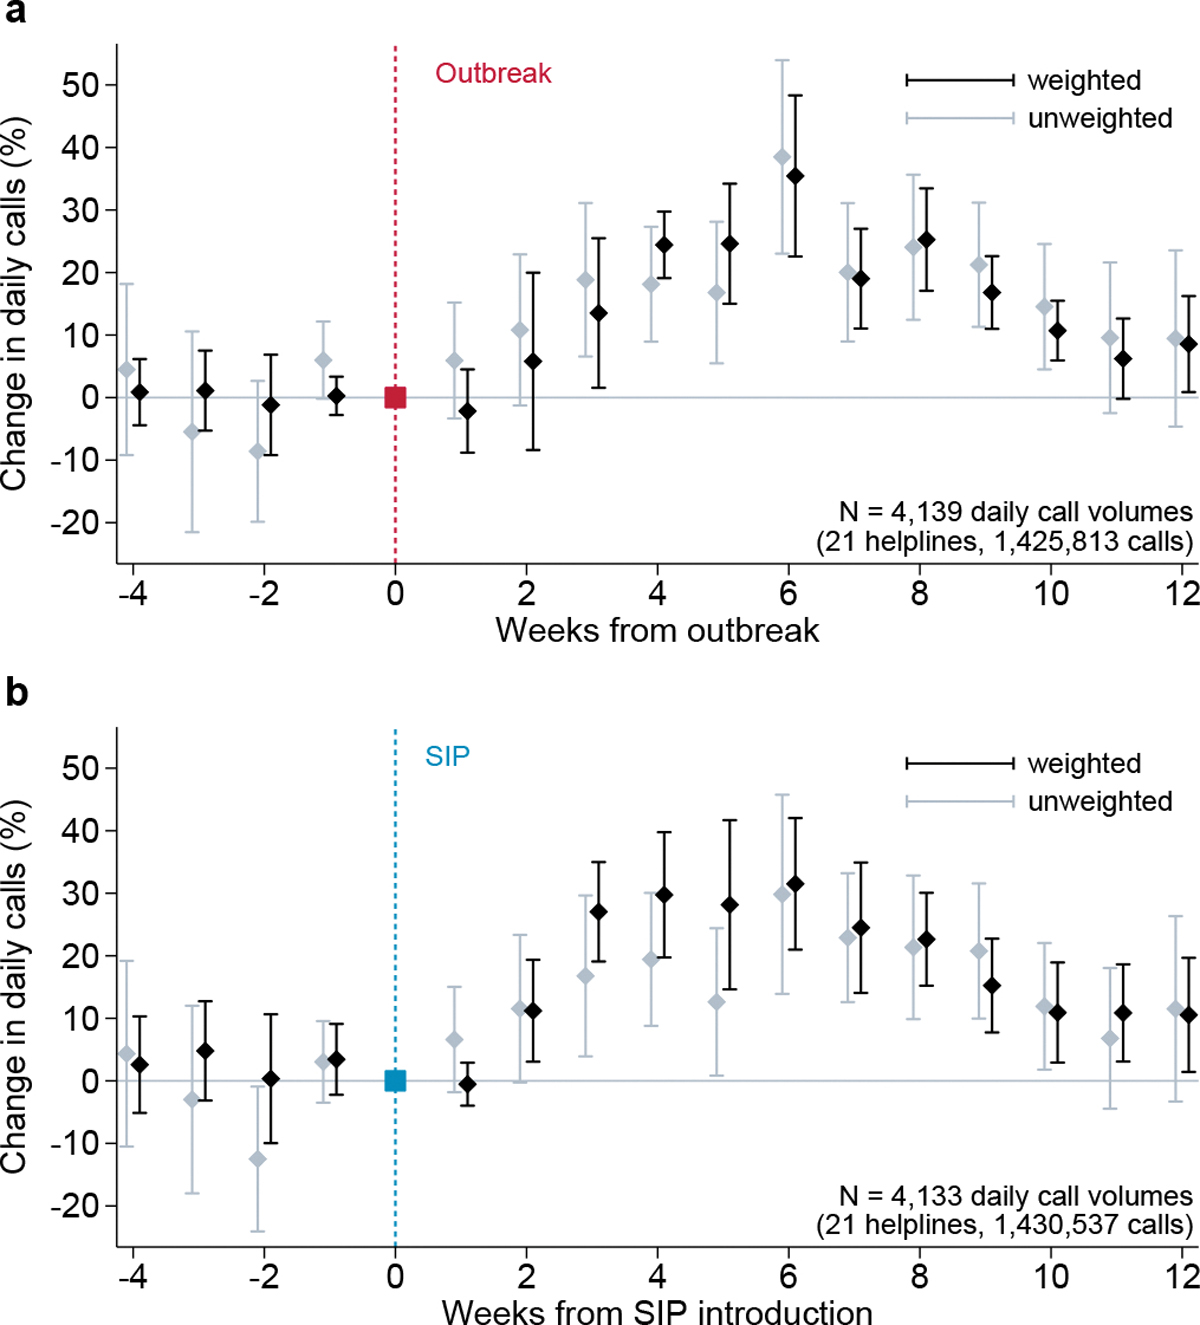
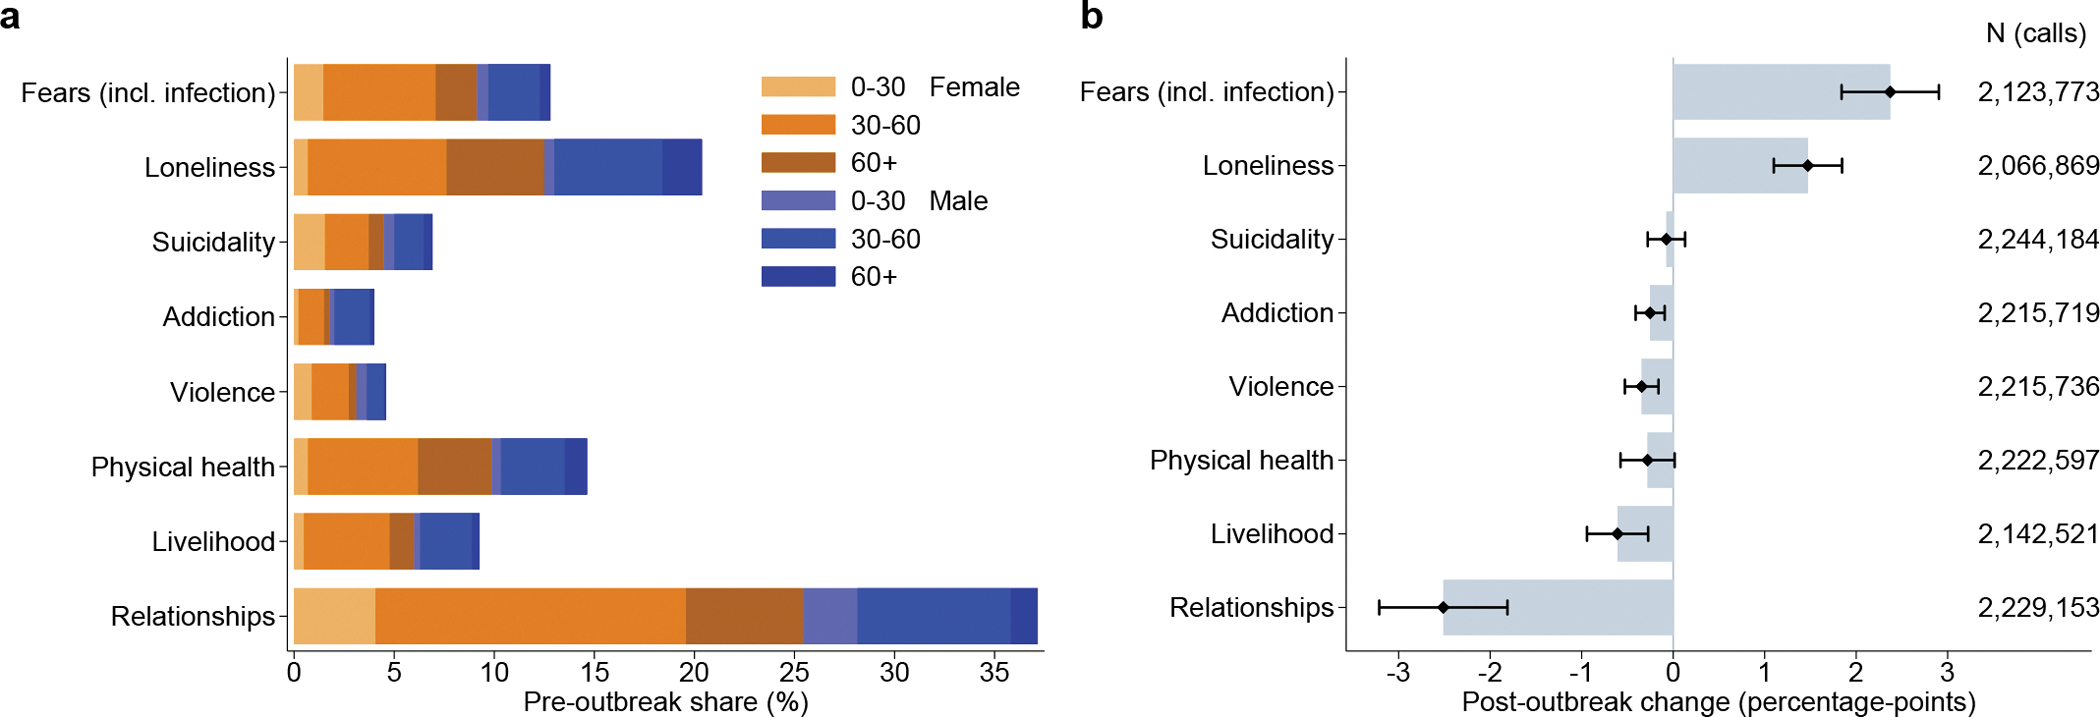
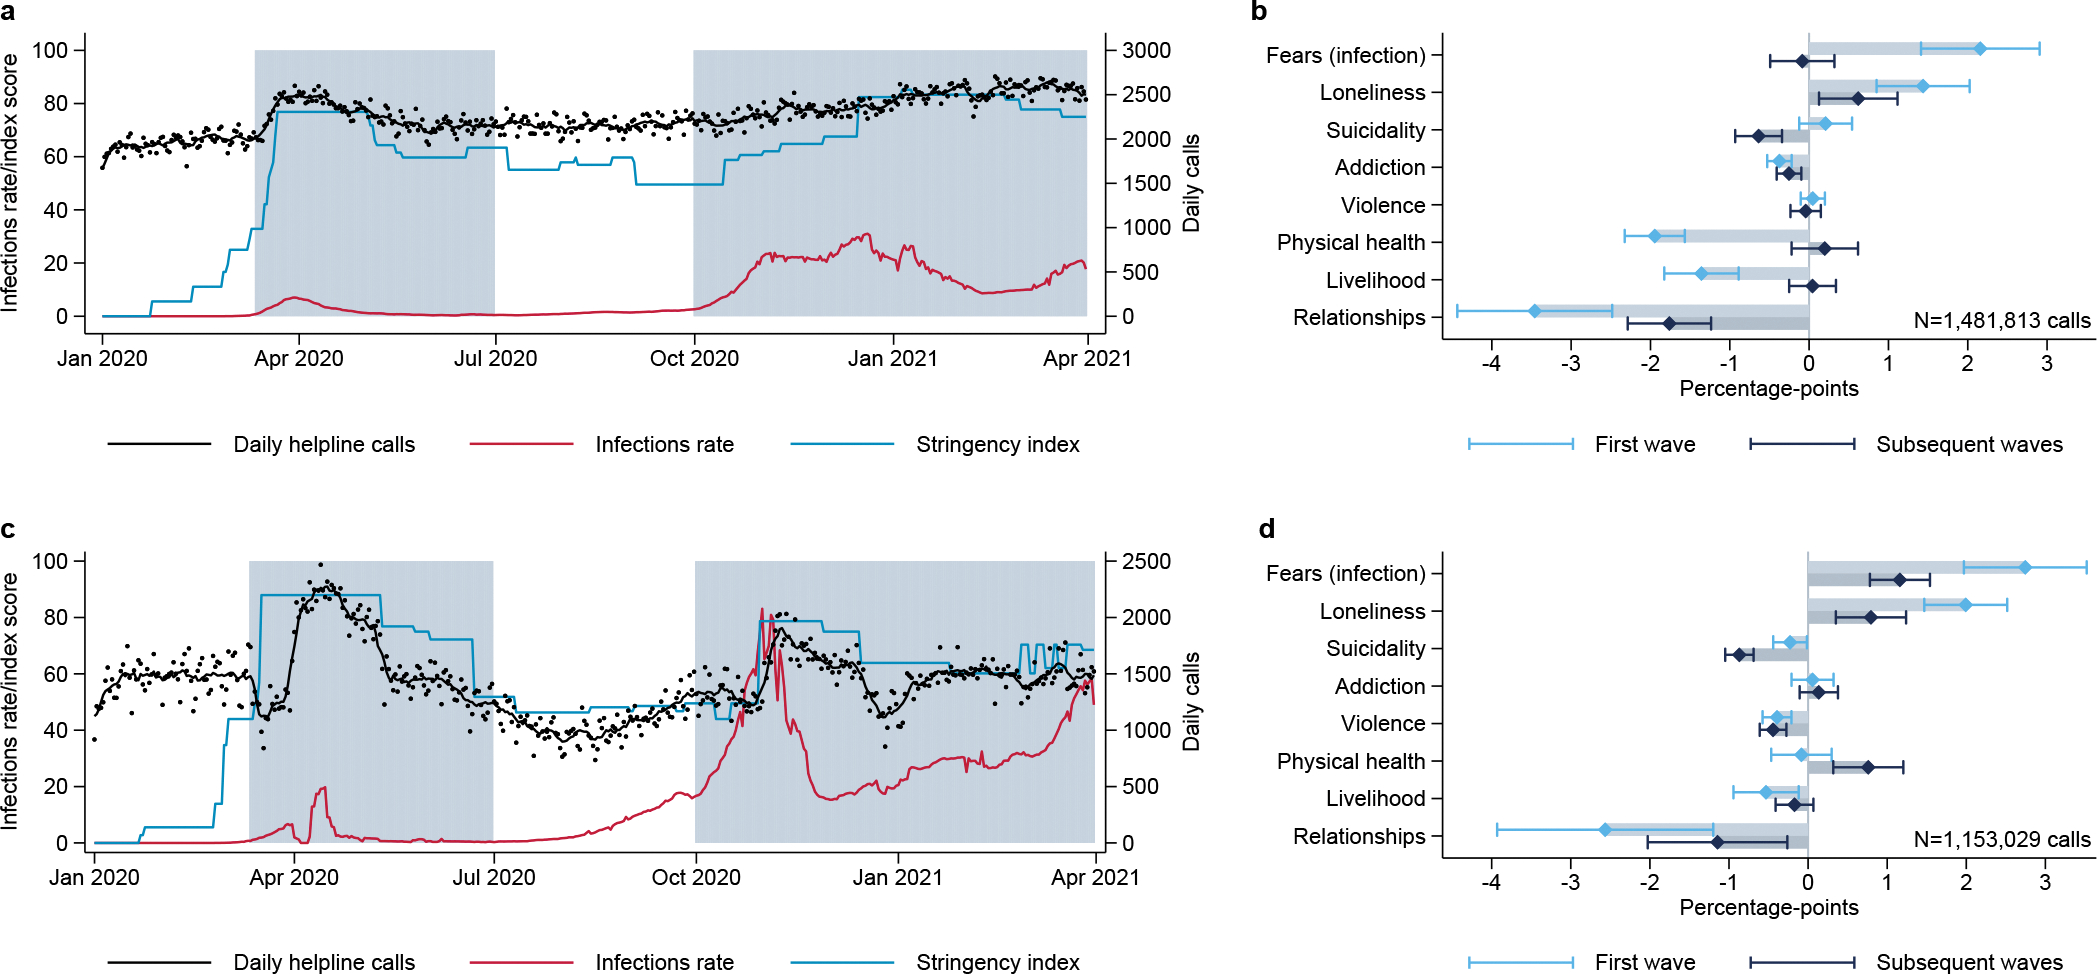
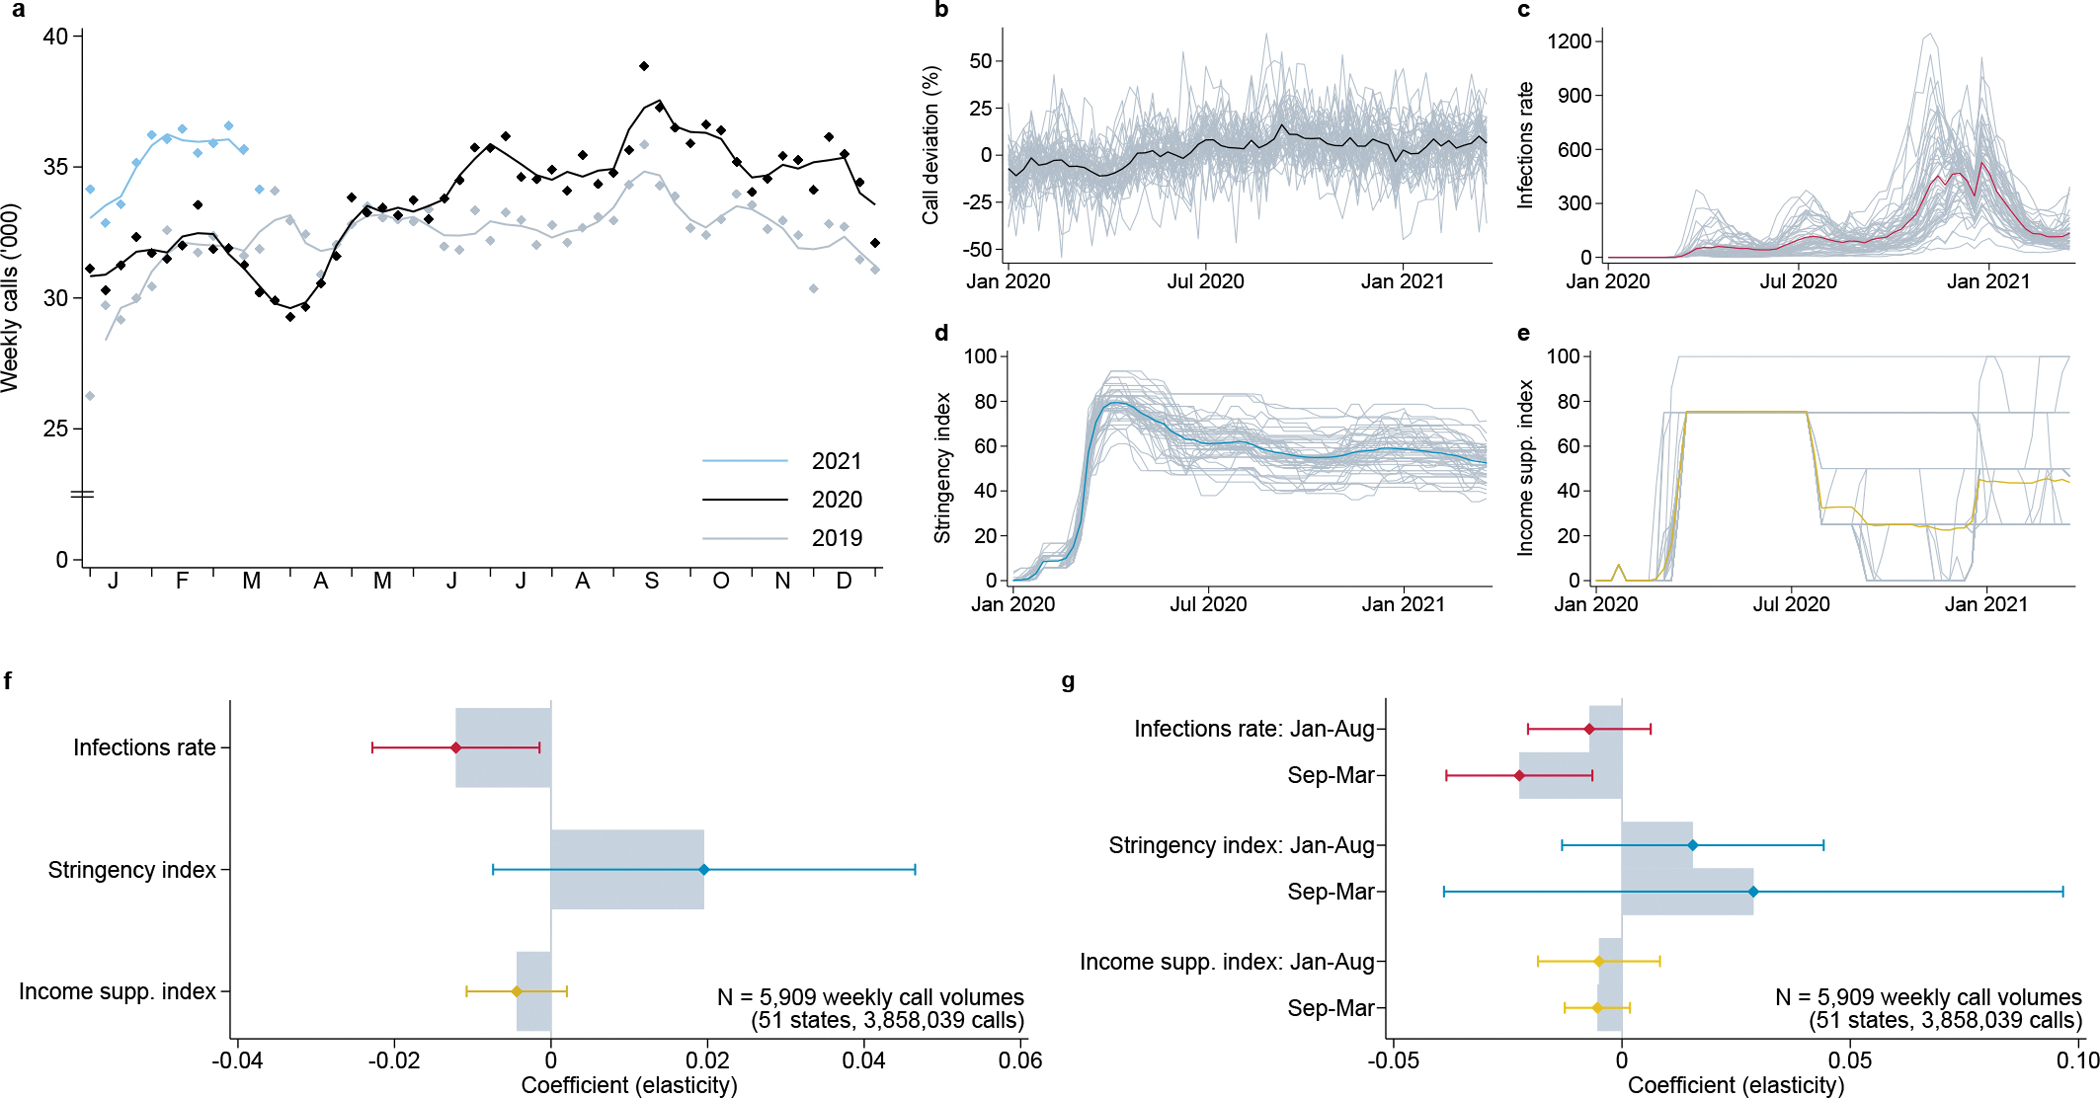
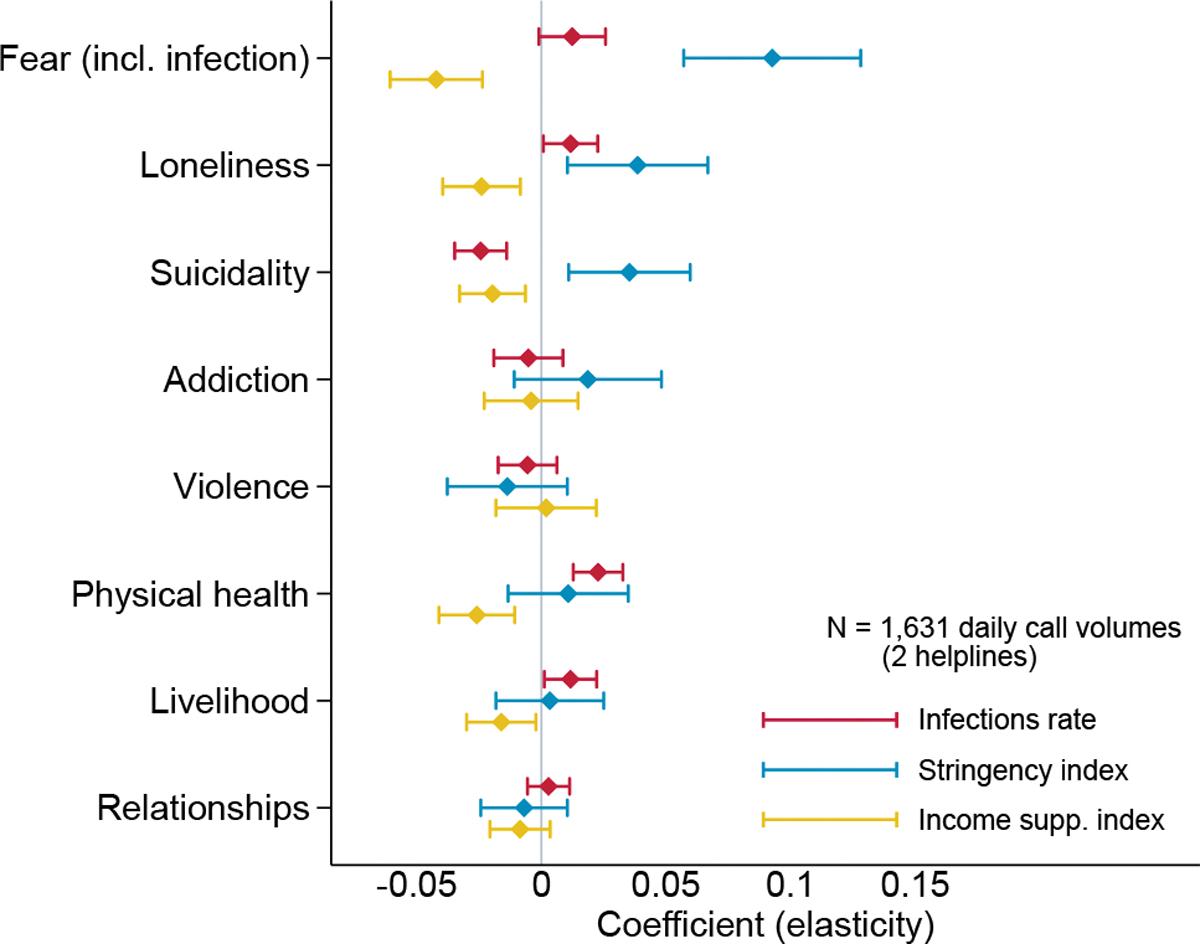
Mental health is an important component of public health, especially in times of crisis. However, monitoring public mental health is difficult because data are often patchy and low-frequency1-3. Here we complement established approaches by using data from helplines, which offer a real-time measure of 'revealed' distress and mental health concerns across a range of topics4-9. We collected data on 8 million calls from 19 countries, focusing on the COVID-19 crisis. Call volumes peaked six weeks after the initial outbreak, at 35% above pre-pandemic levels. The increase was driven mainly by fear (including fear of infection), loneliness and, later in the pandemic, concerns about physical health. Relationship issues, economic problems, violence and suicidal ideation, however, were less prevalent than before the pandemic. This pattern was apparent both during the first wave and during subsequent COVID-19 waves. Issues linked directly to the pandemic therefore seem to have replaced rather than exacerbated underlying anxieties. Conditional on infection rates, suicide-related calls increased when containment policies became more stringent and decreased when income support was extended. This implies that financial relief can allay the distress triggered by lockdown measures and illustrates the insights that can be gleaned from the statistical analysis of helpline data.


Conflict of interest statement

Competing interests The authors declare that they have no competing interests.

Figures

Extended Data Fig. 1:
Extended Data Fig. 1:. Evolution of daily helpline call volumes during the first wave.
Sum of daily helpline contacts with seven-day moving average, January–June 2020 (black) and 2019 (light grey, not available for all helplines). The solid red line shows the date of the pandemic outbreak, when more than 100 SARS-CoV-2 infections per 100,000 population have been recorded, the dashed blue line shows the date when shelter-in-place requirements were first introduced in the country of operation.
Extended Data Fig. 2:
Extended Data Fig. 2:. Conversation topic shares by helpline.
Each cell shows the share of calls related to the conversation topic on the horizontal axis, for calls with the helpline indicated on the vertical axis. Full dataset, covering all calls for which at least on topic was recorded, from 1 January 2019 to the respective end of available data, see Extended Data Table 1a.
Extended Data Fig. 3:
Extended Data Fig. 3:. Magnitude of post-outbreak change and equivalence tests.
a, Coefficient estimates from linear probability models as in Fig.2b, with 95% confidence intervals and equivalence bounds, defined as 5% of the pre-pandemic share of the respective topic, indicated by light blue vertical bars. b, Results from a normalized across conversation topics, with coefficient estimates and associated 95% confidence intervals, and equivalence bounds divided by the pre-pandemic share of calls related to the respective topic. c, Relevance tests, numerical coefficient estimate with corresponding equivalence bounds, with test statistics and p-values from two one-sided tests for equivalence.
Extended Data Fig. 4:
Extended Data Fig. 4:. Change in conversation topics by caller sex and age group.
Estimated coefficients for interaction terms of group indicators with binary post-outbreak variable, and associated 95% confidence intervals. Separate linear probability regression models with dependent variable set to one for calls related to the respective topic, see Methods, equation (3).
Extended Data Fig. 5:
Extended Data Fig. 5:. Non-exclusive conversation topics.
Relation among conversation topics for calls included in the estimation sample underlying Fig. 2, from 1 January 2019 to 30 June 2020, and where sex and age group of callers are observed. a, Distribution of recorded number of conversation topics per call, b, Overlap in conversation topics, where each row shows the distribution of second or further topics (horizontal axis), for calls related to one specific topic (vertical axis). c, Results from Fig. 2b, with alternative estimates based on a restricted sample of single-topic category calls.
Extended Data Fig. 6:
Extended Data Fig. 6:. Disaster Distress Helpline
a, Sum of weekly calls routed to centers by year with 3-week moving average, b, deviation of log calls from state mean (gray), with overall weekly average (black). c, Estimated coefficients and associated 95% confidence intervals. Sub-national panel model including state and week fixed effects. Dependent variable is ln(Disaster Distress calls+1), and independent variables are measured in logs as well; see Methods, equation (5).d, Coefficient estimates for interaction terms with indicators for the two periods from January–August 2020 and September 2020–March 2021, and associated 95% confidence intervals; see Methods, equation (6).
Fig. 1:
Fig. 1:. Evolution of total helpline call numbers during the first wave.
Estimated coefficients on week indicators with 95% confidence intervals. The dependent variable is ln(helpline calls+1). The sample includes daily data for 21 helplines during the period from 4 weeks before to 12 weeks after the event date in early 2020, and, for 17 of the 21 helplines, the corresponding days of 2019. Average percentage change in call volumes relative to reference week 0. Week 0 is when, a, the cumulative number of SARS-CoV-2 infections exceeded 1 per 100,000 population, or, b, shelter-in-place orders were introduced. Results on data weighted by total number of calls recorded for each helpline during the sample period (black); and unweighted models (gray); see Methods, equation (1).
Fig. 2:
Fig. 2:. Conversation topics during the first COVID-19 wave.
a, Pre-pandemic shares of main non-exclusive conversation topics by sex and age group, before 1/100,000 SARS-CoV-2 infections/population were recorded. b, Estimated coefficients for binary post-outbreak indicator variable with 95% confidence intervals. Separate linear probability regression models with dependent variable set to one for calls related to the respective topic, see Methods, equation (2).
Fig. 3:
Fig. 3:. Helpline calls in Germany and France during the first and subsequent waves.
a, c, Sum of daily helpline calls with seven-day moving average in black (right axis), government response stringency index in blue, and seven-day moving average of newly confirmed SARS-CoV-2 infections per million population and day in red (left axis), for a, Germany (Telefonseelsorge) and c, France (S.O.S. Amitié). Shaded areas indicate first- and subsequent-wave periods (11 March 2020–30 June 2020, and 1 October 2020–31 March 2021). b, d, Estimated coefficients for binary variables denoting the two periods, and their associated 95% confidence intervals, for b, Germany (Telefonseelsorge) and d, France (S.O.S. Amitié), based on separate linear probability regression models with dependent variable set to one for calls related to the respective topic; see Methods, equation (4).
Fig. 4:
Fig. 4:. Lifeline calls, COVID-19, and policy measures in the United States.
a, Overall sum of weekly calls routed to Lifeline centers by year, with 3-week moving average. b, Deviation of log calls from the state mean in gray, overall weekly average in black. Weekly average scores, with individual state values in gray, for c, newly confirmed SARS-CoV-2 infections per 100,000 population, d, government response stringency index, and e, income support index. f, Estimated coefficients and associated 95% confidence intervals. Sub-national panel model including state and week fixed effects. Dependent variable is ln(Lifeline calls+1), and independent variables are measured in logs as well; see Methods, equation (5). g, Coefficient estimates for interaction terms with indicators for the two periods from January–August 2020 and September 2020–March 2021, and associated 95% confidence intervals; see Methods, equation (6).
Fig. 5:
Fig. 5:. Daily calls by conversation topic, COVID-19, and policy in Germany and France.
Coefficients from separate regression models by topic with 95% confidence intervals. Dependent variable is ln(calls+1), and independent variables are measured in logs as well,. The sample includes all calls to Telefonseelsorge (Germany) and S.O.S. Amitié (France) for which at least one conversation topic was recorded, aggregated to daily totals from January 1, 2019 to March 31, 2021; see Methods, equation (7).

Comment in

References

    1. United Nations (UN). COVID-19 and the need for action on mental health. UN Sustainable Development Group Policy Brief (2020). https://unsdg.un.org/resources/policy-brief-covid-19-and-need-action-men....
    1. OECD. Tackling the mental health impact of the COVID-19 crisis: An integrated, whole-of-society response. OECD Policy Responses to Coronavirus (COVID-19) (2021). 10.1787/0ccafa0b-en. - DOI
    1. Rehm J & Shield KD Global burden of disease and the impact of mental and addictive disorders. Current Psychiatry Reports 21 (2019). 10.1007/s11920-019-0997-0. - DOI - PubMed
    1. Leach LS & Christensen H A systematic review of telephone-based interventions for mental disorders. Journal of Telemedicine and Telecare 12, 122–129 (2006). 10.1258/135763306776738558. - DOI - PubMed
    1. Coveney CM, Pollock K, Armstrong S & Moore J Callers’ experiences of contacting a national suicide prevention helpline. Crisis 33, 313–324 (2012). 10.1027/0227-5910/a000151. - DOI - PMC - PubMed

Publication types

Supplementary concepts