. 2021 Dec;600(7887):170-175.
doi: 10.1038/s41586-021-04126-6. Epub 2021 Nov 17.

Structure, function and pharmacology of human itch GPCRs

Affiliations

Structure, function and pharmacology of human itch GPCRs

Can Cao et al. Nature. 2021 Dec.

Abstract

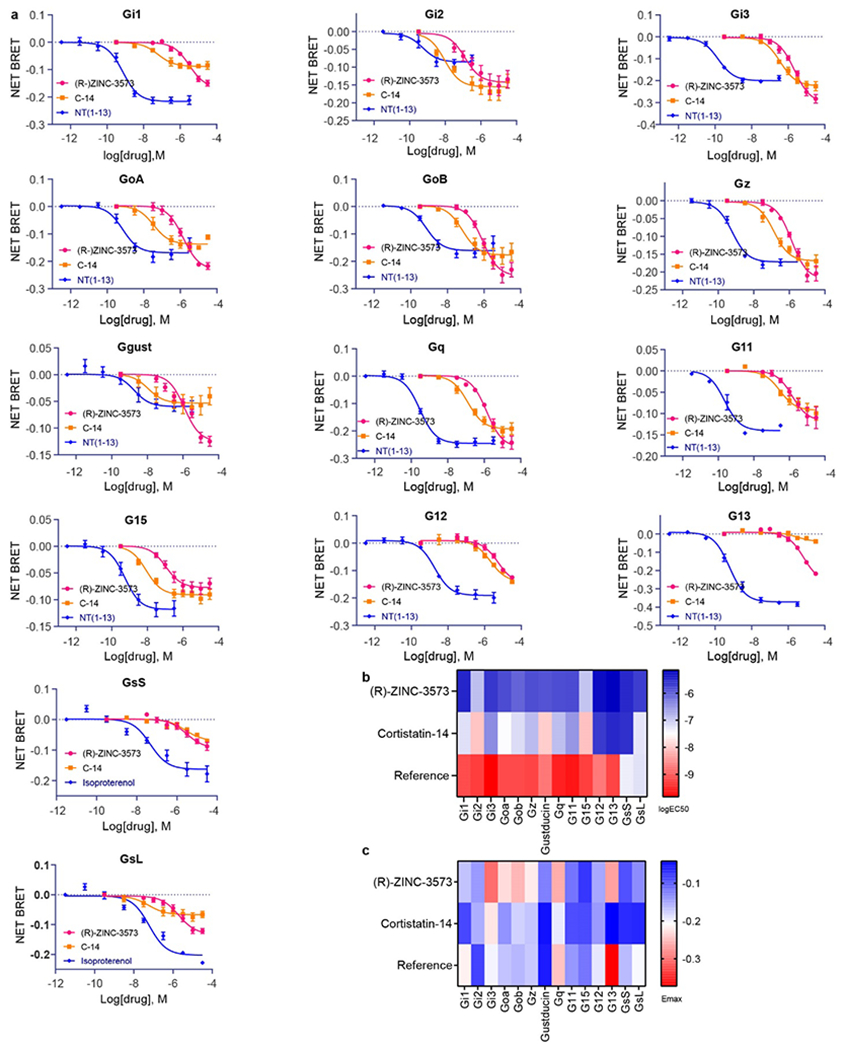
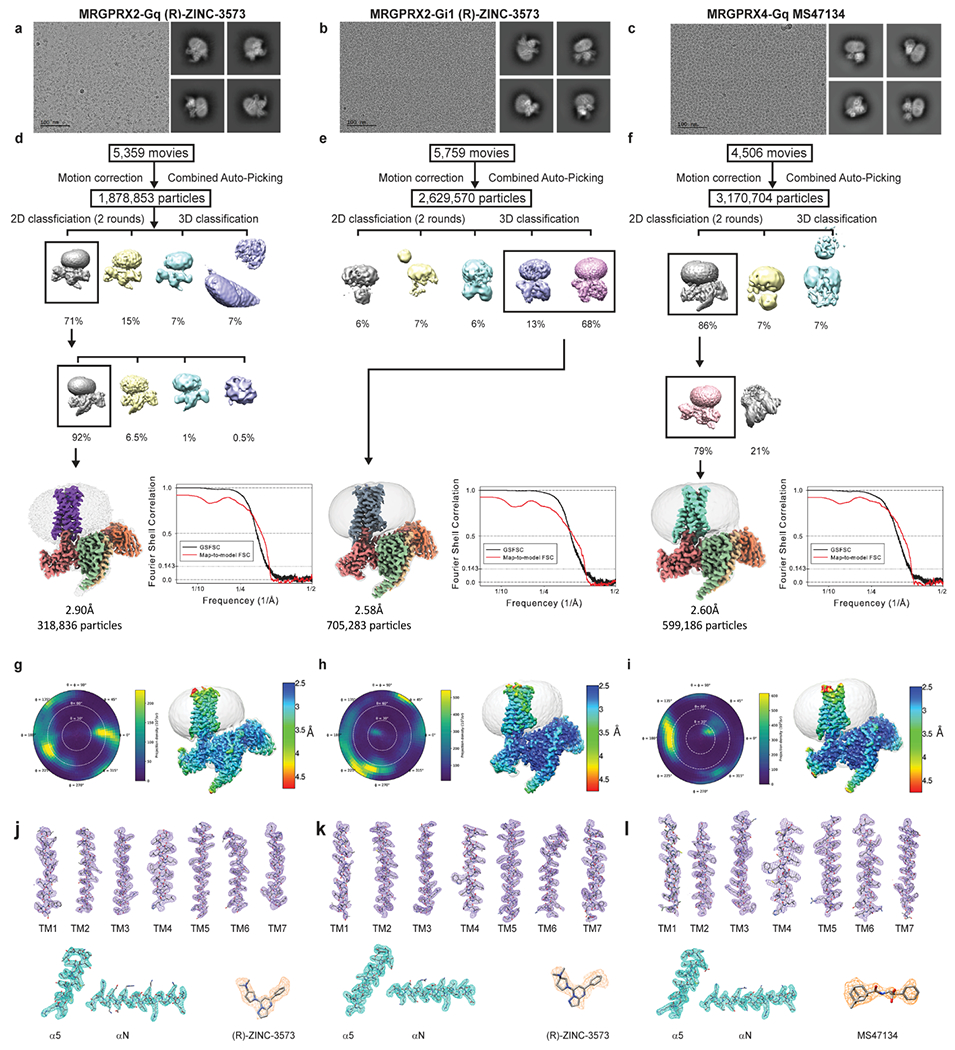
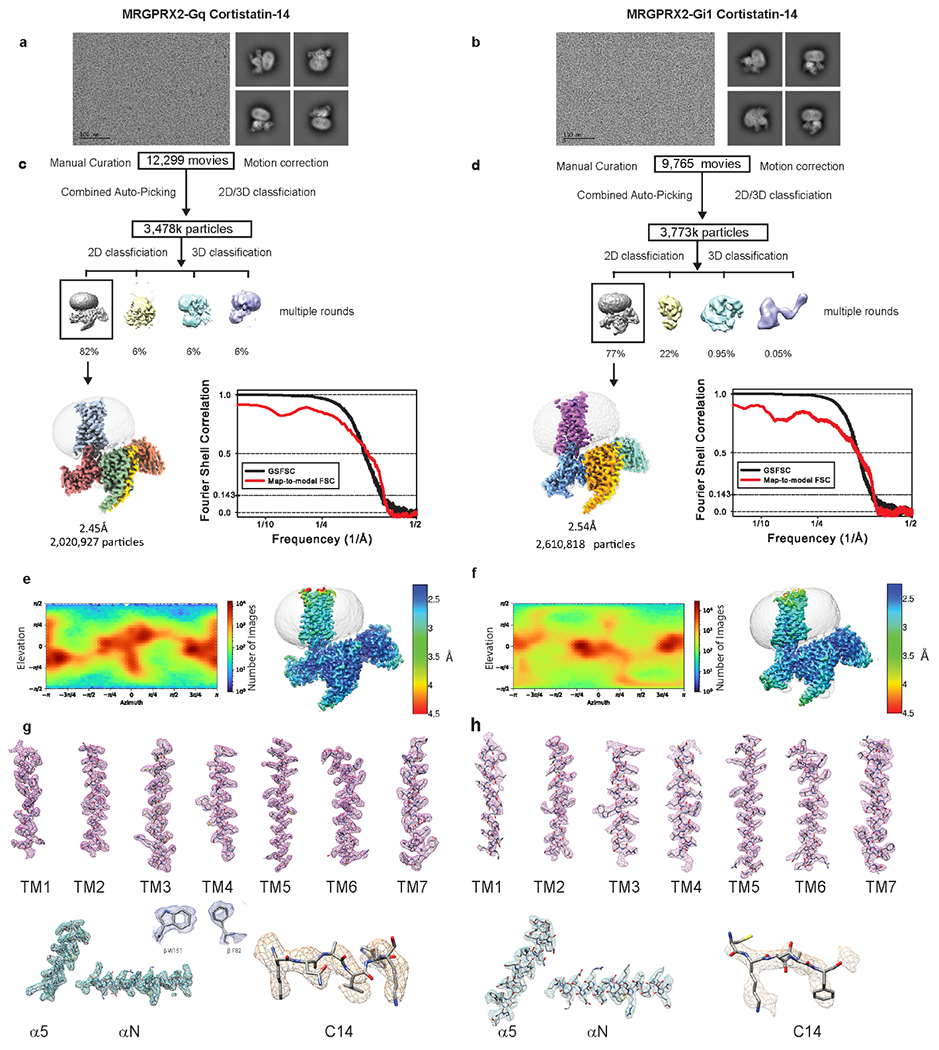
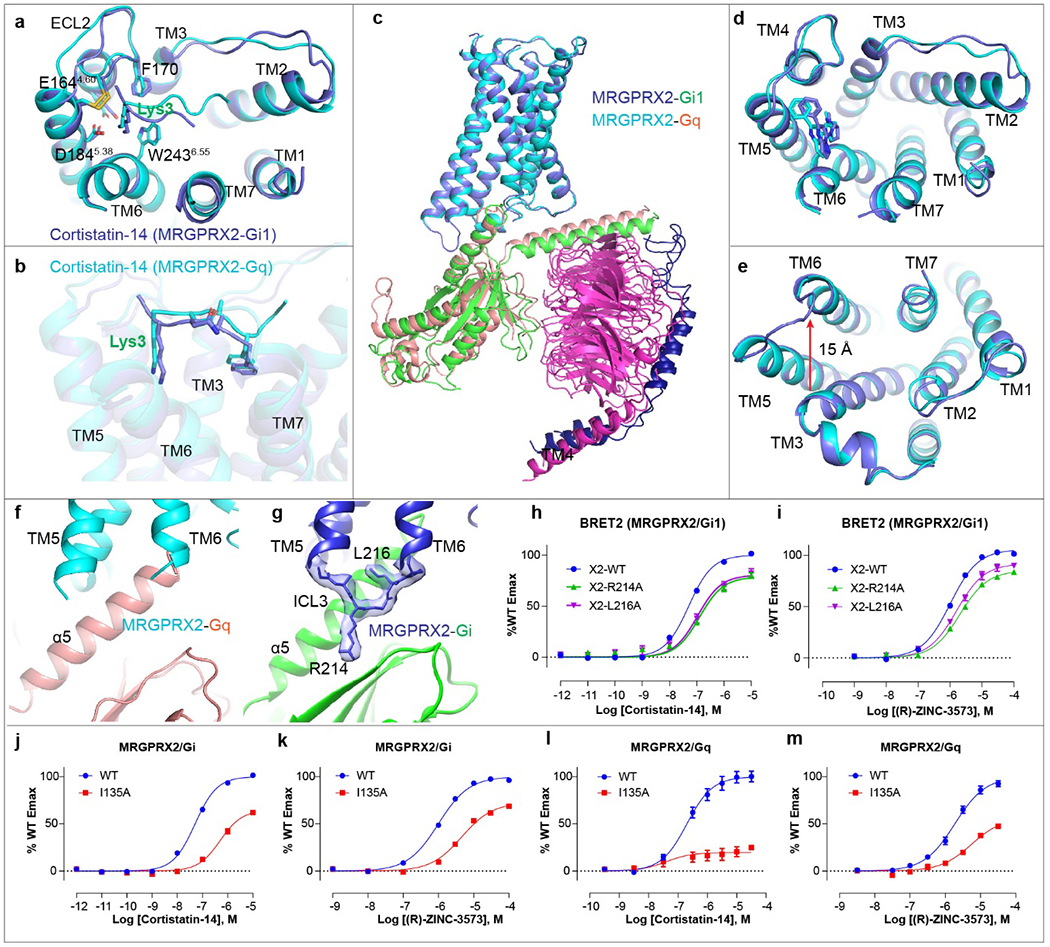
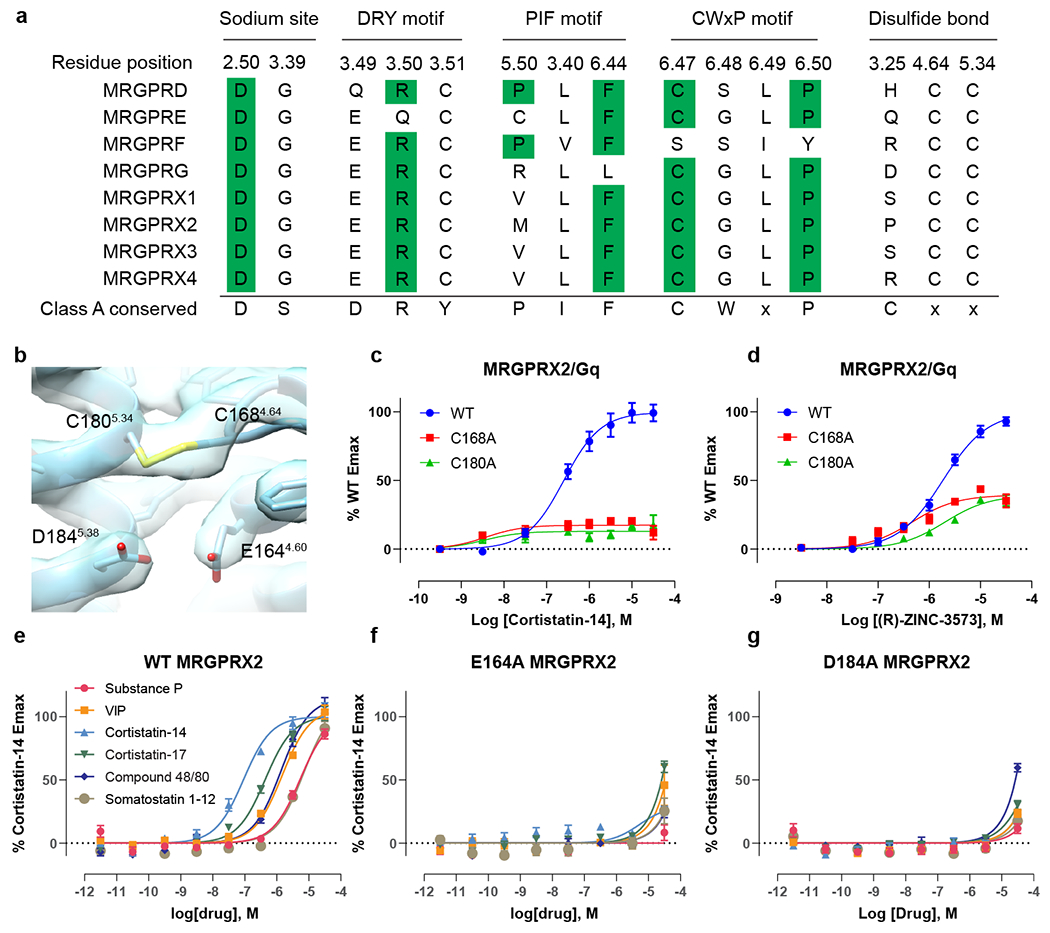
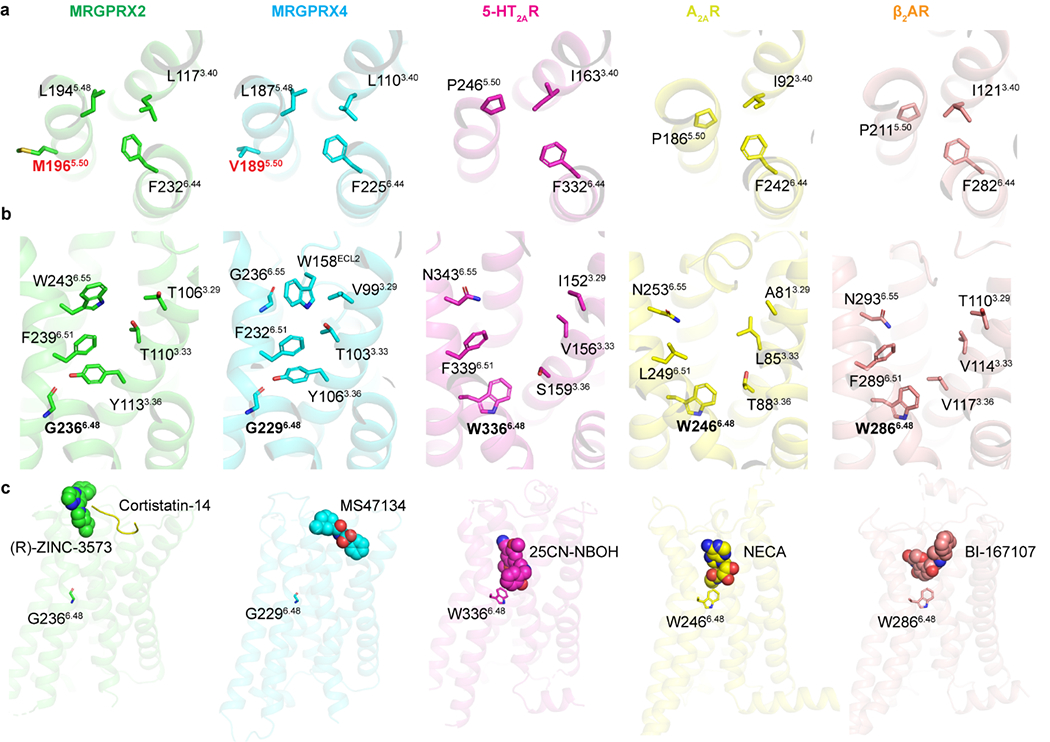
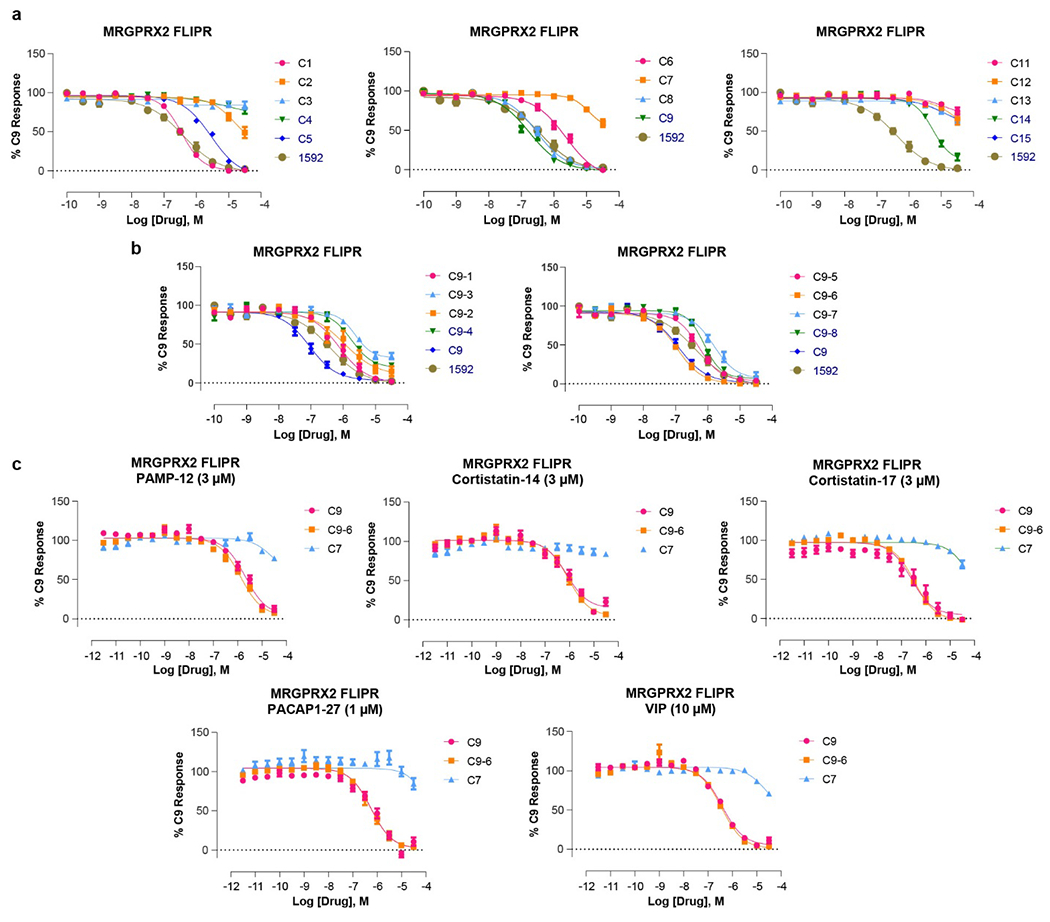
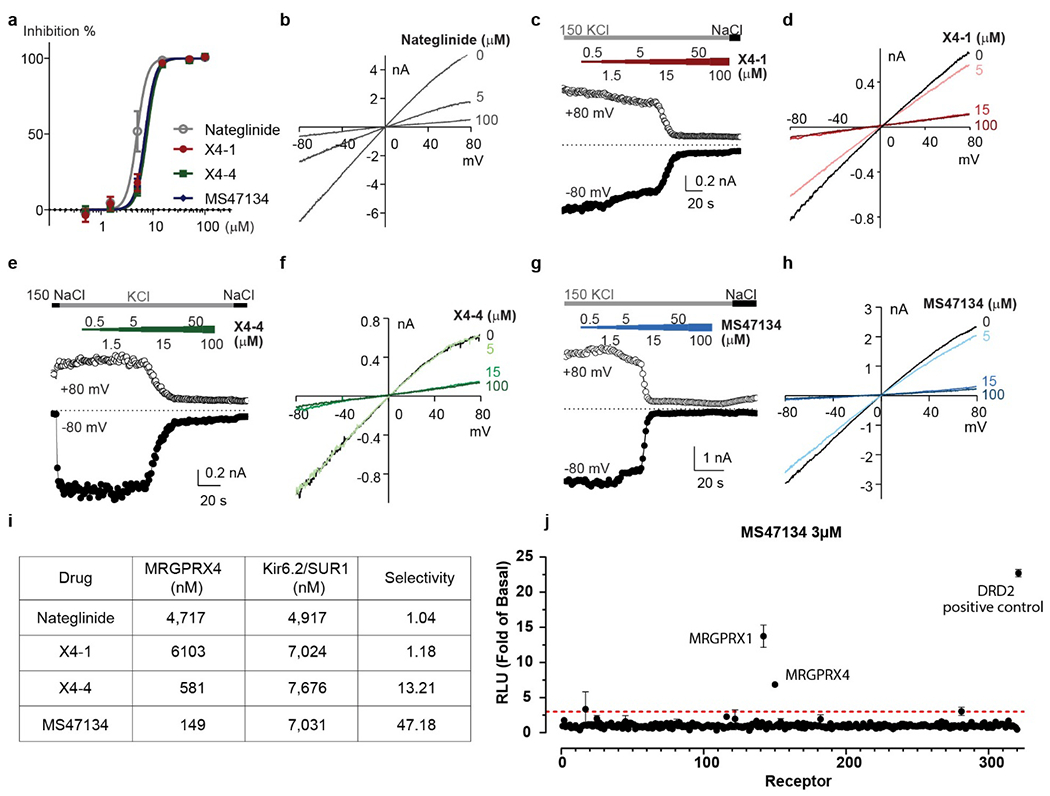
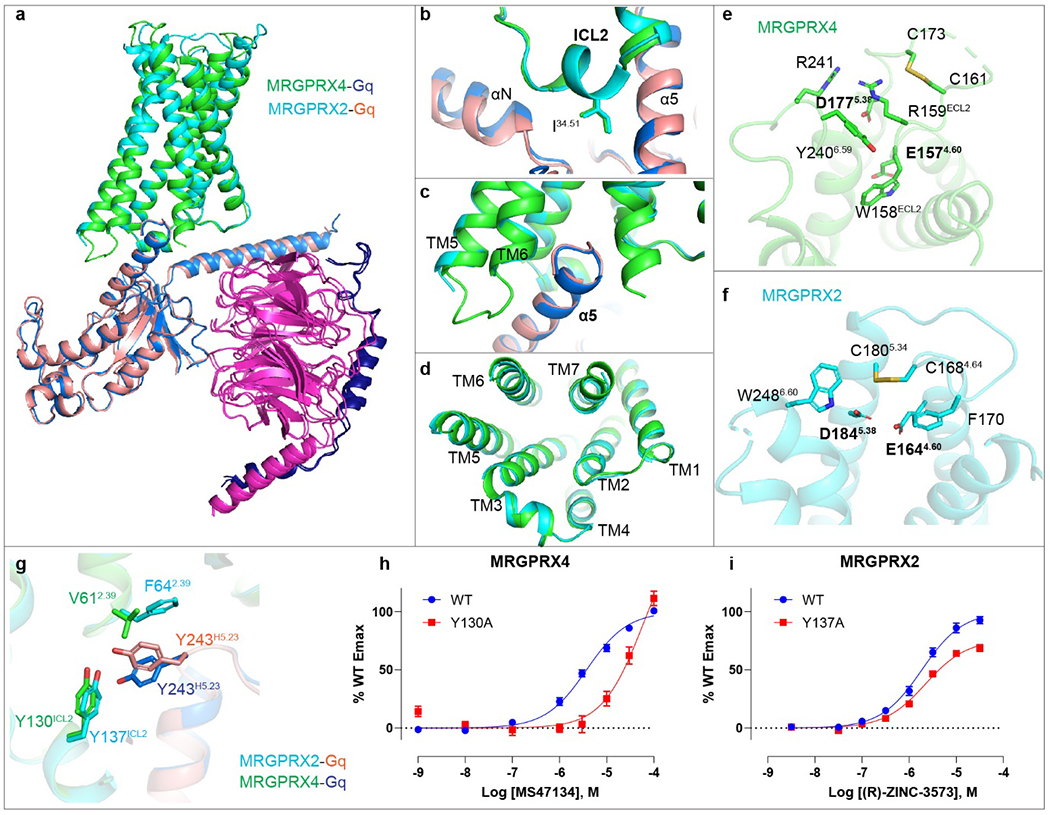
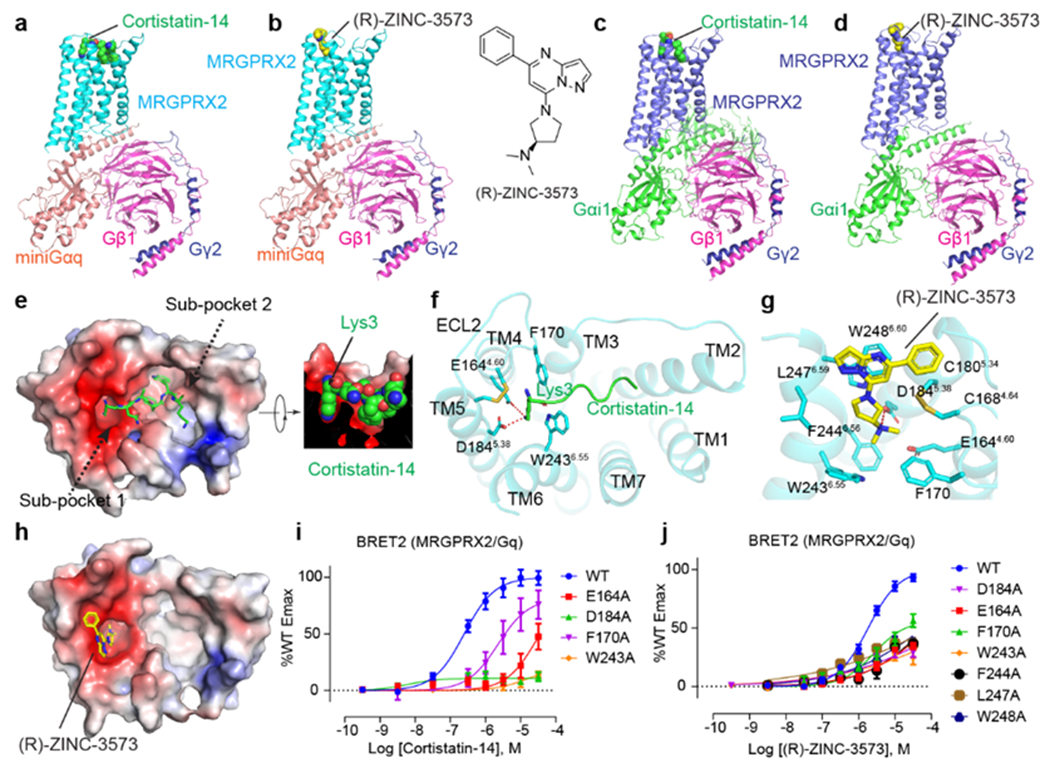
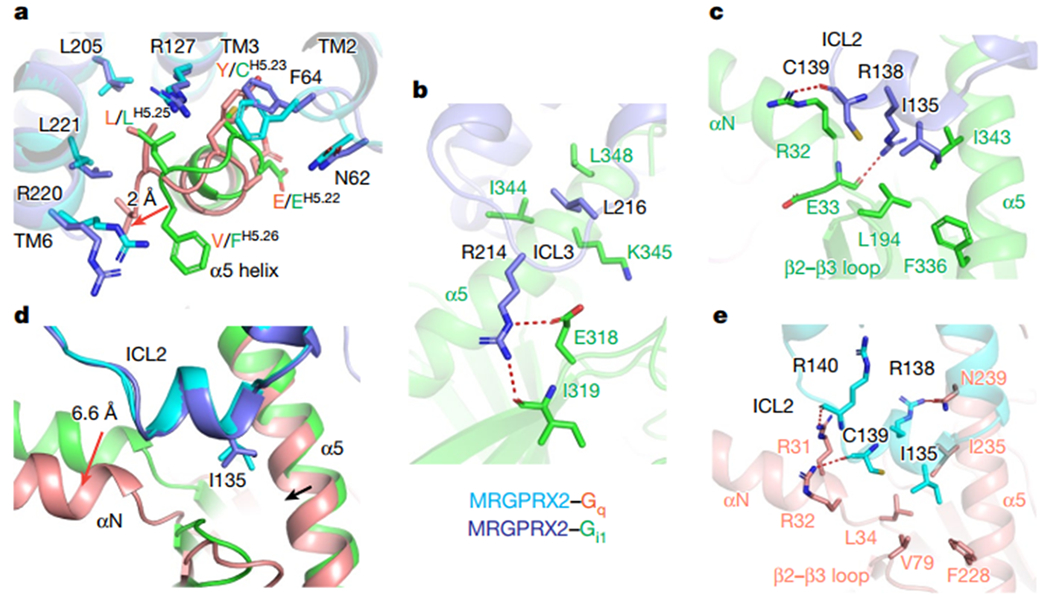
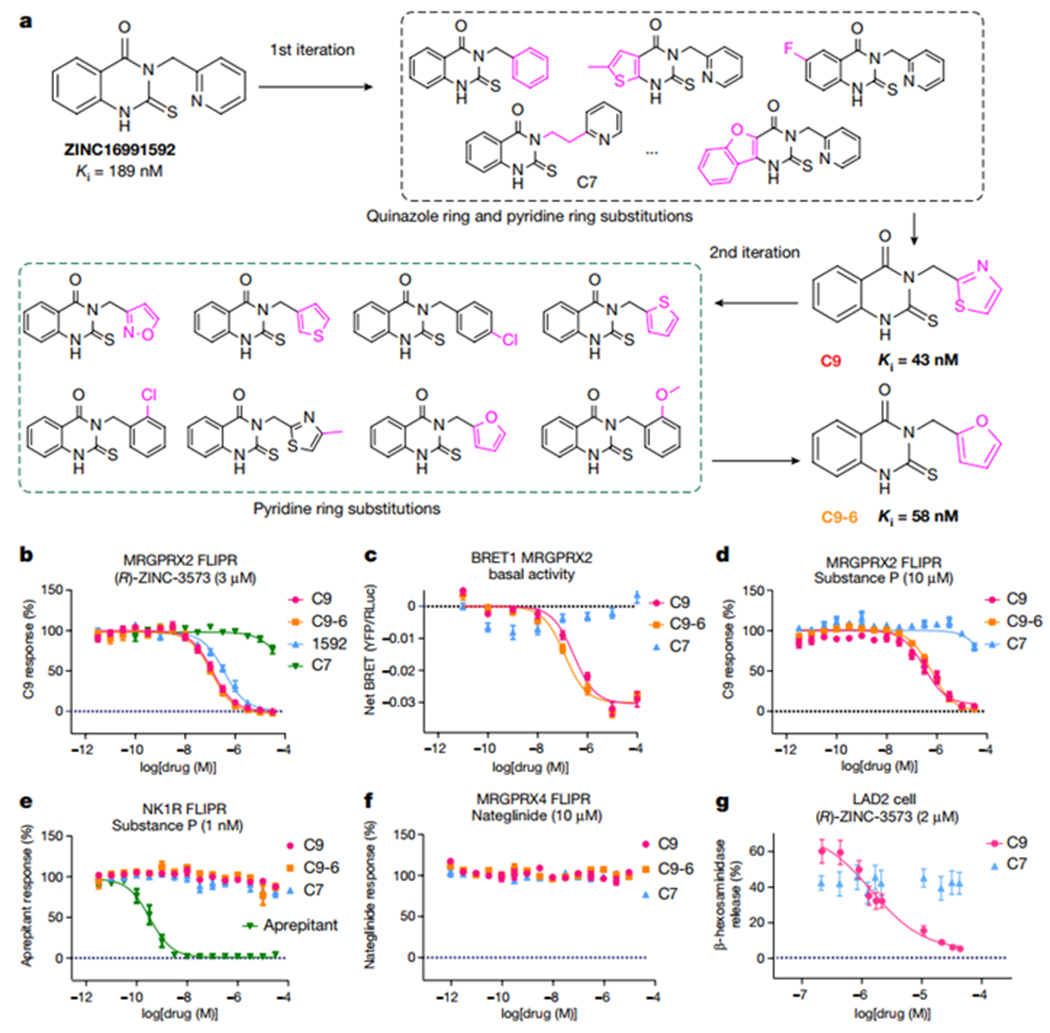
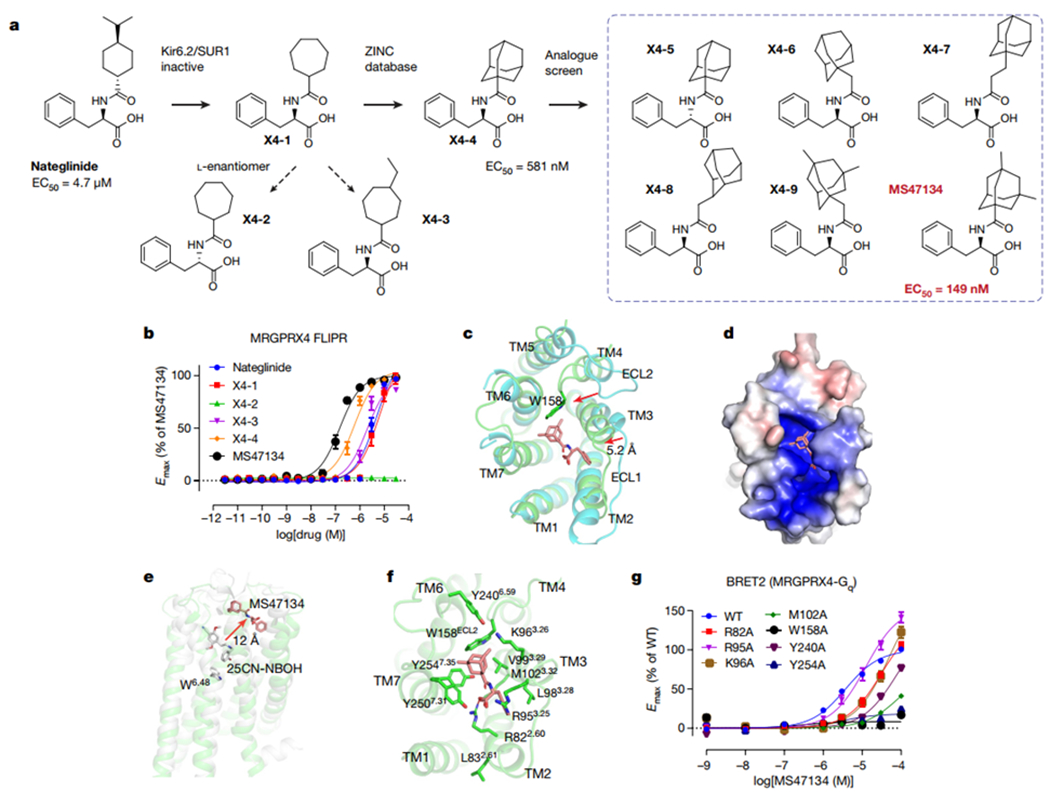
The MRGPRX family of receptors (MRGPRX1-4) is a family of mas-related G-protein-coupled receptors that have evolved relatively recently1. Of these, MRGPRX2 and MRGPRX4 are key physiological and pathological mediators of itch and related mast cell-mediated hypersensitivity reactions2-5. MRGPRX2 couples to both Gi and Gq in mast cells6. Here we describe agonist-stabilized structures of MRGPRX2 coupled to Gi1 and Gq in ternary complexes with the endogenous peptide cortistatin-14 and with a synthetic agonist probe, respectively, and the development of potent antagonist probes for MRGPRX2. We also describe a specific MRGPRX4 agonist and the structure of this agonist in a complex with MRGPRX4 and Gq. Together, these findings should accelerate the structure-guided discovery of therapeutic agents for pain, itch and mast cell-mediated hypersensitivity.


Conflict of interest statement

Competing interests

A patent describing the MRGPRX2 antagonists has been filed by UCSF listing B.L.R., B.K.S., C.C., I.S., and H.J.K. as inventors.

Figures

Extended Data Fig. 1 |
Extended Data Fig. 1 |. MRGPRX2 transducerome screening using TRUPATH.
a, MRGPRX2 effectively couples to 14 distinct G proteins upon stimulation of agonists (R)-ZINC-3573 and cortistatin-14 (C-14) in HEK293T cells. Net BRET values of MRGPRX2 together with positive controls of either neurotensin-1 receptor (NTSR1, agonist NT1-13) or β2AR (agonist isoproterenol) are shown in each panel. Data represent mean ± SEM of n = 3 biological replicates. b, Heatmap of the relative potency (logEC50) of (R)-ZINC-3573 and cortistatin-14 for 14 distinct G proteins. c, Heatmap of the relative efficacy (Emax) of (R)-ZINC-3573 and cortistatin-14 for 14 distinct G proteins.
Extended Data Fig. 2 |
Extended Data Fig. 2 |. CryoEM images and data-processing of MRGPRX2-Gq-(R)-ZINC-3573, MRGPRX2-Gi-(R)-ZINC-3573 and MRGPRX4-Gq-MS47134 complex.
a-c, Representative motion corrected cryo-EM micrographs (scale bar, 100 nm) of respective ligand bound GPCR heterotrimeric complex particles imaged at a nominal 45k x magnification and representative two-dimensional class averages. The experiment was repeated three times with similar result. The exact number of movies and particles used for each complex are shown in the flow chart. d-f, Flow chart of cryo-EM data processing, GSFSC plot of auto-masked final map (black) and map-to-model real-space cross correlation (red) as calculated form phenix.mtriage. g-i, Respective polar plots of particle angular distributions and local resolution estimations heat maps. j-l, Local cryo-EM density maps of TM1-7, respective ligands, and α5 and αN helix of respective G-protein.
Extended Data Fig. 3 |
Extended Data Fig. 3 |. CryoEM images and data-processing of MRGPRX2-Gq-Cortistatin-14 and MRGPRX2-Gi1-Cortistatin-14 complex.
a-b, Representative motion corrected cryo-EM micrograph (scale bar, 100 nm) of MRGPRX2 G-protein cortistatin-14 (C14) particles imaged at a nominal 45k x magnification and representative two-dimensional class averages. The experiment was repeated three times with similar result. The exact number of movies and particles used for each complex are shown in the flow chart. c-d, Flow chart of cryo-EM data processing. GSFSC plot of auto-masked final map (black) and map-to-model real-space cross correlation (red) as calculated form phenix.mtriage. e-f, Viewing direction distribution and local resolution estimation heat maps. g-h, Local cryo-EM density maps of TM1-7, Cortistatin-14 ligand, α5 and α N helix of respective G-protein. Also shown inset are residues W151 and F82 of the b-subunit (blue).
Extended Data Fig. 4 |
Extended Data Fig. 4 |. Structural comparison of Gq- and Gi-coupled MRGPRX2 complex.
a-b, Structural comparison of the MRGPRX2-Gi1-cortistatin-14 complex (blue) with MRGPRX2-Gq-cortistatin-14 complex (cyan). Top view for the key interactions in sub-pocket 1 (a). Side view to show the overall conformational of cortistatin-14 (b). c-e, structural comparison of MRGPRX2-Gi1-(R)-ZINC-3573 complex with MRGPRX2-Gq-(R)-ZINC-3573 complex. Gi1 and Gq are shown in green and salmon, respectively. Gi1 coupled MRGPRX2 and Gq coupled MRGPRX2 are shown in blue and cyan, respectively. Side view of the whole complex (c), top view (d) and bottom view (e) of MRGPRX2. f, ICL3 of Gq is not clearly resolved in the Gq-coupled MRGPRX2 complex. g, Close up view of the ICL3 in the Gi1-coupled MRGPRX2 structure with surrounding EM map at a threshold of 0.14. h-i, MRGPRX2 ICL3 mutations R214ICL3A and L216ICL3A impairs cortistatin-14 (h) and (R)-ZINC-3573 (i) stimulated Gi1 activation. Data represent mean ± SEM of n = 3 biological replicates. j-k, BRET2 Gi assays reveal that I135ICL2A mutation of MRGPRX2 attenuate cortistatin-14 (j) and (R)-ZINC-3573 (k) stimulated Gi1 activation. Data represent mean ± SEM of n = 3 biological replicates. l-m, BRET2 Gq assays reveal that I135ICL2A mutation of MRGPRX2 greatly reduced cortistatin-14 (l) and (R)-ZINC-3573 (m) stimulated Gq activation. Data represent mean ± SEM of n = 3 biological replicates.
Extended Data Fig. 5 |
Extended Data Fig. 5 |. Non-conserved motifs in Mas-related GPCRs and the critical role of acidic residues E1644.60 and D1845.38 in MRGPRX2 activation.
a, Sequence alignment of the key residues in sodium site, DRY motif, PIF motif and CWxP motif, as well as residues involved in disulfide bond formation in Mas-related GPCRs. Class A conserved residues are highlighted in green. b, cryoEM map of the TM4-TM5 disulfide bond in MRGPRX2-Gq-(R)-ZINC-3573 complex. c-d, Break of the TM4-TM5 disulfide bond by C1684.64A and C1805.34A mutations abolishes the cortistatin-14 stimulated Gq activation (c) and reduced the Emax of (R)-ZINC-3573 stimulated Gq activation by 60% (d). Data represent mean ± SEM of n = 3 biological replicates. e-g, Compared with WT (e), E1644.60A (f) and D1845.38A (g) totally abolish the peptide stimulated Gq activation of MRGPRX2. Data represent mean ± SEM of n = 3 biological replicates.
Extended Data Fig. 6 |
Extended Data Fig. 6 |. Unique structural features of MRGPRX2 and MRGPR4.
a, MRGPRX2 and MRGPRX4 have a unique structural arrangement at the PIF motif compared to the G protein coupled active structures of 5-HT2AR (PDB ID 6WHA), A2AR (PDB ID 5G53) and β2AR (PDB ID 3SN6). Residue 5.50 shifts away from the TM3-TM6 interface and does not engage L3.40 and F6.44 in MRGPRX2 and MRGPRX4. b, With G6.48, TM6 of both MRGPRX2 and MRGPRX4 packs closer to TM3 compared to the G protein coupled active structures of 5-HT2AR (PDB ID 6WHA), A2AR (PDB ID 5G53) and β2AR (PDB ID 3SN6), leading to an occluded canonical agonist binding pocket. c, (R)-ZINC-3573, cortistatin-14 and MS47134 bind to MRGPRX2 and MRGPRX4 at a position that is far away from residue 6.48, respectively. Cortistatin-14 is shown as cartoon. Small molecule compounds of receptors are shown as spheres.
Extended Data Fig. 7 |
Extended Data Fig. 7 |. Analog screening and functional characterization of MRGPRX2 antagonists.
a-b, Dose response curves of initial 14 analogs of ‘1592 (a) and 8 analogs of C9 (b) in the presence of EC80 concentration of (R)-ZINC-3573 using MRGPRX2 FLIPR Ca2+ assay. Data represent mean ± SEM of n = 3 biological replicates. c, Dose-response curves of two potent MRGPRX2 antagonists C9 and C9-6 and an inactive compound C7 in the presence of EC80 of each MRGPRX2 peptides using MRGPRX2 FLIPR Ca2+ assay. Data represent mean ± SEM of n = 3 biological replicates.
Extended Data Fig. 8 |
Extended Data Fig. 8 |. Functional characterization of optimized MRGPRX4 agonists.
a, Dose-response curves of Kir6.2/SUR1 current inhibition by indicated chemicals. Data represent mean ± SEM from n=4 biological replicates. b, d, f, h. Current-voltage relationships of whole-cell traces recorded in 150 mM KCl with the supplements of indicated chemicals of the labeled concentrations. c, e, g, Time courses showing the whole-cell-current responses to the indicated chemicals of the labeled concentrations. i, MRGPRX4 agonists X4-4 and MS47134 have a higher selectivity over Kir6.2/SUR1 channel compared to nateglinide. j, Screening of MS47134 across the GPCRome (at 320 receptors) using the PRESTO-Tango platform with 3 μM MS47134. Red dashed line indicated threefold of basal levels. Data represent mean ± SEM of fold over basal for each receptor (n=4 technical replicates).
Extended Data Fig. 9 |
Extended Data Fig. 9 |. Structural comparison of Gq-coupled MRGPRX2 and MRGPRX4.
a-d, Structural comparison of the MRGPRX4-Gq-MS47134 complex with the MRGPRX2-Gq-(R)-ZINC-3573. The receptor and Gq protein of MRGPRX4-Gq complex are colored by green and blue, respectively. The receptor and Gq protein of MRGPRX2-Gq complex are colored by cyan and salmon, respectively. Side view (a), close up view of αN-ICL2 interaction region (b), α5 helix region (c), and the cytoplasmic side of receptors (d). e, The acidic residues E1574.60 and D1775.38 of MRGPRX4 are shielded by the inserted ECL2. Side chain of D177 is not resolved but modeled here for a better visual interpretation. f, Residues E1644.60 and D1845.38 of MRGPRX2 extend to the cationic agonists accessible pocket. g, Due to the variance in residue 2.39, Y243H5.23 of Gq adopts different side-chain conformations to interact with Y130ICL2 of MRGPRX4 and Y137ICL2 of MRGPRX2. h-i, BRET2 Gq assays for Y130ICL2A of MRGPRX4 (h) and Y137ICL2A of MRGPRX2 (i). Data represent mean ± SEM of n = 3 biological replicates.
Fig. 1 |
Fig. 1 |. CryoEM structures of MRGPRX2 complexes.
a-d, Cartoon representations of MRGPRX2-Gq-cortistatin-14 complex (a), MRGPRX2-Gq-(R)-ZINC-3573 complex (b), MRGPRX2-Gi1-cortistatin-14 complex (c) and the MRGPRX2-Gi1-(R)-ZINC-3573 complex (d). e, Electrostatic surface representation of the MRGPRX2 extracellular pocket calculated using the APBS plugin in PyMOL with cortistatin-14 shown as green sticks. Red, negative (−5 kT/e); blue, positive (+5 kT/e). The cross-section image shows a nice fit of Lys3 of cortistatin-14 to sub-pocket 1. f, Binding pocket of cortistatin-14. Key residues of MRGPRX2 interacting with the Lys3 of corstitatin-14 were shown as sticks. Hydrogen bonds are shown as red dashed lines. g, Key residues involved in (R)-ZINC-3573 binding in MRGPRX2. Charge interaction is shown as red dashed lines. h, Electrostatic surface representation of the MRGPRX2 extracellular pocket with (R)-ZINC-3573 shown as yellow sticks. Red, negative (−5 kT/e); blue, positive (+5 kT/e). i, Alanine substitution of MRGPRX2 residues interacting with the Lys3 of cortistatin-14 significantly reduced cortistatin-14 stimulated Gq activation. Data represent mean ± SEM of n = 3 biological replicates. j, BRET2 validation of the (R)-ZINC-3573 binding pocket. Data represent mean ± SEM of n = 3 biological replicates.
Fig. 2 |
Fig. 2 |. G protein coupling of MRGPRX2.
a, The α5 helix of Gq engages the cytoplasmic core of MRGPRX2 in a way distinct from Gi1. The relative displacement of Gq with respect to Gi1 is indicated by arrow. The receptor and Gq protein of MRGPRX2-Gq complex are colored by cyan and red, respectively. The receptor and Gi protein of MRGPRX2-Gi complex are colored by blue and green, respectively. b-c, The detailed interactions of ICL3 (b) and ICL2 of MRGPRX2 with Gi1(c). The hydrogen bonds are highlighted as red dashed lines. d, Different engagement modes of the αN helix of Gq and Gi upon coupling to MRGPRX2. The relative displacements of Gq with respect to Gi1 are indicated by red arrows. e, The detailed interaction of ICL2 of MRGPRX2 with Gq. Hydrogen bonds are highlighted as red dashed lines.
Fig. 3 |
Fig. 3 |. Discovery of MRGPRX2 selective inverse agonists.
a, Overview of the analog optimization toward compound C9 and C9-6. b, C9 and C9-6 show improved antagonist activity for MRGPRX2 when compared to the parent compound ‘1592. C7 is shown as an inactive control. EC80 (R)-ZINC-3573 concentration (3 μM) was added in the antagonist mode FLIPR Ca2+ assay. Data represent mean ± SEM of n = 3 biological replicates. c, Compound C9 and C9-6 inhibit the basal recruitment of Gq by MRGPRX2 and display inverse agonist activities. Data represent mean ± SEM of n = 3 biological replicates. d, C9 and C9-6 inhibit substance P (10 μM) stimulated MRGPRX2 activation. Data represent mean ± SEM of n = 3 biological replicates. e-f, C9 and C9-6 display no antagonist activity towards NK1R (e) and MRGPRX4 (f) in FLIPR assay. Agonist concentrations in the antagonist assay were shown in the graph title. C7 is used as a negative control. Data represent mean ± SEM of n = 3 biological replicates. g, Compound C9 inhibit MRGPRX2 mediated LAD2 human mast activation. Data represent mean ± SEM. Samples were run in quadruplicate with n=2 biological replicates.
Fig. 4 |
Fig. 4 |. Agonist discovery and the cryoEM structure of MRGPRX4.
a, Overview of the compound optimization that leads to the discovery of MS47134. b, MS47134 displayed a significantly improved potency for MRGPRX4 in FLIPR Ca2+ assay compared with nateglinide. Data represent mean ± SEM of n = 3 biological replicates. c, Structural comparation of MRGPRX4 with MRGPRX2. Displacements of the extracellular part of MRGPRX4 related to MRGPRX2 are highlighted by red arrows. MRGPRX4 and MRGPRX2 are shown as green and cyan, respectively. MS47134 is shown as salmon sticks. d, Electrostatic surface representation of the MRGPRX4 extracellular pocket calculated using the APBS plugin in PyMOL. Red, negative (−5 kT/e); blue, positive (+5 kT/e). e, MS47134 binds to MRGPRX4 at the very extracellular side that is far away from the canonical toggle switch W6.48 in 5-HT2AR. MS47134, and 5-HT2AR agonist 25CN-NBOH are shown as sticks. f, Molecular interactions in the MS47134 pocket with surrounding residues shown as sticks. g, Alanine substitution on key residues in MS47134 pocket impaired MS47134 mediated Gq activation. Data represent mean ± SEM of n = 3 biological replicates.

Comment in

References

    1. Zylka MJ, Dong X, Southwell AL & Anderson DJ Atypical expansion in mice of the sensory neuron-specific Mrg G protein-coupled receptor family. Proc Natl Acad Sci U S A 100, 10043–10048, doi: 10.1073/pnas.1732949100 (2003). - DOI - PMC - PubMed
    1. McNeil BD et al. Identification of a mast-cell-specific receptor crucial for pseudo-allergic drug reactions. Nature 519, 237–241, doi: 10.1038/nature14022 (2015). - DOI - PMC - PubMed
    1. Green DP, Limjunyawong N, Gour N, Pundir P & Dong X A Mast-Cell-Specific Receptor Mediates Neurogenic Inflammation and Pain. Neuron 101, 412–420 e413, doi: 10.1016/j.neuron.2019.01.012 (2019). - DOI - PMC - PubMed
    1. Yu H et al. MRGPRX4 is a bile acid receptor for human cholestatic itch. Elife 8, doi: 10.7554/eLife.48431 (2019). - DOI - PMC - PubMed
    1. Meixiong J, Vasavda C, Snyder SH & Dong X MRGPRX4 is a G protein-coupled receptor activated by bile acids that may contribute to cholestatic pruritus. Proc Natl Acad Sci U S A 116, 10525–10530, doi: 10.1073/pnas.1903316116 (2019). - DOI - PMC - PubMed

Publication types

MeSH terms

Substances