. 2021 Dec;600(7888):285-289.
doi: 10.1038/s41586-021-04158-y. Epub 2021 Nov 17.

Single-cell transcriptomic characterization of a gastrulating human embryo

Affiliations

Single-cell transcriptomic characterization of a gastrulating human embryo

Richard C V Tyser et al. Nature. 2021 Dec.

Abstract

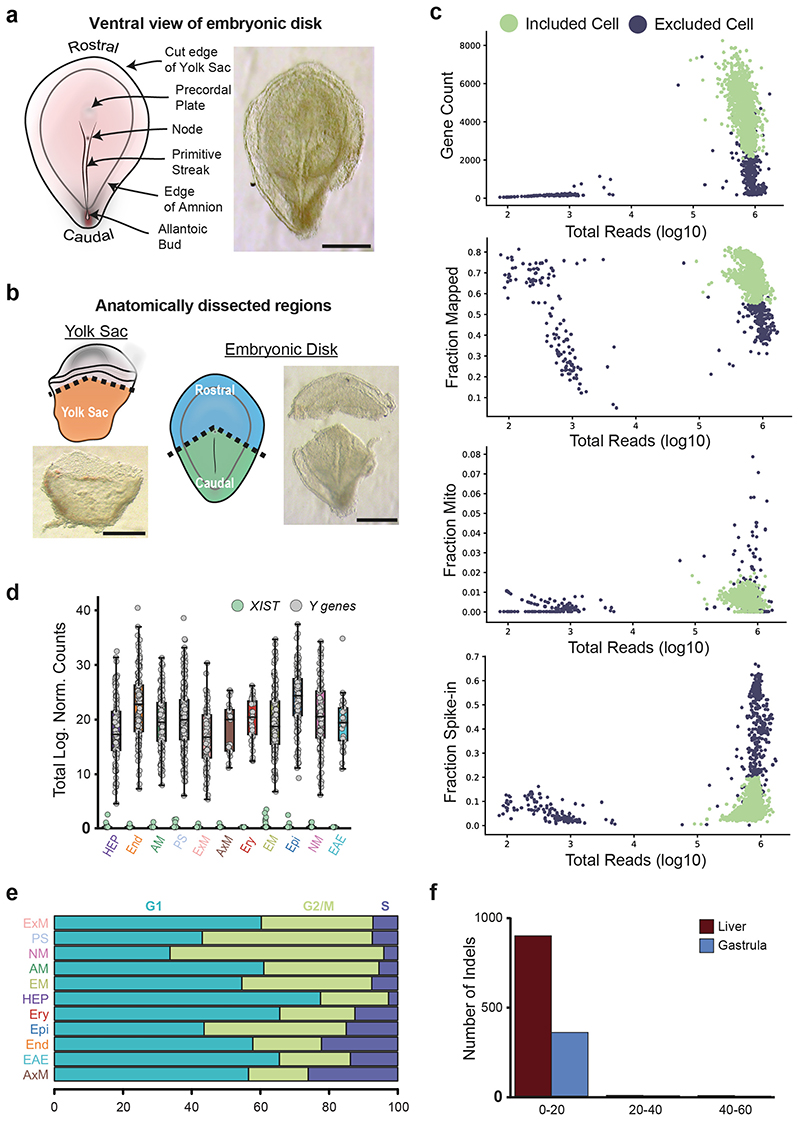
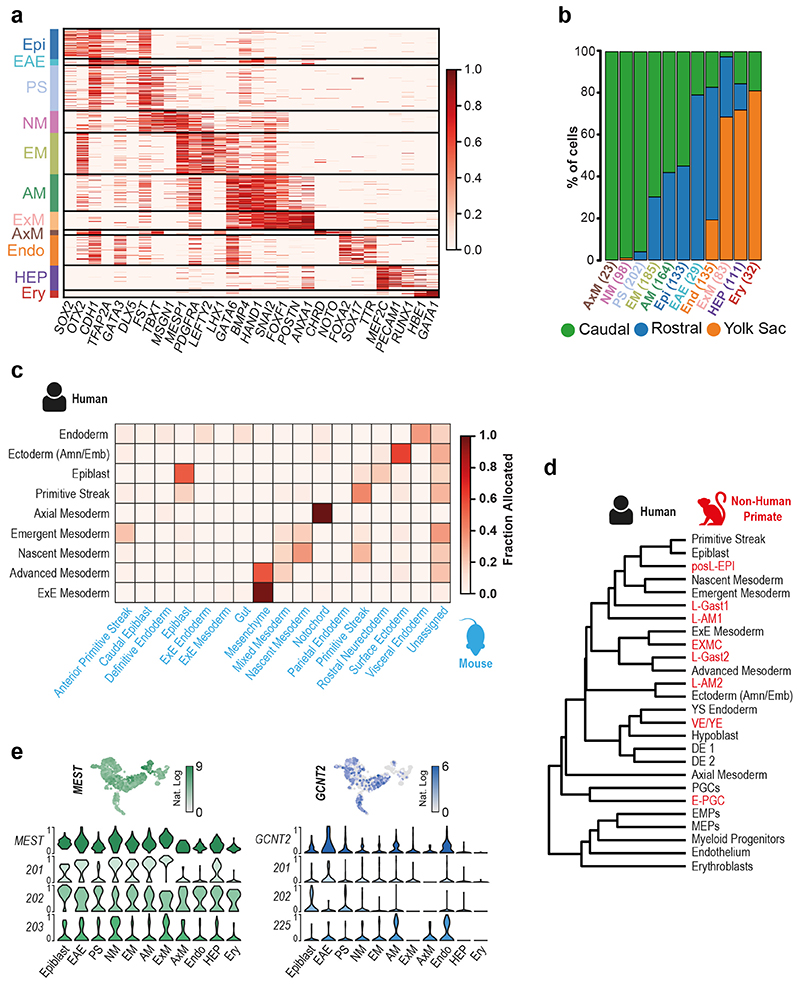
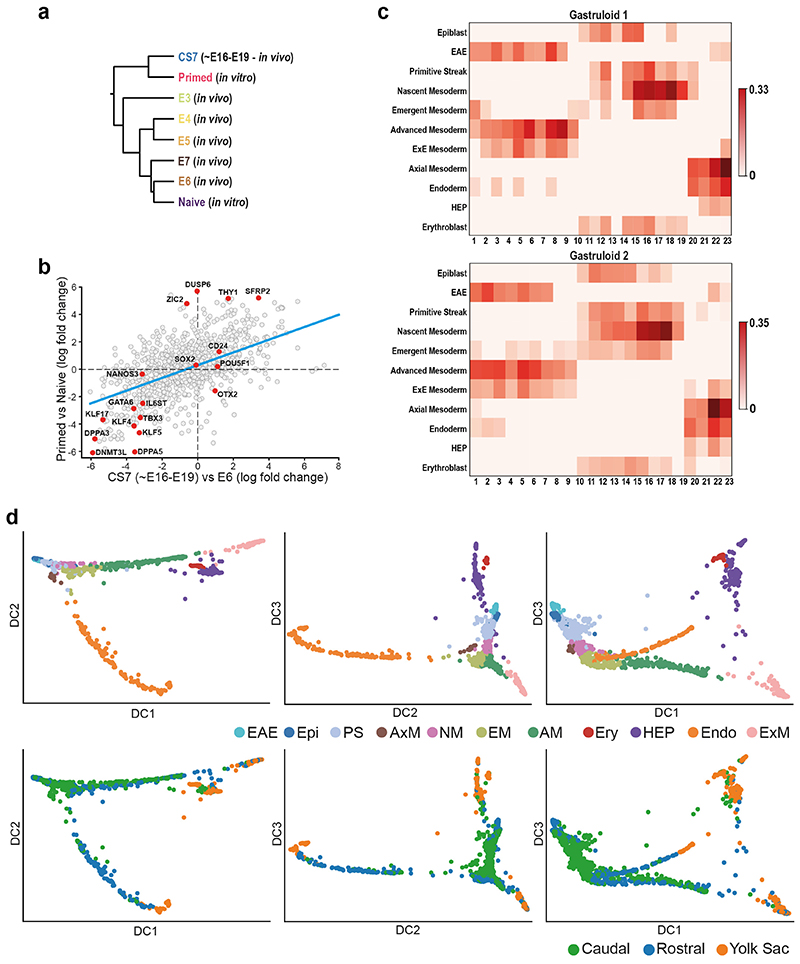
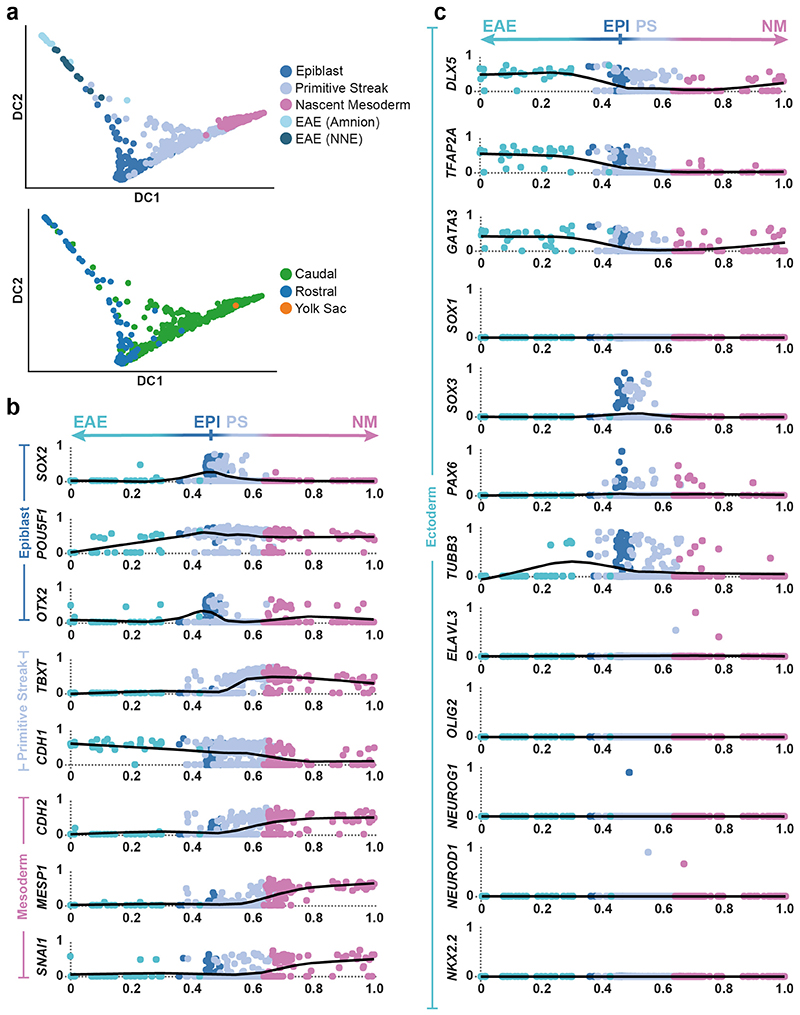
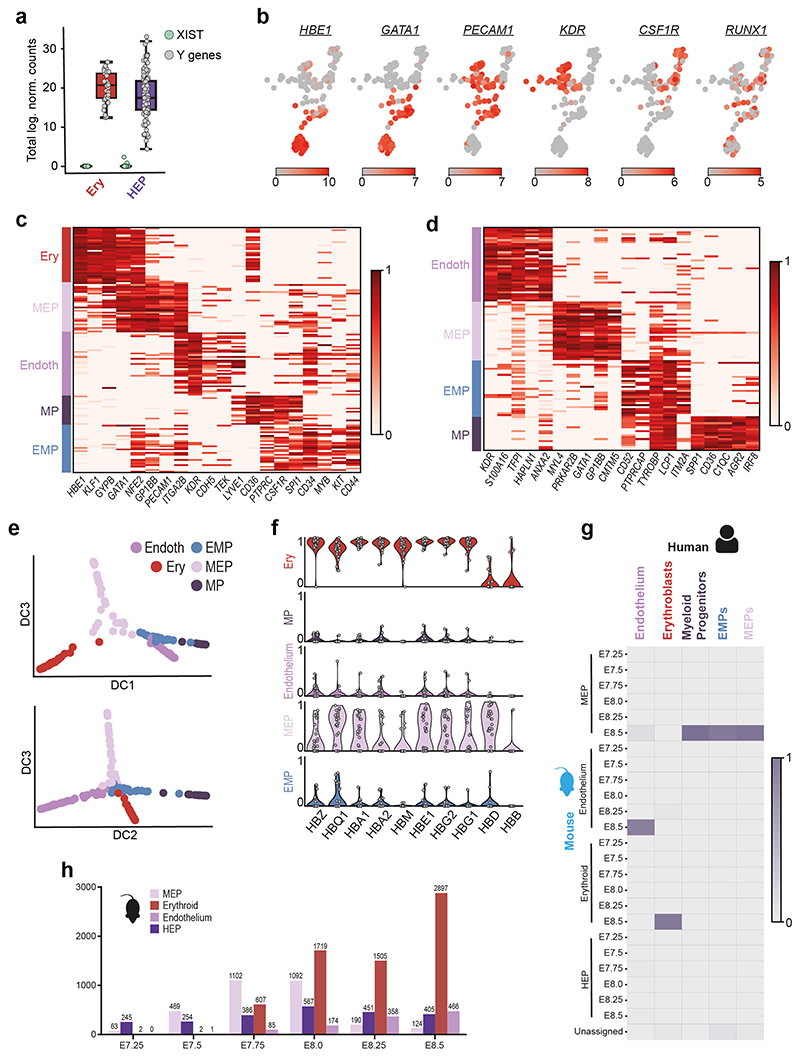
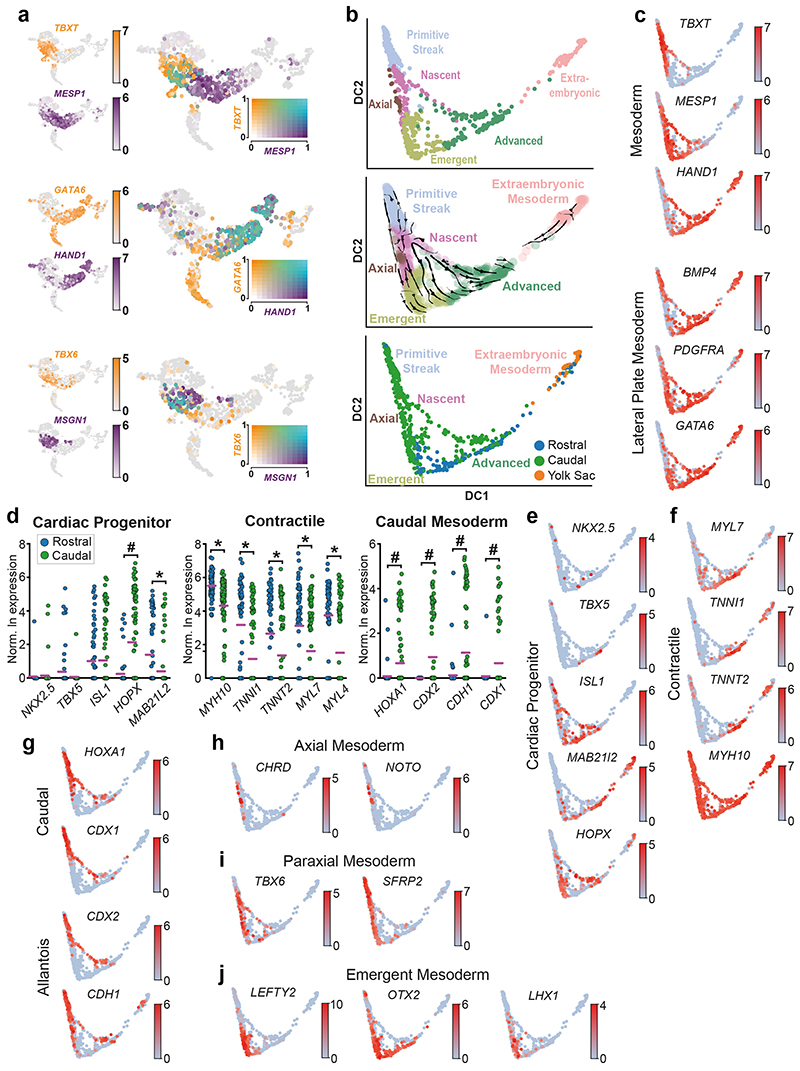
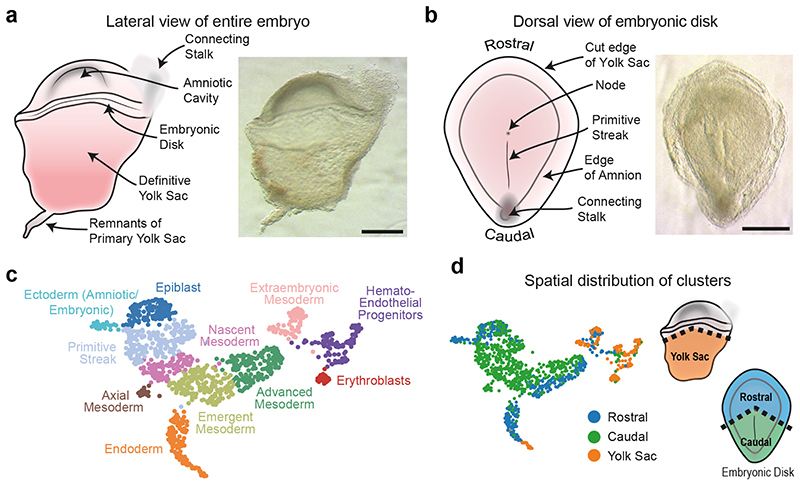
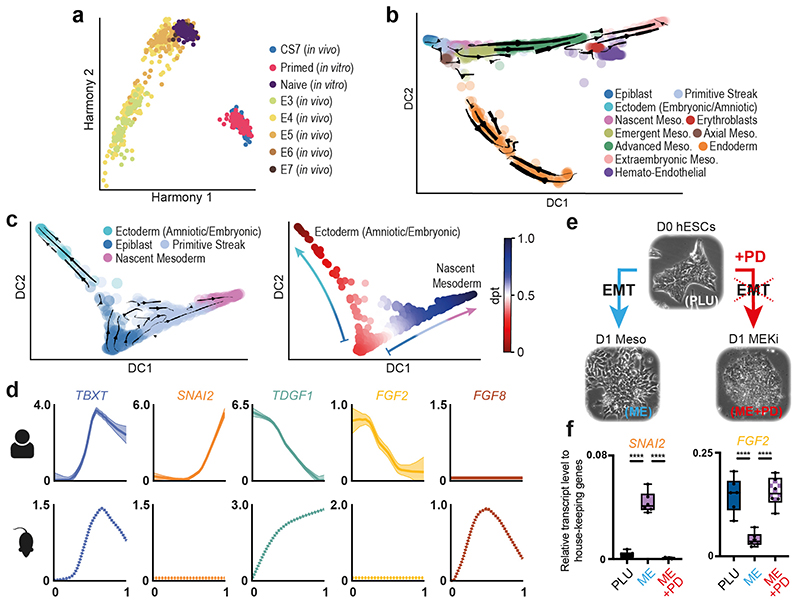
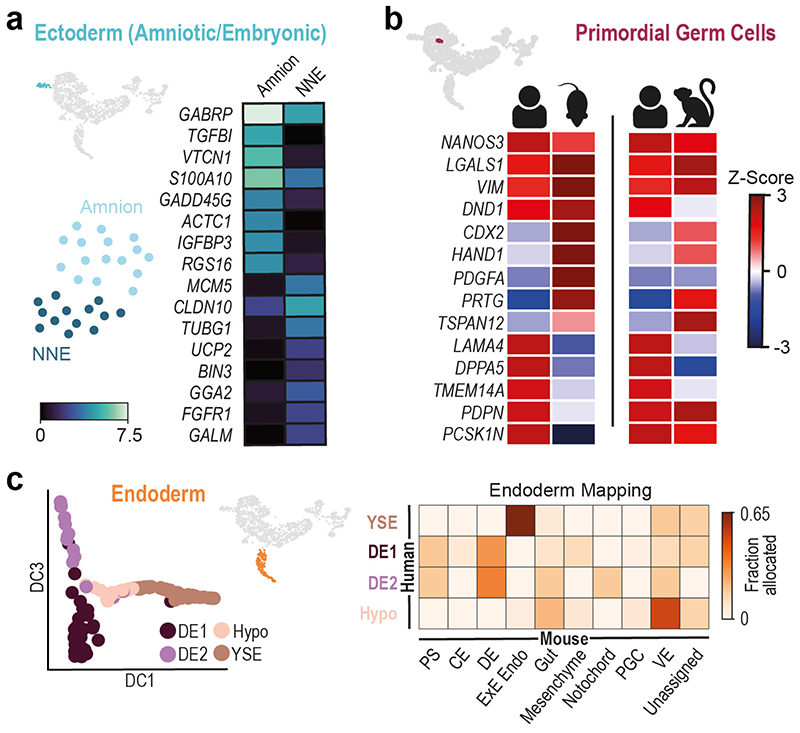
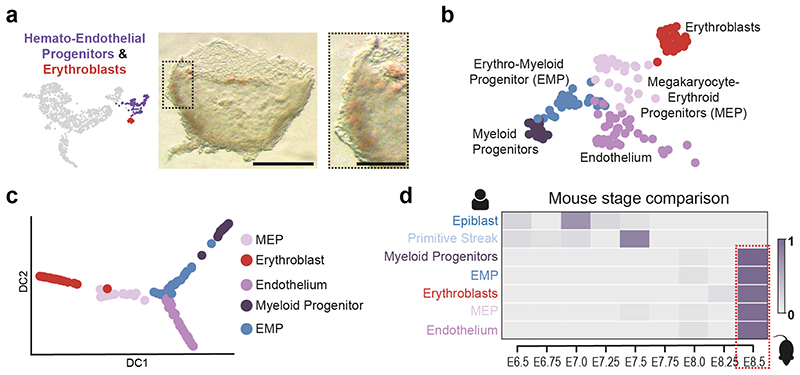
Gastrulation is the fundamental process in all multicellular animals through which the basic body plan is first laid down1-4. It is pivotal in generating cellular diversity coordinated with spatial patterning. In humans, gastrulation occurs in the third week after fertilization. Our understanding of this process in humans is relatively limited and based primarily on historical specimens5-8, experimental models9-12 or, more recently, in vitro cultured samples13-16. Here we characterize in a spatially resolved manner the single-cell transcriptional profile of an entire gastrulating human embryo, staged to be between 16 and 19 days after fertilization. We use these data to analyse the cell types present and to make comparisons with other model systems. In addition to pluripotent epiblast, we identified primordial germ cells, red blood cells and various mesodermal and endodermal cell types. This dataset offers a unique glimpse into a central but inaccessible stage of our development. This characterization provides new context for interpreting experiments in other model systems and represents a valuable resource for guiding directed differentiation of human cells in vitro.


Conflict of interest statement

Competing Interest statement

The authors declare no competing interests.

Figures

Extended Data Figure 1
Extended Data Figure 1. Quality control of scRNA-seq dataset
a, Dorsal view of the dissected embryonic disk showing the primitive streak and node (Scale bar = 500μm; n=1). b, Brightfield images showing embryo dissection with schematic diagrams highlighting the three anatomical regions collected (yolk sac, rostral and caudal regions of embryonic disk; Scale bar = 500μm; n=1). c, Metrics used to assess the quality of the scRNA-seq libraries. The scatter plots show the number of detected genes (top left), the fraction of reads mapped to the human genome (top right), the fraction of reads mapped to mitochondrial genes (bottom left) and the fraction of reads mapped to ERCC spike-ins (bottom right), all as a function of the total number of reads. Cells that passed quality control are marked by green circles, while black circles indicate cells that failed the quality control and were excluded from downstream analyses. d, The boxplots show the total log expression of normalized counts for XIST and Y-genes across all clusters. While XIST was mostly not detected, Y-chromosome genes had always non-zero counts; this suggests that there is no contamination from maternal tissues in any of the clusters. n= 1195 cells were examined from a single embryo. Horizontal black lines denote median values and boxes cover the 25th and 75th percentiles range; whiskers extend to 1.5 x IQR. e, The stacked barplots indicate the percentages of cells from each cluster in the phase G1, S or G2/M of the cell cycle, as predicted from their transcriptomic profiles. f, Insertion-deletion length and size distribution of gastrula and fetal liver data. Y axis represents total number of indels on merged cells, while x axis represents indel length in base pairs. Hemato-Endothelial Progenitors (HEP), Endoderm (End), Advanced Mesoderm (AM), Primitive Streak (PS), Extraembryonic Mesoderm (ExM), Axial Mesoderm (AxM), Erythroblasts (Ery), Emergent Mesoderm (EM), Epiblast (Epi), Nascent Mesoderm (NM), Ectoderm (Amniotic/Embryonic (EAE)).
Extended Data Figure 2
Extended Data Figure 2. Characterisation and comparison of a CS7 human gastrula with Non-human primate and Mouse.
a, Heatmap with the normalized log expression of well characterized marker genes for the identified cell types: Epiblast (Epi), Ectoderm (Amniotic/Embryonic (EAE)), Primitive Streak (PS), Nascent Mesoderm (NM), Emergent Mesoderm (EM), Advanced Mesoderm (AM), Extraembryonic Mesoderm (ExM), Axial Mesoderm (AxM), Endoderm (Endo), Hemato-Endothelial Progenitors (HEP), Erythroblasts (Ery). b, Stacked bar plots highlighting the anatomical region that cells were collected from and the percentage breakdown of each cluster. Numbers in brackets represent the total number of cells per cluster. c, Heatmap showing the fraction of human gastrula cells allocated to mouse cell types at E7.25 (data from ). d, Dendrogram showing hierarchical clustering of the transcriptomes of cell types from human gastrula and cultured cynomolgus macaque embryos at 16-day post-fertilization (from ). e, Top, UMAP plots showing the log expression of MEST and GCNT2. Bottom, violin plots showing the log expression of total transcripts (top row) and selected isoforms scaled by the maximum value in different cell types. Isoform names refer to Ensembl nomenclature.
Extended Data Figure 3
Extended Data Figure 3. In Vitro vs In Vivo comparisons
a, Dendrogram representation built on corrected expression values obtained with Seurat showing comparison of an in vitro model of pluripotency with in vivo data. b, Log-fold changes of expression levels of the genes between primed vs naïve hESC (y axis) and CS7 epiblast vs E6 data (x axis). Selected genes are highlighted in red; the blue line is obtained through a linear regression. A statistically significant positive correlation is found (Pearson’s correlation coefficient ~0.63, p-value = 3e-107), indicating that the hESC resemble the in vivo primed and naïve states at the transcriptome-wide level. c, Heatmaps showing the correlations between the transcriptomic profiles of the human gastrula cell types (rows) and sections of human gastruloids taken at different positions along the rostral-caudal axis (columns) in two different replicates (Gastruloid 1 and Gastruloid 2). Only the values of the statistically significant correlations (p-value < 0.01; 2-tailed Pearson’s correlation, see Methods) are reported, while all the non-significant correlations were set to 0. d, UMAP representation of the human gastrula data with the PGCs highlighted. d, Diffusion map of cells from all 11 clusters. The first three diffusion components (DC1, 2, 3) are plotted in different combinations. In the top panels, cells are coloured by the clusters they belong to,while in the bottom panels the colours indicate the region each cell was dissected from. Ectoderm (amniotic/embryonic) (EAE), Epiblast (Epi), Primitive Streak (PS), Axial Mesoderm (AxM), Nascent Mesoderm (NM), Emergent Mesoderm (EM), Advanced Mesoderm (AM), Erythroblasts (Ery), Hemato-Endothelial Progenitors (HEP), Endoderm (Endo), Extraembryonic Mesoderm (ExM).
Extended Data Figure 4
Extended Data Figure 4. Differentiation of the epiblast
a, Diffusion map of cells from the Epiblast, Primitive Streak, Nascent Mesoderm and Ectoderm (amniotic/embryonic). The first two diffusion components are plotted (DC1 and DC2) and cells are colored by their cluster (top) or the anatomical region they were isolated from (bottom). b and c, Normalized log gene expression changes along a pseudotime coordinate (see Figure 4a) running from 0 to 1 and spanning the Ectoderm (amniotic/embryonic) (EAE), the Epiblast (EPI), the Primitive Streak (PS) and the Nascent Mesoderm (NM), as depicted by the arrow on top. The selected genes highlight Primitive Streak and mesoderm formation (panel b) as well as ectoderm differentiation (panel c).
Extended Data Figure 5
Extended Data Figure 5. Mesoderm formation in human and mouse
a, Diffusion map with cells from the human (top two plots) or mouse (bottom two plots) Epiblast, Primitive Streak and Nascent Mesoderm clusters. Cells are colored based on their cluster of origin or on their diffusion pseudotime coordinate. b, Upset plot for the number of differentially expressed (DE) genes as a function of the diffusion pseudotime (dpt) shown in panel a in mouse (m) or human (h). Here, only genes that are differentially expressed in both species and with a log-fold change > 1 along the trajectory are included. Genes are split according to their increasing (up) or decreasing (down) trend as a function of dpt. c, Comparison of pseudotime analysis during primitive streak and nascent mesoderm formation in human and mouse (data from). Cells in epiblast (Epi), Primitive Streak (PS) and Nascent Mesoderm (NM) clusters from human and mouse embryos at matching stages (see Methods) were independently aligned along a differentiation trajectory and a diffusion pseudotime coordinate (dpt) was calculated for each (top). The expression pattern and standard error of the mean of selected genes along pseudotime is plotted for human (left, continuous lines) and mouse (right, dashed lines). Both SNAI1 and CDH1 showed comparable expression profiles during mesoderm formation in mouse and human whilst MSGN1 was differently expressed between species.
Extended Data Figure 6
Extended Data Figure 6. Characterization of EMT during hESC mesoderm formation
a, Bright-field microscopy images of D0 hESC (left), D1 Meso (center) and D1 MEK Inhibition (right) ESC colonies (top panels). Fluorescence microscopy images of E-Cadherin staining (bottom panels). b, Quantification of transcript levels for selected pluripotent, EMT and mesendoderm genes across the three conditions PLU, ME, ME+PD. c, Quantification of transcript levels for selected non-neural ectoderm genes across the three conditions PLU, ME, ME+PD. (n = 6 from three different experiments. Center line, median; box limits, upper and lower quartiles; whiskers, minimum and maximum; dots, mean value per experiement. ns = p-value ≥ 0.05; *** = p-value < 0.001; **** = p-value < 0.0001 (Ordinary one-way ANOVA after passing a Shapiro-Wilk normality test. Kruskal-Wallis multiple comparison test used if Shapiro-Wilk normality test failed (MSGN1, TDGF1, HAND1, DLX5). House-keeping genes, HKGs. See SI Table 17 for source data and exact p-values.
Extended Data Figure 7
Extended Data Figure 7. Comparison of signaling during mesoderm formation in the human and mouse.
Heatmap comparison of the z-score-normalized log expression values of components of FGF, TGF-β and Wnt signaling pathways in the human gastrula, mouse embryos (E7.25 stage) and cultured cynomolgus macaque embryos (16 d.p.f stage). From human and mouse we considered the Epiblast (Epi), Primitive Streak (PS) and Nascent Mesoderm (NM) clusters; in the macaque, we used the clusters annotated as postL-Epi, L-Gast1 and L-Gast2.
Extended Data Figure 8
Extended Data Figure 8. Endoderm subcluster identification
a, Heatmap showing the scaled log expression levels of marker genes of the four endodermal subclusters. b, Percentage of cells dissected from the Caudal, Rostral or Yolk Sac portion of the embryo in the four endodermal subclusters. c, Percentage of cells based on their predicted cell-cycle phase of the four endodermal subclusters. d, Diffusion map of cells from the Endoderm cluster. The first two diffusion components (DC1 and DC2) are plotted and cells are coloured by the sub clusters (left), anatomical origin (central) or the predicted cell-cycle phase (right). Yolk Sac, YS; Definitive Endoderm (DE) 1 and 2. e, Diffusion map of cells from the Endoderm cluster with DC1 and DC3 plotted, showing log expression levels of Panendoderm, Yolk-sac endoderm and definitive endoderm markers. f, Log expression levels of Anterior Definitive Endoderm markers. These genes are more highly expressed in DE2. g, Log expression levels of Gut Endoderm markers, showing limited expression. h, Maximum intensity projection and mid-sagittal section (h’) of an E7.0 mouse embryo showing expression of Gjb1 (yolk sac endoderm marker) as well as Cer1 and Hhex (anterior definitive endoderm markers) using Hybridization Chain Reaction (n=4). Cer1 and Hhex show greater expression in the anterior embryonic endoderm. Anterior, Ant; Posterior, Pos; Yolk-sac Endoderm, YSE. i, Violin plots showing the scaled log expression of total transcripts (top row) and individual isoforms in different endodermal subclusters. Isoform lables refer to Ensembl transcript numbers.
Extended Data Figure 9
Extended Data Figure 9. Hemato-Endothelial Progenitors subclusters
a, Boxplots showing the total log expression of normalized counts for XIST and Y-genes in Erythroblasts (Ery) and Hemato-Endothelial Progenitors (HEP), indicating no contamination from maternal tissue. n=143 cells were examined from a single embryo. Horizontal black lines denote median values and boxes cover the 25th and 75th percentiles range; whiskers extend to 1.5 x IQR. b, UMAP of HEP and Erythroblast clusters showing log expression of blood related marker genes. c, Heatmap showing the scaled log expression of well-characterized marker genes for both the Hemato-Endothelial Progenitors subclusters and Erythroblast cluster. d, Heatmap showing the normalized log expression levels of the top 5 marker genes of the four Hemato-Endothelial Progenitors subclusters. e, Diffusion maps of HEP subclusters and Erythroblasts showing diffusion components (DC) 1, 2 and 3. f, Violin plots showing the scaled log expression of Globin genes in the five blood related clusters: Erythroblasts (Ery), Myeloid Progenitors (MP), Endothelium, Megakaryocyte-Erythroid Progenitors (MEP) and Erythro-Myeloid progenitors (EMP). Each grey dot represents a single cell. g, Heatmap showing the estimated mapping of human Erythroid and HEP subclusters to mouse blood-related clusters. Scalebar represents the fraction of human cells mapped to each category. h, Bar graph showing the number of cells present in the mouse scRNA-seq dataset at different development timepoints, values represent the exact number of cells present.
Extended Data Figure 10
Extended Data Figure 10. Rostral and Caudal differences in diversification of mesodermal subtypes
a, UMAP highlighting combinatorial gene expression. Individual gene expression (left) is reported as the log expression whilst combinatorial plots (right) show scaled log expression values. b, Diffusion map of cells from the 6 mesoderm related clusters (Primitive Streak, PS; Nascent Mesoderm, NM; Emergent Mesoderm, EM; Mesoderm, Meso; Axial Mesoderm, AxM; Extraembryonic Mesoderm, ExM), with the first and the second diffusion components plotted. c, Diffusion map of mesodermal showing the log expression levels of mesodermal markers genes. d, Differential gene expression between rostral and caudal advanced mesoderm cells. Significantly upregulated in rostral (*) or caudal (#) cells. e-j, Diffusion map of mesodermal clusters showing log expression levels of mesoderm subtype markers.
Figure 1
Figure 1. Morphological and transcriptional characterization of a CS7 human gastrula
a, Lateral view of the intact CS7 human embryo (Scale bar = 500μm; n=1). b, Dorsal view of the dissected embryonic disk showing the primitive streak and node (Scale bar = 500μm; n=1). c, UMAP of all the cells, computed from highly variable genes. d, UMAP and schematics highlighting the anatomical region that cells were collected from (Also see Extended Data Figure 1b).
Figure 2
Figure 2. State transitions during gastrulation
a, Harmony representation of the transcriptomic profiles of CS7 epiblast cells compared with cells from pre-implantation human embryos, primed and naïve hESC. b, RNA velocity vectors overlaid on diffusion map of cells from all 11 clusters. c, Diffusion maps with RNA velocity vectors (at left) and diffusion pseudotime (dpt) coordinates (at right). The two differentiation trajectories from Epiblast towards Ectoderm (Amniotic/Embryonic) or Mesoderm are shown. d, Comparison of primitive streak and nascent mesoderm formation in human and mouse. Mean expression profile and standard error, along pseudotime, is plotted for selected human (top) and mouse (bottom) genes. e, in vitro model for EMT during gastrulation. hESC (D0 hESC, PLU) are differentiated towards Mesendoderm (D1 MESO, ME) and undergo EMT. Inhibition of the MEK pathway (MEKi) prevents MET (D1 MEK Inhibition, ME+PD). f, Quantification of selected transcripts across the three conditions PLU, ME, ME+PD. qPCR results are consistent with in vivo data in panel d. (n = 6 from three different experiments. Center line, median; box limits, upper and lower quartiles; whiskers, minimum and maximum; dots, mean value per experiment. **** = p-value < 0.000; ordinary one-way ANOVA after Shapiro-Wilk normality test). See SI Table 17 for source data.
Figure 3
Figure 3. Identification of cell subtypes
a, Subclustering of Ectoderm (Amniotic/Embryonic), highlighted in UMAP insert, into Amnion and Non-Neural Ectoderm (NNE). Heatmap of log expression of the top eight upregulated genes in the two subclusters. b, Primordial Germ Cell (PGC) population subclustered from the Primitive Streak cluster. Heatmaps comparing gene expression in human PGCs with those from cultured E7.5 mouse embryos (left) and cynomolgus monkey (right). c, At left, diffusion map of Endodermal, showing four subclusters: Definitive Endoderm 1 and 2 (DE1 and DE2); Hypoblast (Hypo); Yolk Sac Endoderm (YSE). At right, heatmap showing the fraction of cells from the human endodermal sub clusters allocated to mouse cell types at E7.25. PS, primitive streak; CE, caudal epiblast; DE, definitive endoderm; ExE Endo, extraembryonic endoderm; VE, visceral endoderm.
Figure 4
Figure 4. Identification of early blood progenitor types in the human
a, Brightfield image of the Yolk Sac highlighting pigmented cells (Scale bar = 500μm; n=1). Boxed region magnified at right (Scale bar = 150μm). b, UMAP of the HEP and Erythroblast clusters showing four subclusters within the HEPs. c, Diffusion maps of HEP subclusters and Erythroblasts. d, Estimation of equivalent mouse stage for selected human clusters. The heatmap shows the fraction of human cells from each cluster that maps onto the equivalent mouse cell type at different stages. Epiblast and Primitive Streak cells are most similar to their mouse counterpart at E7.0 and E7.5 respectively, but blood related cells are all equivalent to E8.5 mouse cells.

Comment in

References

    1. Stern CD. Gastrulation: From Cells to Embryo. 2004
    1. Tam PPL, Loebel DAF. Gene function in mouse embryogenesis: Get set for gastrulation. Nature Reviews Genetics. 2007;8:368–381. - PubMed
    1. Bardot ES, Hadjantonakis AK. Mouse gastrulation: Coordination of tissue patterning, specification and diversification of cell fate. Mech Dev. 2020;163 - PMC - PubMed
    1. Arnold SJ, Robertson EJ. Making a commitment: cell lineage allocation and axis patterning in the early mouse embryo. Nat Rev Mol Cell Biol. 2009;10:91–103. - PubMed
    1. O’Rahilly R, Müller F. Developmental stages in human embryos: Revised and new measurements. Cells Tissues Organs. 2010 doi: 10.1159/000289817. - DOI - PubMed

Publication types