. 2021 Dec;600(7888):269-273.
doi: 10.1038/s41586-021-04143-5. Epub 2021 Nov 17.

Reverse-translational identification of a cerebellar satiation network

Affiliations

Reverse-translational identification of a cerebellar satiation network

Aloysius Y T Low et al. Nature. 2021 Dec.

Abstract

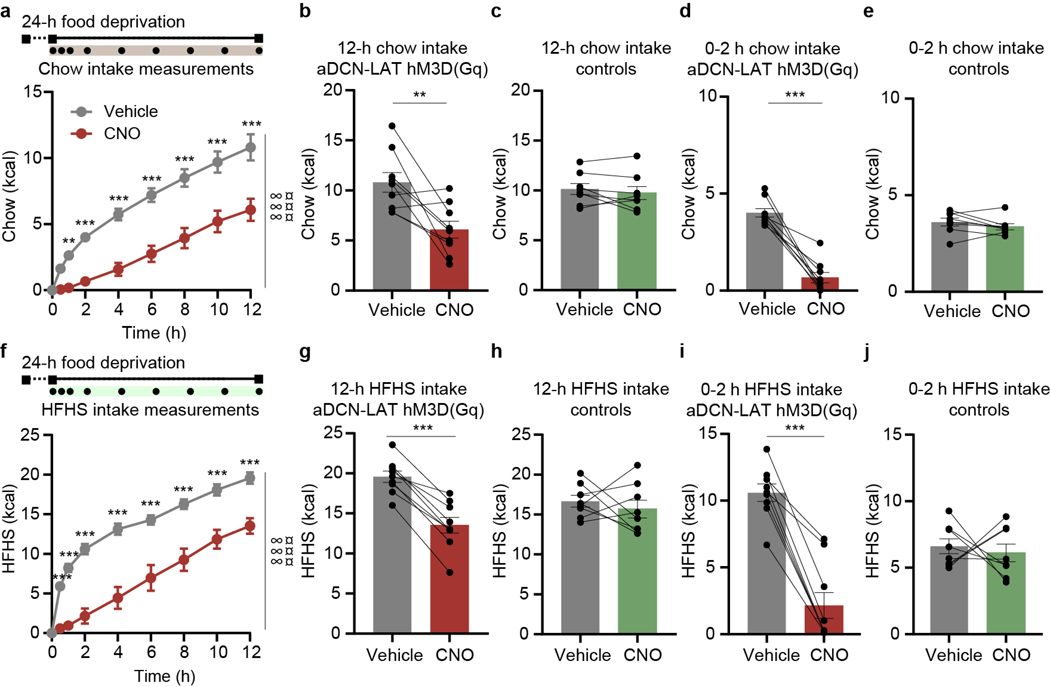
The brain is the seat of body weight homeostasis. However, our inability to control the increasing prevalence of obesity highlights a need to look beyond canonical feeding pathways to broaden our understanding of body weight control1-3. Here we used a reverse-translational approach to identify and anatomically, molecularly and functionally characterize a neural ensemble that promotes satiation. Unbiased, task-based functional magnetic resonance imaging revealed marked differences in cerebellar responses to food in people with a genetic disorder characterized by insatiable appetite. Transcriptomic analyses in mice revealed molecularly and topographically -distinct neurons in the anterior deep cerebellar nuclei (aDCN) that are activated by feeding or nutrient infusion in the gut. Selective activation of aDCN neurons substantially decreased food intake by reducing meal size without compensatory changes to metabolic rate. We found that aDCN activity terminates food intake by increasing striatal dopamine levels and attenuating the phasic dopamine response to subsequent food consumption. Our study defines a conserved satiation centre that may represent a novel therapeutic target for the management of excessive eating, and underscores the utility of a 'bedside-to-bench' approach for the identification of neural circuits that influence behaviour.


Figures

Extended Data Fig. 1 |
Extended Data Fig. 1 |. fMRI paradigm for response to food cue
Subjects with Prader-Willi syndrome (PWS) and controls underwent two separate scanning sessions (top left, group): either during fasting or post-meal (bottom left, session). During each scanning session, participants were presented with visual cues that alternate between food (muffin) and non-food (dog) categories (right, stimulus).
Extended Data Fig. 2 |
Extended Data Fig. 2 |. Neural activation pattern following food infusion and refeeding in mice
(a-c) Experimental design for Targeted Recombination of Activated Populations (TRAP) labelling of neurons activated by water infusion (IG water), Ensure® infusion (IG Ensure®) or refeeding (Refed) in Fos2A::iCreER; Ai9 mice. (d-i) tdTomato expression in the DCN after water infusion (d; e, magnified of box in d), 1 kcal Ensure® infusion (f; g, magnified of box in f), and chow refeeding (h; i, magnified of box in h). Scale bar, 500 μm (d, f, h), 100 μm (e, g, i). (j) Heatmap depicting the activated cells recombined in DCN subregions following infusion and refeeding (n=9). (k-m) tdTomato expression in the nucleus tractus solitarius (NTS) 3 weeks after water infusion (k), 1 kcal Ensure® infusion (l), and chow refeeding (m). Scale bar, 500 μm. (n-p) tdTomato expression in the paraventricular hypothalamic nucleus (PVH) 3 weeks after water infusion (n), 1 kcal Ensure® infusion (o), and chow refeeding (p). Scale bar, 250 μm. (q-s) tdTomato expression in the arcuate hypothalamic nuclei (ARC) 3 weeks after water infusion (q), 1 kcal Ensure® infusion (r), and chow refeeding (s). Scale bar, 250 μm. (t-v) tdTomato expression in the lateral parabrachial nucleus (LPBN) 3 weeks after water infusion (t), 1 kcal Ensure® infusion (u), and chow refeeding (v). Scale bar, 250 μm. (w-y) tdTomato expression in the central amygdaloid nucleus (CEA) 3 weeks after water infusion (w), 1 kcal Ensure® infusion (x), and chow refeeding (y). Scale bar, 500 μm. (z-bb) tdTomato expression in the bed nucleus of the stria terminalis (BNST) 3 weeks after water infusion (z), 1 kcal Ensure® infusion (aa), and chow refeeding (bb). Scale bar, 250 μm. (cc) Heatmap depicting relative density of cells recombined following water and calorie intake (top), and 1 kcal Ensure® infusion and refeeding (bottom, n=9). (dd) Schematic depicting the DCN and key feeding brain regions that sense food cues and nutrients. Statistical analysis in Supplementary Table 1.
Extended Data Fig. 3 |
Extended Data Fig. 3 |. Mapping the DCN subregions that suppress food intake
(a) Schematic of the deep cerebellar nuclei. The lateral subnuclei of the anterior deep cerebellar nuclei (aDCN) are depicted in maroon (aDCN-LAT, consisting of Lat and LatPC, bregma −5.68 to −5.88 mm), interposed subnuclei of the aDCN are depicted in pink (aDCN-INT, consisting of IntA, IntDL, IntP, and IntPPC, bregma −6.00 to −6.35 mm). The posterior DCN is in grey (pDCN, consisting of IntP, IntPPC, Med, MedDL, and MedL, bregma −6.36 to −6.64 mm, see also e and g). (b) Distribution of cells expressing hM3D(Gq) across 9 DCN subnuclei in mice with hM3D(Gq) targeted to the lateral nucleus (aDCN-LAT) and mice with hM3D(Gq) targeted to the interposed nucleus (aDCN-INT). Mice with targeting to the LAT show a reduction in food intake following DREADD activation (aDCN-LAT in maroon, n=5 mice, and aDCN-INT in pink, n=3 mice). (c) Schematised serial coronal sections depicting regions where hM3D expression results in food intake reduction (magenta). (d) Representative images of the entire DCN in a aDCN-LAT hM3D(Gq) mouse with hM3D(Gq) expression in the lateral nucleus. Scale bar, 2000 μm. (e) Expression of mCherry (as control viral vector) in the aDCN (red: mCherry). Scale bar, 500 μm. (f) Chow intake in mice with mCherry expression in the aDCN following vehicle or CNO treatment (n=8, paired t-test, P=0.539). (g) hM3D(Gq) expression in the pDCN (red: hM3D(Gq)). Scale bar, 500 μm. (h) Chow intake in mice with hM3D(Gq) expression in the pDCN following vehicle or CNO treatment (n=12, paired t-test, P=0.548). (i) Chow intake in mice with mCherry expression in the pDCN following vehicle or CNO treatment (n=8, paired t-test, P=0.722). Data are expressed as mean ± SEM. Lat, lateral; LatPC, lateral parvicellular; IntDL, interposed dorsolateral; IntA, interposed anterior nucleus; IntP, interposed posterior; IntPPC, interposed posterior parvicellular; MedDL, medial dorsolateral; Med, medial; MedL, medial lateral. Statistical analysis in Supplementary Table 1.
Extended Data Fig. 4 |
Extended Data Fig. 4 |. Neural activity in the aDCN suppresses food intake independent of hunger state with no compensatory metabolic changes
(a) Experimental design: meal pattern measurements of 24-h food-deprived mice following vehicle or CNO i.p. administration. (b) Latency to first bite in food-deprived mice with hM3D(Gq) expression in the aDCN-LAT (n=9), aDCN-INT (n=16) or mCherry control in the aDCN (n=8) following vehicle or CNO treatment (two-way ANOVA interaction P<0.001, main effect P=0.005; Holm-Sidak’s, P<0.001). (c) Average meal duration during a 1-h chow intake assay following 24-h food deprivation in mice with hM3D(Gq) expression in the aDCN-LAT (n=9), aDCN-INT (n=16 mice), or control mCherry expression in the aDCN (n=8) following vehicle or CNO treatment (two-way ANOVA interaction P=0.005, main effect P<0.001; Holm-Sidak’s, P<0.001). (d) Rate of food intake during a 1-h chow intake assay following 24-h food deprivation in mice with hM3D expression in the aDCN-LAT (n=9), aDCN-INT (n=16), or control mCherry expression in the aDCN (n=8) following vehicle or CNO treatment (two-way ANOVA interaction P=0.748). (e) Experimental design: meal pattern measurements of ad libitum fed mice following vehicle or CNO i.p. administration. (f) Chow intake in ad libitum fed mice with hM3D(Gq) expression following vehicle or CNO treatment (aDCN-LAT: n=9, aDCN-INT: n=16, mCherry control: n=8; two-way ANOVA, interaction P=0.001, main effect P=0.006; Holm-Sidak’s, P<0.001). (g) Latency to first bite in ad libitum fed mice with hM3D(Gq) expression following vehicle or CNO treatment (aDCN-LAT: n=9, aDCN-INT: n=16, mCherry control: n=8; two-way ANOVA interaction P<0.001, main effect P<0.001; Holm-Sidak’s, P<0.001). (h) Chow intake in ad libitum fed mice with mCherry control or hM3D(Gq) expression in the pDCN following vehicle or CNO treatment (pDCN mCherry: n=8, pDCN hM3D(Gq): n=12; two-way ANOVA interaction P=0.358). (i) Schematic of the metabolic monitoring experiment. (j) Energy expenditure (kcal) over a 48-h period in mice with mCherry control (n=8) or hM3D(Gq) (n=7) expression in the aDCN-LAT (unpaired t-test, P=0.004). (k) Energy intake (EI) and energy expenditure (EE) over 48-h period in mice with mCherry control or hM3D(Gq) expression in the aDCN-LAT following CNO treatment normalized to vehicle treatment (n=7 control, 8 aDCN-LAT-hM3D(Gq), repeated measures two-way ANOVA interaction P<0.001, main effect P<0.001; Holm-Sidak’s, P<0.001, P=0.009 (EE); P<0.001, P<0.001, P<0.001, P=0.006 (EI)). Data are expressed as mean ± SEM, two-sided P values, t-tests and post-hoc comparisons: **P<0.01, ***P<0.001, ANOVA interaction: ∞∞P<0.01, ∞∞∞P<0.001; ANOVA main effect of group: ¤¤P<0.01, ¤¤¤P<0.001. Statistical analysis in Supplementary Table 1.
Extended Data Fig. 5 |
Extended Data Fig. 5 |. aDCN activity suppresses food intake regardless of hedonic value of food
(a) Experimental timeline: 24-h food deprivation followed by measurements of chow intake over 12-h (top). Cumulative kcal of chow intake in food-deprived mice with hM3D(Gq) expression in the aDCN-LAT following vehicle or CNO treatment (bottom; n=9 hM3D(Gq); repeated measures two-way ANOVA interaction P<0.001, main effect P<0.001; Holm-Sidak’s, P=0.094 (30 min), P=0.008 (1 h), P<0.001 (2 h), P<0.001 (4h), P<0.001 (6h), P<0.001 (8 h), P<0.001 (10 h), P<0.001 (12 h)). (b) 12-h food intake in food-deprived mice expressing hM3D(Gq) in the aDCN-LAT (n=9 mice, paired t-test, P=0.008). (c) 12-h food intake in food-deprived mice expressing mCherry in the aDCN-LAT (n=8 mice, paired t-test, P=0.391). (d) Food intake during the first 2-h of refeeding in food-deprived mice expressing hM3D(Gq) in the aDCN-LAT (n=9 mice, paired t-test, P<0.001). (e) Food intake during the first 2-h of refeeding in food-deprived mice expressing mCherry in the aDCN-LAT (n=8 mice, paired t-test, P=0.223). (f) Experimental timeline: 24-h food deprivation followed by measurement of high fat high sugar (HFHS) diet intake over 12 h (top). Cumulative kcal of HFHS diet intake in food-deprived mice with hM3D(Gq) expression in the aDCN-LAT following vehicle or CNO treatment (bottom; n= 9 hM3D(Gq) mice; two-way repeated measures ANOVA interaction P<0.001, main effect P<0.001; Holm-Sidak’s, P<0.001 (30-min), P<0.001 (1-h), P<0.001 (2-h), P<0.001 (4-h), P<0.001 (6-h), P<0.001 (8-h), P<0.001 (10-h), P<0.001 (12-h)). (g) 12-h HFHS diet intake in food-deprived mice expressing hM3D(Gq) in the aDCN-LAT (n=9 mice, paired t-test, P<0.001). (h) 12-h HFHS diet intake in food-deprived mice expressing mCherry in the aDCN-LAT (n=8 mice, paired t-test, P=0.527). (i) Calorie intake during the first 2-h of HFHS diet refeeding in food-deprived mice expressing hM3D(Gq) in the aDCN-LAT (n=9 mice, paired t-test, P<0.001). (j) Calorie intake during the first 2-h of HFHS diet refeeding in food-deprived mice expressing mCherry in the aDCN-LAT (n=9 mice, paired t-test, P=0.686). Data are expressed as mean ± SEM, two-sided P values, t-tests and post-hoc comparisons: **P<0.01, ***P<0.001, ANOVA interaction: ∞∞∞P<0.001; ANOVA main effect of group: ¤¤¤P<0.001. Statistical analysis in Supplementary Table 1.
Extended Data Fig. 6 |
Extended Data Fig. 6 |. Glutamatergic neurons in the DCN are activated by food intake
(a-h) Fluorescent In Situ Hybridization (FISH) histochemistry in the lateral nucleus of the DCN in food-deprived (a, b, e, f) and chow-refed mice (c, d, g, h) (red, Homer1a; green, vGluT2; blue, vGAT in b and d, GlyT2 in f and h). Scale bars, 20 μm. (i) Homer1a expression in excitatory (vGluT2+) and inhibitory (vGAT+ or GlyT2+) DCN neurons following food deprivation or refeeding (n=3 mice per group, two-way ANOVA main effect P<0.001; Holm-Sidak’s, P=0.034). (j) Number of excitatory (vGluT2+) and inhibitory (vGAT+ or GlyT2+) DCN neurons that express Homer1a following food deprivation or refeeding (n=3 mice per group, two-way ANOVA main effect P=0.009; Holm-Sidak’s, P=0.023). (k, l) Expression level (k) and number (l) of Homer1a+ vGluT2+ neurons within the 3 major cerebellar nuclei following food deprivation or refeeding (n=3 mice per group, two-way ANOVA, expression level main effect P=0.013, number main effect P=0.010; Holm-Sidak’s, expression level, P=0.006, number, P=0.025). Data are expressed as mean ± SEM, two-sided P values, t-tests and post-hoc comparisons: *P<0.05, **P<0.01, ANOVA interaction: ∞∞∞P<0.001; ANOVA main effect of group: ¤P<0.05, ¤¤¤P<0.001. Statistical analysis in Supplementary Table 1.
Extended Data Fig. 7 |
Extended Data Fig. 7 |. Gene expression gradient along the anterior-posterior axis of the DCN
(a) Experimental design of single nucleus RNA sequencing of DCN neurons. (b) Uniform Manifold Approximation and Projection for Dimension Reduction (UMAP) plot of cerebellar cell types derived from microdissection of the DCN and surrounding tissues. (c) Principal component (PC) 1 loadings of select class I and class II defining genes expressed byvGluT2+ DCN neurons. (d) Celf4 (red) and Spp1 (blue) expression level in vGluT2+ neurons in the DCN, 492 neurons (two-way ANOVA interaction P<0.001; Holm-Sidak’s, P<0.001, P<0.001, P<0.001, P<0.001). (e, f) vGluT2 (red, e, f), Spp1 (green, e) and Celf4 (green, f) expression in the aDCN. Scale bar, 25 μm. (g) PC embedding of Miat expression, fluorescent in situ hybridization (FISH) and quantification of Miat levels in vGluT2+ neurons in the three major cerebellar nuclei (n=1,434 neurons, one-way ANOVA P<0.001; Holm-Sidak’s, P=0.165, P<0.001, P<0.001). (h) PC embedding of Crhr1 expression, FISH, and quantification of Crhr1 levels in Miat+ neurons in the three major cerebellar nuclei (n=1,434 neurons, one-way ANOVA P<0.001; Holm-Sidak’s, P=0.003, P=0.006, P<0.001). (i) PC embedding of Dpp10 expression, FISH, and quantification of Dpp10 levels in Celf4+ neurons in the three major cerebellar nuclei (n=2,261 neurons, one-way ANOVA P<0.001; Holm-Sidak’s, P<0.001, P<0.001, P<0.001). (j) PC embedding of Unc5d expression, FISH, and quantification of Unc5d levels in Celf4+ neurons in the three major cerebellar nuclei (n=2,261 neurons, one-way ANOVA P<0.001; Holm-Sidak’s, P<0.001, P<0.001, P<0.001). Scale bar, 100 μm. (k) FISH of Spp1 and Celf4 expression in vGluT2+ neurons of the interposed nucleus (left image: red, vGluT2; green, Spp1; right image: red, vGluT2; green, Celf4; n=3, unpaired t-test, P<0.001). Scale bar,100 μm. (l) FISH of Spp1 and Celf4 expression in vGluT2+ neurons in the medial nucleus (left image: red, vGluT2; green, Spp1; right image: red, vGluT2; green, Celf4; n=3, unpaired t-test, P<0.001). Scale bar, 100 μm. (m) Spp1 expression levels in vGluT2+ neurons across the three major cerebellar nuclei (n=3, one-way ANOVA P<0.001; Holm-Sidak’s, P=0.946, P<0.001, P<0.001). (n) Celf4 expression levels in vGluT2+ neurons across the three major cerebellar nuclei (n=3, one-way ANOVA P<0.001; Holm-Sidak’s, P=0.026, P<0.001, P<0.001). (o-r) Quantification of Spp1+ (o), Celf4+ (p), Spp1+Celf4+ (q) and Spp1Celf4 (r) vGluT2+ neurons across the three major cerebellar nuclei (n=3, one-way ANOVA (o) P=0.002, (p) P<0.001; Holm-Sidak’s, (o) P=0.190, P=0.005, P=0.002, (p) P=0.982, P<0.001, P<0.001, lateral versus interposed, lateral versus medial, and interposed versus medial, respectively). Data are expressed as mean ± SEM, two-sided P values, post-hoc comparisons: *P<0.05, **P<0.01, ***P<0.001; ANOVA interaction: ∞∞∞P<0.001. Statistical analysis in Supplementary Table 1.
Extended Data Fig. 8 |
Extended Data Fig. 8 |. Molecular and topographical distinctions of DCN neurons that respond to food intake
(a-f) Expression of activity-regulated transcript Homer1a (red) in the three major cerebellar nuclei following food deprivation (a, c, e) or refeeding (b, d, f). (g-l) Spp1 expression (green) in vGluT2+ neurons (blue) (g, i, k), and colocalised Spp1 (cyan, Spp1+vGluT2+ neurons) (h, j, l) in the three major cerebellar nuclei. (m-r) Celf4 expression (blue) in vGluT2+ neurons (red) (m, o, q), and colocalised Celf4 (magenta, Celf4+vGluT2+ neurons) (n, p, r) in the three major cerebellar nuclei. Scale bar, 100 μm. (s) Summary of the expression of Spp1 and Celf4 and the distribution of Homer1a+ DCN neurons. (t) Schematic of fibre photometry system. (u-w) Fibre targeting aDCN-LAT glutamatergic neurons in vGluT2::Cre mouse (u), expression of GCaMP6s (green) and vGluT2 (red) (v, w). Scale bar, 20 μm. (x-z) Heatmaps depicting ΔF/F of GCaMP6 signals in the aDCN-LAT glutamatergic neurons of ad libitum fed (x) and food-deprived (y) mice response to chow, and ad libitum fed mice response to non-food object (z, marble). Signals are aligned to the introduction of chow or non-food object (red line) (n=7 mice). (aa) Average ΔF/F of GCaMP6 signals in the aDCN-LAT glutamatergic neurons (490 nm, green, and control 405 nm, magenta). Signals are aligned to the introduction of non-food object (red line). Dark line represents the mean and lighter shaded area represents SEMs (n=7). (bb-cc) Mean (bb) and max (cc) ΔF/F GCaMP6s signals of aDCN-LAT glutamatergic neurons in response to chow, in ad libitum fed (grey) and food-deprived (red) mice, and response to non-food object in ad libitum fed mice (n=7, one-way ANOVA (bb) P<0.001, (cc) P<0.001; Holm-Sidak’s, (bb) P<0.006, P=0.475, P<0.003, (cc) P<0.009, P=0.651, P=0.011, ad libitum fed chow versus food deprivation chow, ad libitum fed chow versus non-food, food deprivation chow versus non-food, respectively). Data are expressed as mean ± SEM, two-sided P values, post-hoc comparisons: *P<0.05, **P<0.01. Statistical analysis in Supplementary Table 1.
Extended Data Fig. 9 |
Extended Data Fig. 9 |. Activation of arcuate AgRP neurons does not fully restore food intake suppression mediated by aDCN-LAT activation
(a) Schematic depicting hM3D(Gq) expression in the aDCN-LAT, ChR2 expression and fibre implant in the arcuate nucleus (ARC) of a AgRP::Cre; Ai32 mouse for either individual or simultaneous activation. (b, c) ChR2-eYFP expression in AgRP ARC neurons (b) and hM3d(Gq) expression in the aDCN (c). Scale bar, 500 μm in b, 1000 μm in c. (d) Chow intake following AgRP neuron activation in ad libitum state (blue), aDCN neuron activation in food-deprived state (red), or AgRP and aDCN neuron activation in food-deprived state (pink) (n=11, repeated measures one-way ANOVA, P=0.001; Holm-Sidak’s, P<0.001, P<0.001, P=0.024). Data are expressed as mean ± SEM, two-sided P values, post-hoc comparisons: *P<0.05, **P<0.01, ***P<0.001. Statistical analysis in Supplementary Table 1.
Extended Data Fig. 10 |
Extended Data Fig. 10 |. Activation of aDCN neurons robustly increases striatal dopamine signalling that correlates with reduced food intake
(a) Schematic depicting hM3D(Gq) expression in the DCN combined with GRABDA expression and fibre implant in the ventral striatum which receives projections from the ventral tegmental area (VTA) dopamine (DA) neurons,. (b) GRABDA expression and fibre placement in the ventral striatum. Scale bar, 1000 μm. (c, d) Average ΔF/F of GRABDA signals in the ventral striatum of food-deprived mCherry control (c) or aDCN-LAT hM3D(Gq) (d) mice treated with vehicle or CNO. Signals are aligned to the vehicle or CNO injection (red line). Dark line represents the mean and lighter shaded area represents SEMs. Corresponding heatmaps (right) depict ΔF/F of GRABDA signals in each mouse (n=6 control mice, grey; n=6 hM3D(Gq) aDCN-LAT mice, green). (e) Average ΔF/F of GRABDA signals in 3-min bins (n=6 control mice, grey; n=6 hM3D(Gq) aDCN-LAT mice, repeated measures two-way ANOVA interaction P<0.001, main effect P<0.001; Holm-Sidak’s, P=0.027/=0.397/=0.625 (12–15 min), P<0.001/<0.001/<0.001 (15–18 min), P<0.001/<0.001/<0.001 (18–21 min), P<0.001/<0.001/<0.001 (21–24 min), P<0.001/<0.001/<0.001 (24–27 min), P<0.001/<0.001/<0.001 (27–30 min), hM3D(Gq) CNO to hM3D(Gq) vehicle/control CNO/control vehicle respectively). (f) Maximum ΔF/F of GRABDA signals in the ventral striatum of vehicle or CNO treated food-deprived mice with aDCN-LAT hM3D(Gq) (n=6, paired t-test, P=0.011). (g) Mean ΔF/F of GRABDA signals in the ventral striatum (n=6, paired t-test, P=0.002). (h) Maximum ΔF/F of GRABDA signals in the ventral striatum of vehicle or CNO treated food-deprived mice with aDCN mCherry control mice (n=6, paired t-test, P=0.242). (i) Mean ΔF/F of GRABDA signals in the ventral striatum of vehicle or CNO treated food-deprived mice with aDCN mCherry control mice (n=6, paired t-test, P=0.418). (j) Scatter plot comparing changes in GRABDA signals to amount of chow consumed in 1 h following activation of the aDCN in hM3D(Gq)-expressing mice treated with CNO (n=13, Pearson correlation). (k) Average ΔF/F of GRABDA signals in the ventral striatum of food-deprived aDCN-INT hM3D(Gq) mice treated with vehicle or CNO. Signals are aligned to the vehicle or CNO injection (red line). Dark line represents the mean and lighter shaded area represents SEMs. Corresponding heatmaps (right) depict ΔF/F of GRABDA signals in each mouse (n=7). (l) Average ΔF/F of GRABDA signals in 3-min bins following vehicle or CNO treatment of the aDCN-INT with hM3D(Gq) (n=7, repeated measures two-way ANOVA interaction P=0.301). (m) Maximum ΔF/F of GRABDA signals in the ventral striatum of vehicle or CNO treated food-deprived mice with aDCN-INT hM3D(Gq) mice (n=7, paired t-test, P=0.410). (n) Mean ΔF/F of GRABDA signals in the ventral striatum of vehicle or CNO treated food-deprived mice with aDCN-INT hM3D(Gq) mice (n=7, paired t-test, P=0.367). Data are expressed as mean ± SEM, two-sided P values, t-tests and post-hoc comparisons: *P<0.05, **P<0.01, ***P<0.001; ANOVA interaction: ∞∞∞P<0.001; ANOVA main effect of group: ¤¤¤P<0.001. Statistical analysis in Supplementary Table 1.
Extended Data Fig. 11 |
Extended Data Fig. 11 |. Selective activation of glutamatergic aDCN neurons is sufficient to induce striatal dopamine surge and suppression of food intake
(a) Schematic depicting hM3D(Gq) expression in the DCN combined with GRABDA expression and fibre implant in the striatum of a vGluT2::Cre mouse. (b-d) IHC analysis of Cre dependent hM3D(Gq) expression in the DCN of vGluT2::Cre mouse (green, vGluT2, red, hM3D(Gq), blue, DAPI). Scale bar, 25 μm in b-d. (e) Average ΔF/F of GRABDA signals in the ventral striatum of food-deprived mice expressing hM3D(Gq) in glutamatergic neurons of the aDCN-LAT following vehicle or CNO injection. Signals are aligned to the vehicle or CNO injection (red line). Dark line represents the mean and lighter shaded area represents SEMs. Corresponding heatmaps (right) depict ΔF/F of GRABDA signals in each mouse (n=7). (f) Average ΔF/F of GRABDA signals in the ventral striatum of food-deprived mice expressing hM3D(Gq) in glutamatergic neurons of the aDCN-INT following vehicle or CNO injection. Signals are aligned to the vehicle or CNO injection (red line). Dark line represents the mean and lighter shaded area represents SEMs. Corresponding heatmaps (right) depict ΔF/F of GRABDA signals in each mouse (n=6). (g) Average ΔF/F of GRABDA signals in 3-min bins of food-deprived mice expressing hM3D(Gq) in glutamatergic neurons of the aDCN-INT or aDCN-LAT (n=7 vGluT2 aDCN-LAT mice, green, n=6 vGluT2 aDCN-INT mice, grey, two-way ANOVA, interaction P<0.001, main effect P<0.001; Holm-Sidak’s, P=0.001/=0.001/<0.001 (9–12 min), P<0.001/<0.001/<0.001 (12–15 min), P<0.001/<0.001/<0.001 (15–18 min), P<0.001/<0.001/<0.001 (18–21 min), P<0.001/<0.001/<0.001 (21–24 min), P<0.001/<0.001/<0.001 (24–27 min), P<0.001/ <0.001/<0.001 (27–30 min), aDCN-LAT CNO to vehicle/aDCN-INT CNO/aDCN-INT vehicle respectively). (h) Maximum ΔF/F GRABDA signals in the ventral striatum of food-deprived mice expressing hM3D(Gq) in glutamatergic neurons of the aDCN-LAT following vehicle or CNO treatment (n=7, paired t-test, P<0.001). (i) Mean ΔF/F GRABDA signals in the ventral striatum of food-deprived mice expressing hM3D(Gq) in glutamatergic neurons of the aDCN-LAT following vehicle or CNO treatment (n=7, paired t-test, P=0.001). (j) Maximum ΔF/F GRABDA signals in the ventral striatum of food-deprived mice expressing hM3D(Gq) in glutamatergic neurons of the aDCN-INT following vehicle or CNO treatment (n=6, paired t-test, P=0.644). (k) Mean ΔF/F GRABDA signals in the ventral striatum of food-deprived mice expressing hM3D(Gq) in glutamatergic neurons of the aDCN-INT following vehicle or CNO treatment (n=6, paired t-test, P=0.367). (l) Maximum ΔF/F GRABDA signals in the striatum following non-specific aDCN-LAT activation or vGluT2+ aDCN-LAT neuron activation (aDCN-LAT: n=6 mice, vGluT2 aDCN-LAT: n=7, unpaired t-test, P=0.250). (m) Mean ΔF/F GRABDA signals in the striatum of following non-specific aDCN-LAT activation or vGluT2+ aDCN-LAT neuron activation (aDCN-LAT: n=6 mice, vGluT2 aDCN-LAT: n=7, unpaired t-test, P=0.323). (n) Plot of GRABDA signals and corresponding food intake in food-deprived mice treated following glutamatergic aDCN activation (n=13, Pearson correlation). Solid line indicates the linear trend line fit to the data. Data are expressed as mean ± SEM, two-sided P values, t-tests and post-hoc comparisons: **P<0.01, ***P<0.001; ANOVA interaction: ∞∞∞P<0.001; ANOVA main effect of group: ¤¤¤P<0.001. Statistical analysis in Supplementary Table 1.
Extended Data Fig. 12 |
Extended Data Fig. 12 |. Increased striatal dopamine suppresses food intake
(a) Schematic depicting hM3D(Gq) expression in the VTA of a DAT::Cre mouse, and GRABDA expression and fibre implant in the ventral striatum. (b-c) Representative images of hM3D(Gq) expression in the VTA (b), and GRABDA expression and fibre track in the ventral striatum (c) of a DAT::Cre mouse. Scale bar, 500 μm in B, 200 μm in C. (d) Average ΔF/F of GRABDA signals in 3-min bins following VTA neuron activation with vehicle and varying concentrations of CNO (0.025 mg/Kg, 0.25 mg/Kg, 1 mg/Kg and 2.5 mg/Kg; n=8 per group, repeated measures two-way ANOVA interaction P<0.001, main effect P<0.001; Holm-Sidak’s). (e) Net area under curve ΔF/F of GRABDA signals following VTA neuron activation with vehicle and varying concentrations of CNO (0.025 mg/Kg, 0.25 mg/Kg, 1 mg/Kg and 2.5 mg/Kg; n=8 per group, repeated measures one-way ANOVA P<0.001; Holm-Sidak’s, P=0.012 (vehicle versus 0.025 mg/Kg), P=0.010 (vehicle versus 0.25 mg/Kg), P=0.023 (vehicle versus 1.0 mg/Kg), P=0.010 (vehicle versus 2.5 mg/Kg)). (f) Food intake of food-deprived mice following VTA neuron activation with vehicle and varying concentrations of CNO (0.025 mg/Kg, 0.25 mg/Kg, 1 mg/Kg and 2.5 mg/Kg; n=8 per group, repeated measures one-way ANOVA P<0.001; Holm-Sidak’s, P<0.001 (vehicle versus 0.025 mg/Kg), P<0.001 (vehicle versus 0.25 mg/Kg), P<0.001 (vehicle versus 1.0 mg/Kg), P<0.001 (vehicle versus 2.5 mg/Kg)). (g) Plot of GRABDA signals and corresponding food intake in food-deprived mice treated following VTA neuron activation (n=8 per group, Pearson correlation). Solid line indicates the linear trend line fit to the data. (h) Average ΔF/F of GRABDA signals from 0 to 30 min following treatment with vehicle and varying concentrations of CNO (n=8 per group, repeated measures one-way ANOVA P<0.001; Holm-Sidak’s, P=0.004 (vehicle versus 0.025 mg/Kg), P=0.004 (vehicle versus 0.25 mg/Kg), P=0.004 (vehicle versus 1.0 mg/Kg), P=0.004 (vehicle versus 2.5 mg/Kg)). (i) Maximum ΔF/F of GRABDA signals following treatment with vehicle and varying concentrations of CNO (n=8 per group, repeated measures one-way ANOVA P=0.023; Holm-Sidak’s, P=0.034 (vehicle versus 2.5 mg/Kg)). (j) Average ΔF/F of GRABDA signals during presentation of food in fasted mice following treatment with vehicle and varying concentrations of CNO (0.025, 0.25, 1.0 and 2.5 mg/Kg). Signals are aligned to food presentation. Dark lines represent mean values and lighter shaded areas represent SEM (n=8). (k) Heatmaps reporting ΔF/F of GRABDA signals in individual mice in (j) (n=8). (l) Maximum ΔF/F of GRABDA signals during food presentation in mice following treatment with vehicle and varying concentrations of CNO (n=8 per group, one-way ANOVA P=0.0117; Holm-Sidak’s, P=0.0389 (vehicle versus 0.25 mg/Kg), P=0.0056 (vehicle versus 1.0 mg/Kg), P=0.0121 (vehicle versus 2.5 mg/Kg)). (m) Scatter plot depicting the maximal ΔF/F GRABDA response to food following pre-stimulation of VTA DA neurons and the associated amount of food intake following pre-stimulation of VTA DA neurons (n=8 per group, Pearson correlation, P<0.01). Solid line shows the linear trend line fit to the data. (n-p) Images of hM4D(Gi) expression (red) in TH+, VTA neurons (green) of a DAT::Cre mouse (n). Higher magnification of white box (o-p). Scale bar, 500 μm (n), 50 μm (p). (q) Neurons transduced with hM4D(Gi) in the VTA and SNC (n=3, 1047, 2745, 2710 neurons each mouse, unpaired t-test, P=0.02). (r) Average ΔF/F of DA signals in aDCN-LAT hM3D(Gq) mice and aDCN-LAT hM3D(Gq); VTA hM4D(Gi) mice (n=6 per group, unpaired t-test, P=0.003). (g) Distance travelled by aDCN-LAT hM3D(Gq) mice and aDCN-LAT hM3D(Gq); VTA hM4D(Gi) mice during a 10-min open field session (n=6 and 7, respectively, unpaired t-test, P=0.382). Data are expressed as mean ± SEM, two-sided P values, t-tests and post-hoc comparisons: *P<0.05, **P<0.01, ***P<0.001; ANOVA interaction: ∞∞∞P<0.001; ANOVA main effect of group: ¤¤¤P<0.001. SNC, substantia nigra pars compacta; TH, tyrosine hydroxylase; VTA, ventral tegmental area. Statistical analysis in Supplementary Table 1.
Extended Data Fig. 13 |
Extended Data Fig. 13 |. Proposed role of the cerebellum in feeding control
The cerebellum is well-positioned to integrate homeostatic satiation signals and is capable of orchestrating adaptive feeding responses by modulating motor, cognitive, affective and endocrine functions,–. Visual, gustatory and olfactory inputs are all known to activate the cerebellum which could provide salience update to control appetitive drive. It functions as a comparator of physiological nutrient state (interoception) and post-ingestion nutritional outcome (nutrient feedback) to fine-tune predictive reward signals (reward network) and ultimately influence meal size (feeding network). While cerebellar output has been shown to influence VTA neuron activity,, our observed changes in DA signalling are tightly associated with decreases in food intake, suggesting a dedicated role of the cerebellum in regulating DA circuits that influence feeding that is distinct from motor or social behaviours. Based on our mechanistic studies into the changes in the reward system mediated by the cerebellum, it is possible that previously discovered differences between PWS and control subjects arise because of cerebellar alterations,,. In response to a predicted meal size (predicted nutritional reward outcome) by either food cues or food, cerebellar activity increases dopamine efflux that blunts dopamine transients. Consequently, the reward value of consuming food reduces and meals are terminated. In PWS patients,,, food-dependent cerebellar activity is absent and thus, dopamine transients remain regardless of amount of food consumed, leading to excessive eating. Conversely, in dopamine-deficient animals, there is a complete absence of drive to eat. A better understanding of the mechanisms and circuits underlying cerebellar-mediated behaviours can guide brain stimulation strategies to control food intake recently shown to have the capability of ameliorating symptoms for disorders associated with the cerebellum.
Fig. 1 |
Fig. 1 |. The deep cerebellum is activated by food
(a) Hunger state-dependent responses to food cues in brains of subjects with Prader-Willi syndrome (PWS) and controls, centred on the peak voxel of activation (MNI coordinates: −24, −49, −38) exceeding a significance threshold of P<0.01, uncorrected, and an extent threshold of k=50 (n=14/group). (b) Post-hoc analysis of signal change (beta estimates from the cerebellar cluster in a) in response to food vs. non-food cues in the fasting and post-meal groups of hyperphagia and control subjects (n=14/group, full factorial ANOVA). (c, d) Homer1a expression (red) and DAPI (blue) in the lateral nucleus of the DCN of food-deprived (c) and refed (d) mice. Scale bar, 100 μm. (e) Number of Homer1a+ DCN neurons (n=3/group, unpaired t-test). (f) Homer1a expression level in individual lateral nucleus neurons (n=3/group, unpaired t-test). Data expressed as mean±SEM, and two-sided P values. Cbx, cerebellar cortex; Lat, lateral nucleus. Statistical analysis in Supplementary Table 1.
Fig. 2 |
Fig. 2 |. Activation of aDCN suppresses food intake without metabolic compensation
(a) hM3D(Gq) expression in aDCN-LAT (grey: SMI32, red: hM3D(Gq)). Scale bar, 500 μm. (b) 1-h food intake in food-deprived mice with aDCN-LAT activation (n=19, paired t-test). (c) hM3D(Gq) expression in aDCN-INT (grey: SMI32, red: hM3D(Gq)). Scale bar, 500 μm. (d) 1-h food intake in food-deprived mice with aDCN-INT activation (n=16, paired t-test). (e) Satiation (meal size) and satiety (inter-meal interval) as mechanisms of food intake reduction. (f) Meal size following 24-h food deprivation (mCherry: n=8, aDCN-LAT; hM3D(Gq): n=9, aDCN-INT; hM3D(Gq): n=16, two-way ANOVA, Holm-Sidak’s). (g) Number of meals consumed during 1-h chow intake following 24-h food deprivation (mCherry: n=8, aDCN-LAT: n=9, aDCN-INT: n=16, two-way ANOVA, Holm-Sidak’s). (h) First meal size in ad libitum fed mice with aDCN-LAT inactivation (n=13, paired t-test). (i) Metabolic monitoring schematic. (j) Energy intake (EI) and expenditure (EE) (6-h, n=7 control, 8 aDCN-LAT activation, two-way ANOVA, Holm-Sidak’s). (k) Chow intake during 48-h period (n=8/group, two-way ANOVA, Holm-Sidak’s). (l) EI and EE during 48-h period (n=8/group). (m) Calorie intake of chow or HFHS diet following 24-h food deprivation (n=9; repeated measures two-way ANOVA, Holm-Sidak’s). (n) Low (Ensure®, 0.9 kcal/ml) and high (Ensure PLUS®, 1.5 kcal/ml) calorie liquid meal consumption assay. (o) Volume of intake during 1-h period (mCherry: n=13, aDCN-LAT activation: n=9, two-way ANOVA, Holm-Sidak’s). (p) Kcal consumed during 1-h period (mCherry: n=13, aDCN-LAT activation: n=9, two-way ANOVA, Holm-Sidak’s). Data expressed as mean±SEM, and two-sided P values. See Supplementary Table 1.
Fig. 3 |
Fig. 3 |. Molecular and topographical organization of nutrient-sensing DCN neurons
(a) Expression level of transcripts in class I and II glutamatergic DCN neurons. (b-c) Homer1a (red), Spp1 (green) and Celf4 (blue) expression in the aDCN. Scale bar, 50 μm. (d) Quantification of Homer1a+ neurons in the aDCN of food-deprived mice after refeeding (n=3, one-way ANOVA, Holm-Sidak’s). (e) Average GCaMP6 signal in aDCN-LAT neurons of ad libitum fed (top) or food-deprived (bottom) mice (490 nm, green, control 405 nm, magenta). Signals are aligned to the introduction of chow (red line). Dark line represents the mean and lighter shaded area represents SEMs (n=7). (f) Average GCaMP6s signal in 30-s bins of aDCN-LAT neurons in ad libitum fed (grey) or food-deprived (red) mice in response to chow (dotted line) (n=7, repeated measures two-way ANOVA). (g) Expression of hM3D(Gq) (red) in aDCN-LAT neurons of vGluT2::Cre mouse. Scale bar, 1000 μm. (h) Chow intake in food-deprived mice with aDCN-LAT vGluT2 neuron activation (n=14, paired t-test). (i) Chow intake in food-deprived mice with aDCN-INT vGluT2 neuron activation (n=12, paired t-test). Data expressed as mean±SEM, two-sided P values. See Supplementary Table 1.
Fig. 4 |
Fig. 4 |. aDCN suppresses food intake via hedonic, but not homeostatic, signaling
(a) Schematic depicting experimental paradigm: hM3D(Gq) in the aDCN and hM4D(Gi) in VTA-DA neurons, and GRABDA and fibre in the ventral striatum of a DAT::Cre mouse. (b) Experimental timeline. (c) Average GRABDA signal in 3-min bins (n=6/group, repeated measures two-way ANOVA). (d) Food intake in mice with aDCN-LAT activation alone or mice with aDCN-LAT activation and VTA-DA neuron inhibition (n=7, repeated measures one-way ANOVA, Holm-Sidak’s). (e) Food intake and average GRABDA signal (n=13, respectively, Pearson correlation). (f) Fibre photometry recording of GRABDA to food presentation in CNO-treated, food-deprived mice. (g) GRABDA signals in the ventral striatum. Signals are aligned to the food presentation (red line). Dark line represents mean and lighter shaded area represents SEMs (n=6 control, 7 aDCN-LAT-hM3D(Gq)). (h) Maximum DA signal (n=6 control, 7 aDCN-LAT-hM3D(Gq), unpaired t-test). (i) Average GRABDA signal in the ventral striatum. Signals are aligned to the food presentation (red line). Dark line represents the mean and lighter shaded area represents SEMs (n=7 control, n=6 aDCN-LAT hM3D(Gq); VTA hM4D(Gi)). (j) Maximum DA signal (n=7 control, n=6 aDCN-LAT hM3D(Gq); VTA hM4D(Gi), unpaired t-test). Data are expressed as mean±SEM, two-sided P values. ARC, arcuate nucleus; VTA, ventral tegmental area. See Supplementary Table 1.

Comment in

References

    1. Berthoud HR & Morrison C. The brain, appetite, and obesity. Annu Rev Psychol 59, 55–92, doi:10.1146/annurev.psych.59.103006.093551 (2008). - DOI - PubMed
    1. Speakman JR A nonadaptive scenario explaining the genetic predisposition to obesity: the “predation release” hypothesis. Cell Metab 6, 5–12, doi:10.1016/j.cmet.2007.06.004 (2007). - DOI - PubMed
    1. Rossi MA & Stuber GD Overlapping Brain Circuits for Homeostatic and Hedonic Feeding. Cell Metab 27, 42–56, doi:10.1016/j.cmet.2017.09.021 (2018). - DOI - PMC - PubMed
    1. Woods SC & Ramsay DS Food intake, metabolism and homeostasis. Physiol Behav 104, 4–7, doi:10.1016/j.physbeh.2011.04.026 (2011). - DOI - PMC - PubMed
    1. Berthoud HR The neurobiology of food intake in an obesogenic environment. Proc Nutr Soc 71, 478–487, doi:10.1017/S0029665112000602 (2012). - DOI - PMC - PubMed

Publication types

MeSH terms