. 2021 Nov;599(7886):684-691.
doi: 10.1038/s41586-021-04081-2. Epub 2021 Nov 17.

Cell-type specialization is encoded by specific chromatin topologies

Affiliations

Cell-type specialization is encoded by specific chromatin topologies

Warren Winick-Ng et al. Nature. 2021 Nov.

Abstract

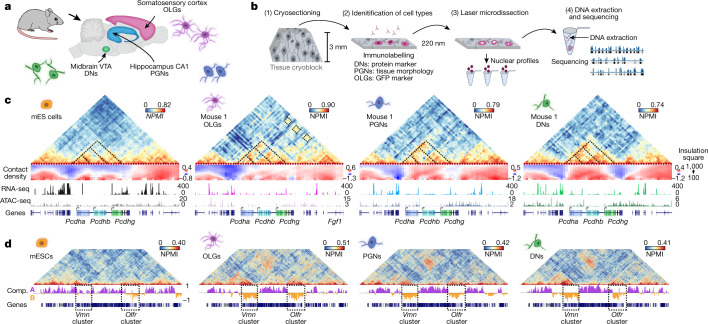
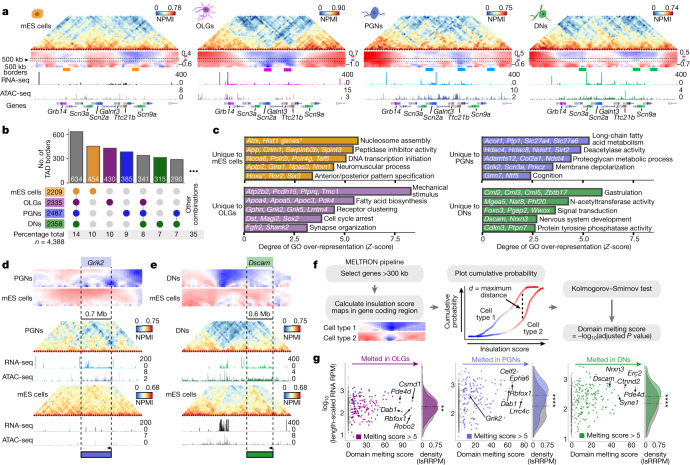
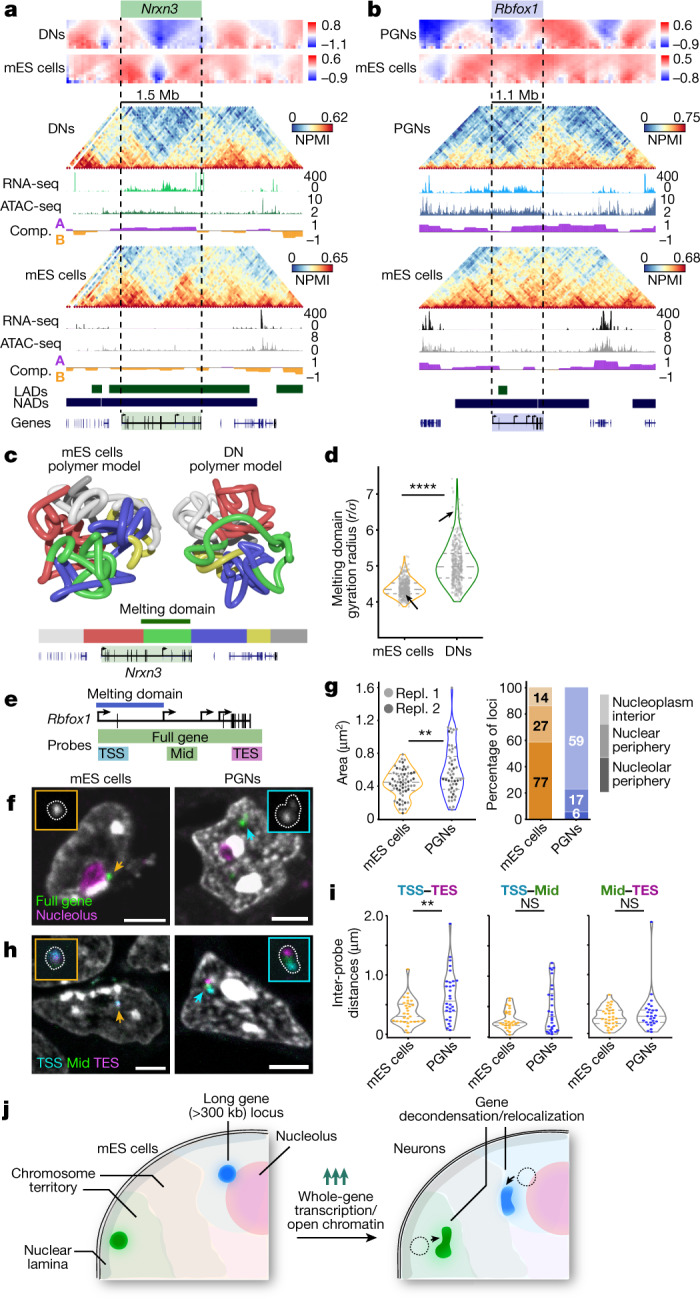
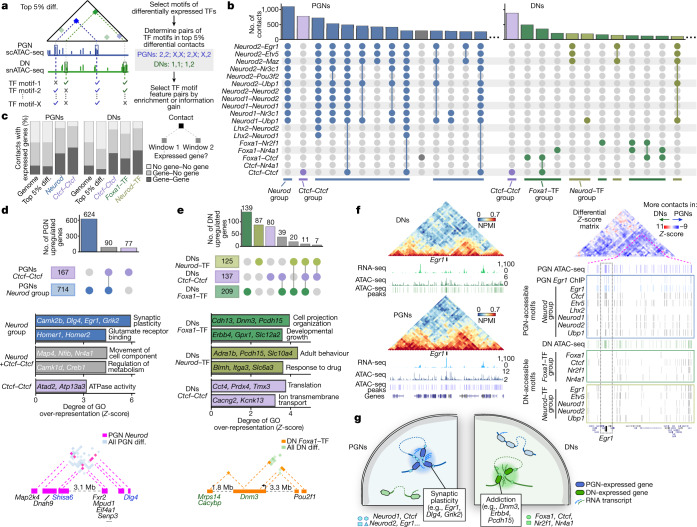
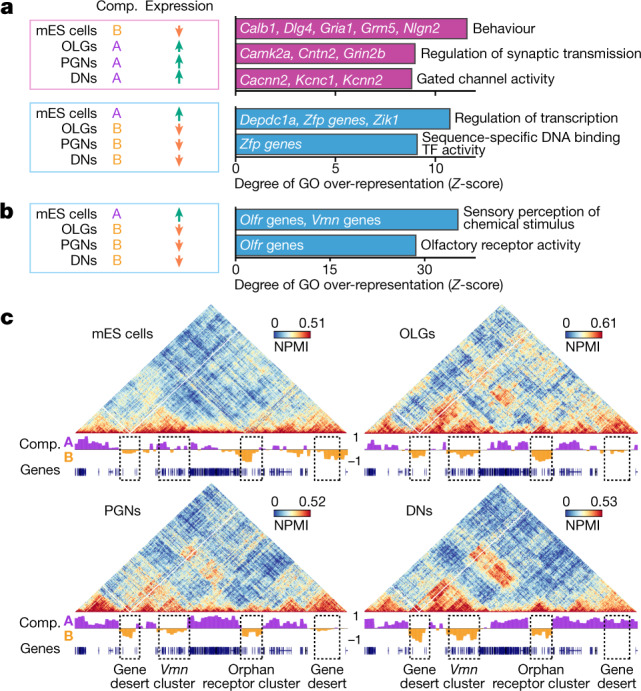
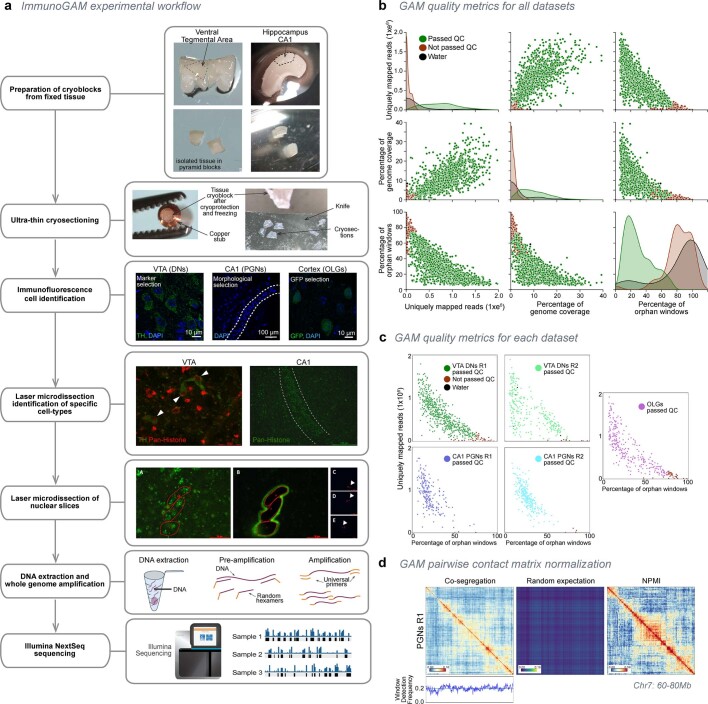
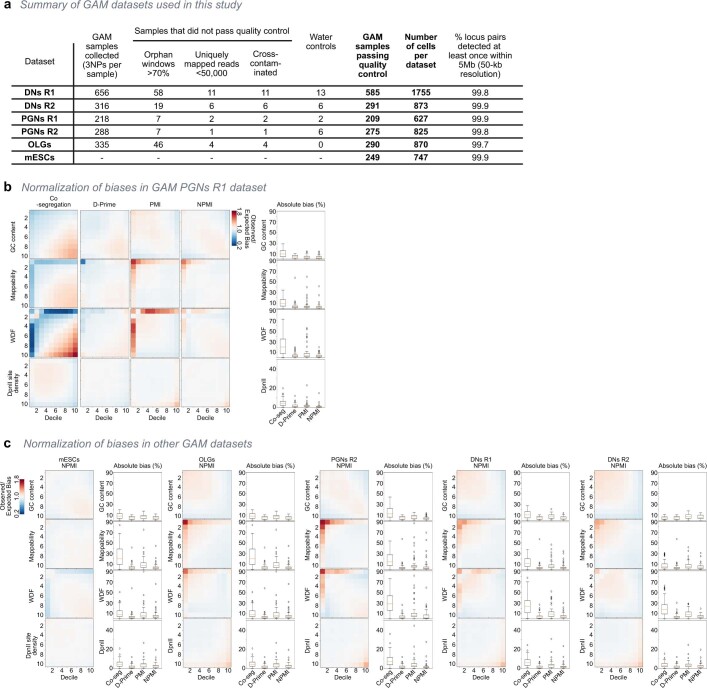
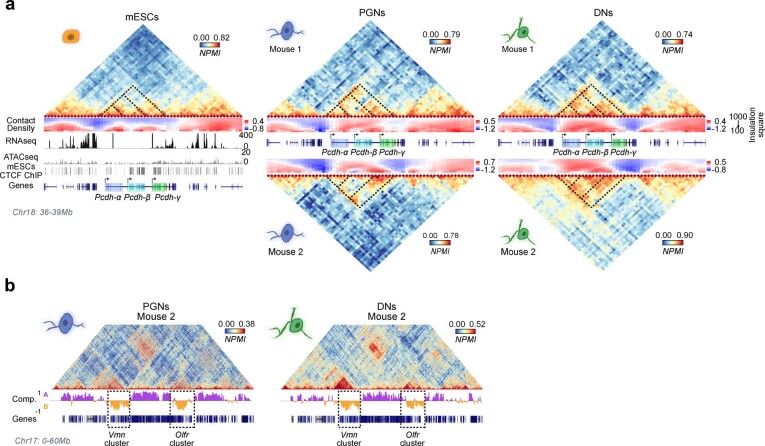
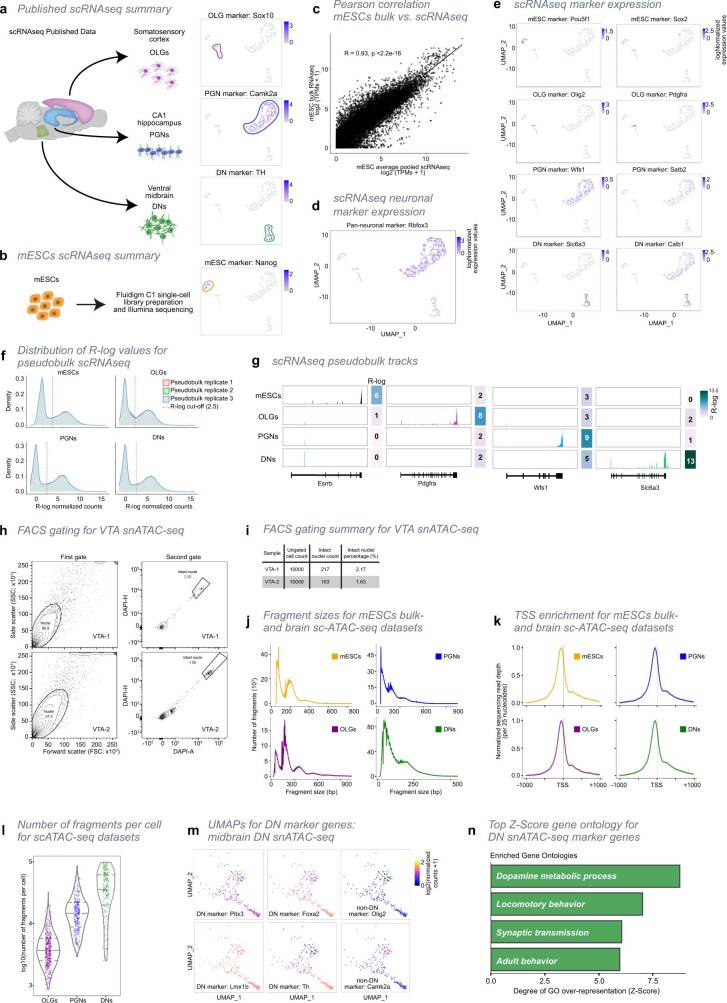
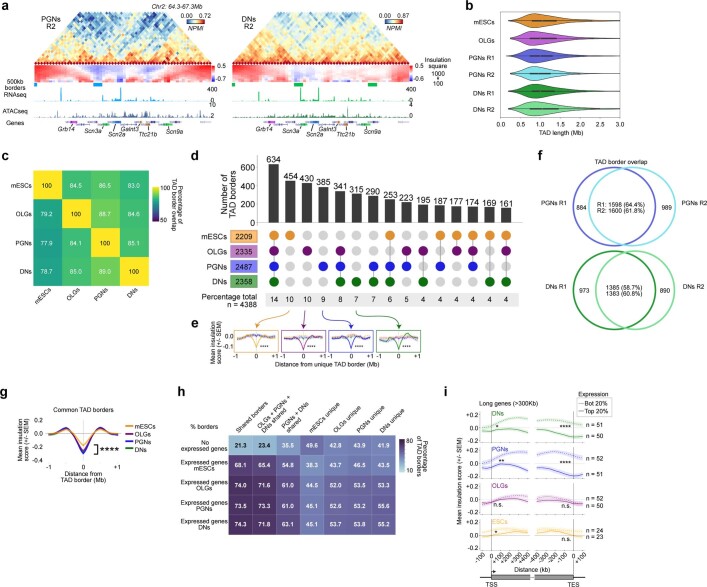
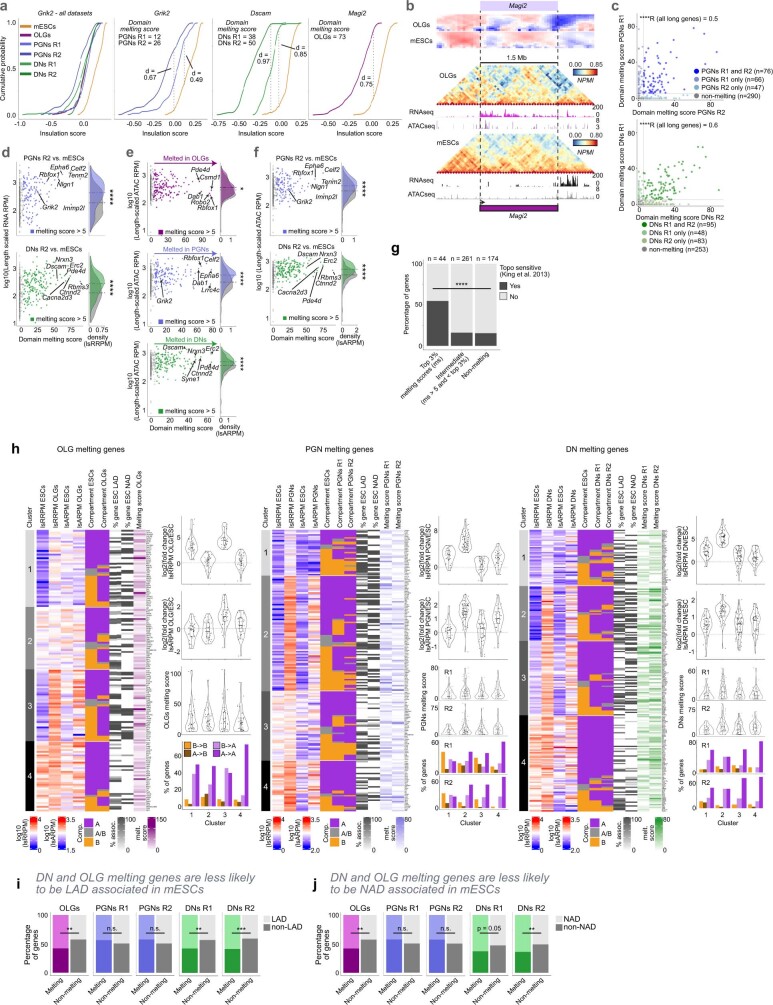
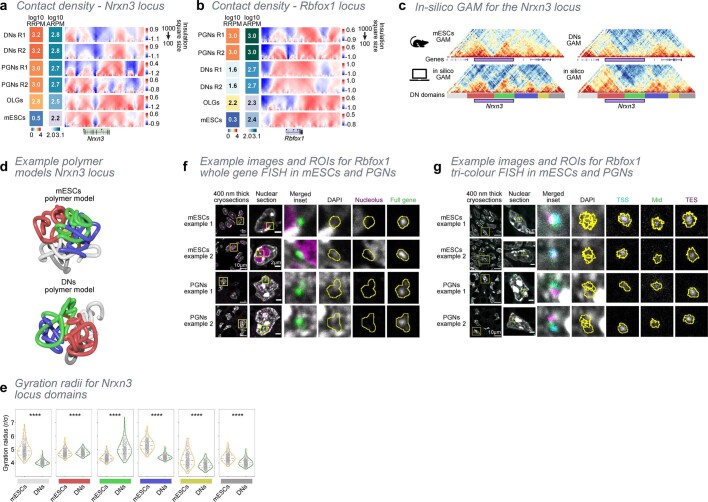
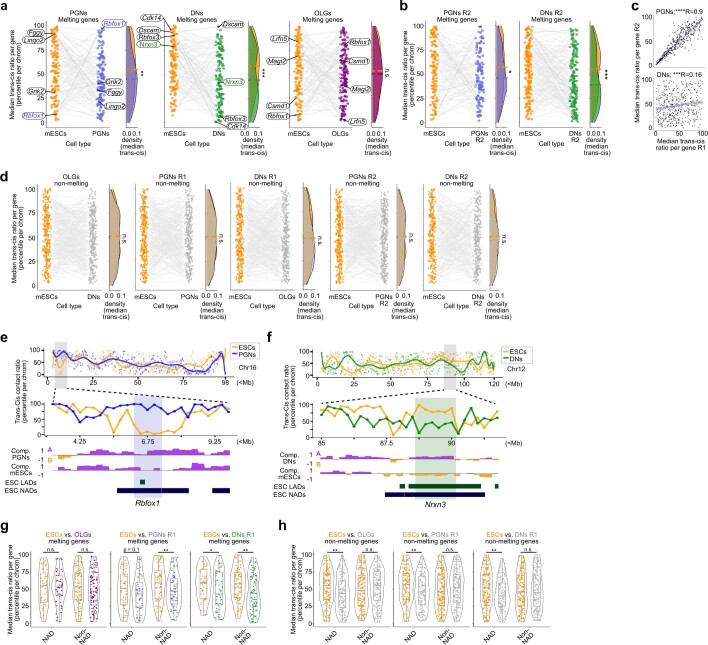
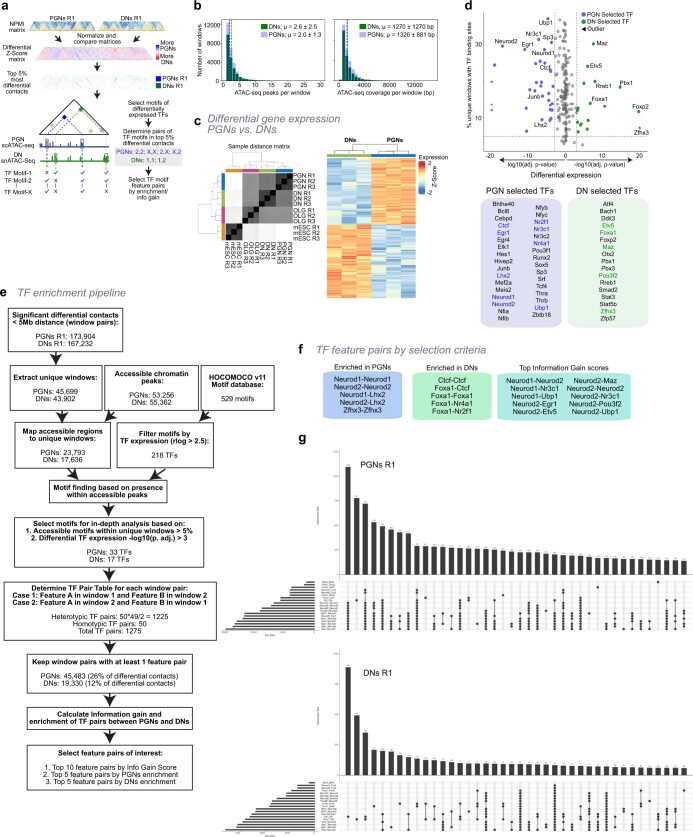
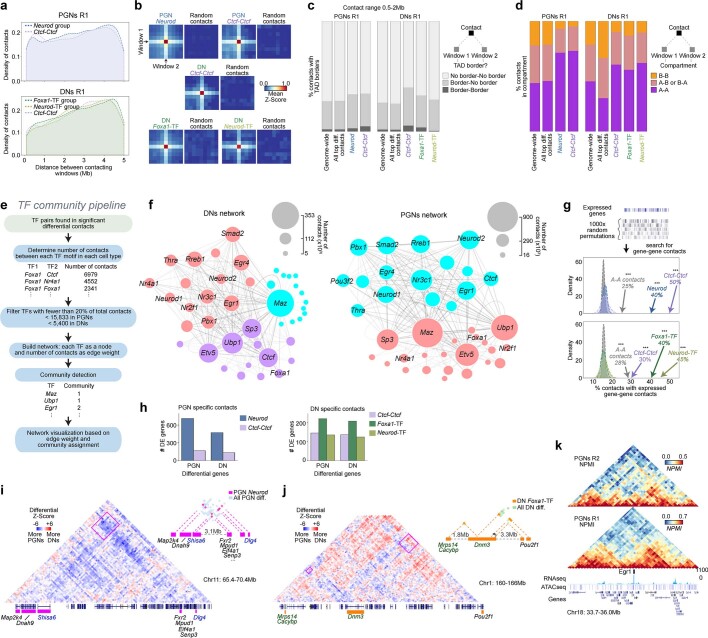
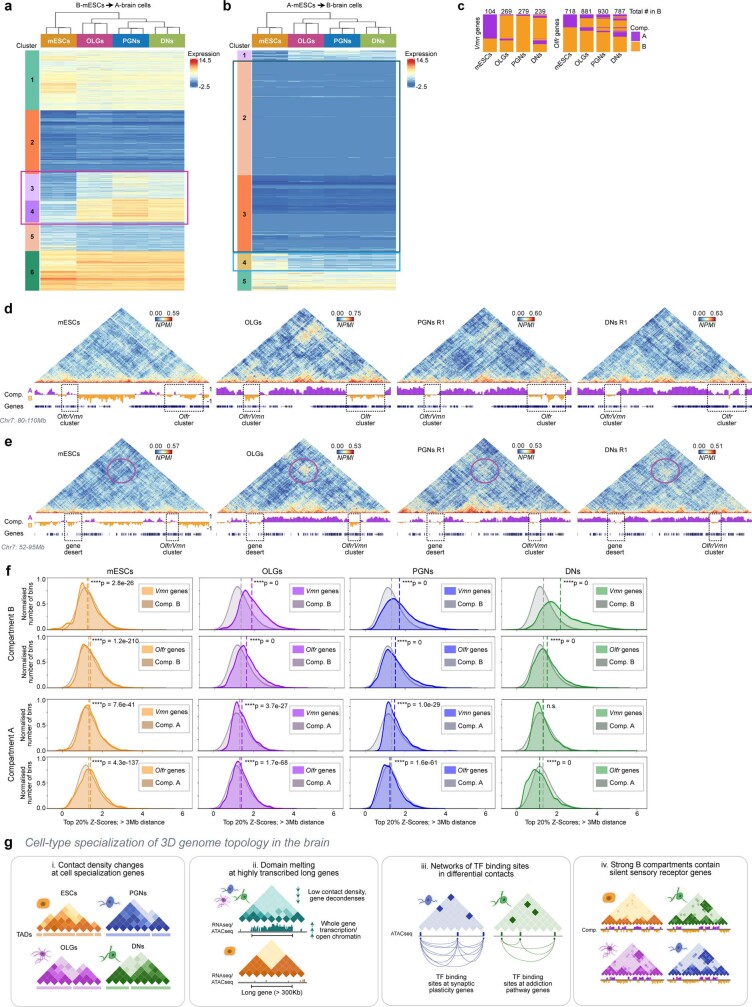
The three-dimensional (3D) structure of chromatin is intrinsically associated with gene regulation and cell function1-3. Methods based on chromatin conformation capture have mapped chromatin structures in neuronal systems such as in vitro differentiated neurons, neurons isolated through fluorescence-activated cell sorting from cortical tissues pooled from different animals and from dissociated whole hippocampi4-6. However, changes in chromatin organization captured by imaging, such as the relocation of Bdnf away from the nuclear periphery after activation7, are invisible with such approaches8. Here we developed immunoGAM, an extension of genome architecture mapping (GAM)2,9, to map 3D chromatin topology genome-wide in specific brain cell types, without tissue disruption, from single animals. GAM is a ligation-free technology that maps genome topology by sequencing the DNA content from thin (about 220 nm) nuclear cryosections. Chromatin interactions are identified from the increased probability of co-segregation of contacting loci across a collection of nuclear slices. ImmunoGAM expands the scope of GAM to enable the selection of specific cell types using low cell numbers (approximately 1,000 cells) within a complex tissue and avoids tissue dissociation2,10. We report cell-type specialized 3D chromatin structures at multiple genomic scales that relate to patterns of gene expression. We discover extensive 'melting' of long genes when they are highly expressed and/or have high chromatin accessibility. The contacts most specific of neuron subtypes contain genes associated with specialized processes, such as addiction and synaptic plasticity, which harbour putative binding sites for neuronal transcription factors within accessible chromatin regions. Moreover, sensory receptor genes are preferentially found in heterochromatic compartments in brain cells, which establish strong contacts across tens of megabases. Our results demonstrate that highly specific chromatin conformations in brain cells are tightly related to gene regulation mechanisms and specialized functions.


Conflict of interest statement

In the past 3 years, S.A.T. has acted as a consultant for Genentech and Roche, and is a remunerated member of Scientific Advisory Boards of Biogen, GlaxoSmithKline and Foresite Labs. A.P. and M.N. hold a patent on GAM.

Figures

Fig. 1
Fig. 1. ImmunoGAM captures cell-type-specific chromatin contacts in the mouse brain.
a, ImmunoGAM was applied to three brain cell types: OLGs, DNs and PGNs (one independent biological replicate for OLGs and two replicates for DNs and PGNs). b, Schematic of the ImmunoGAM workflow. OLGs were selected by immunolabelling with GFP, DNs with tyrosine hydroxylase and PGNs using tissue morphology. Nuclear profiles were laser microdissected, each from a single cell, with three collected together, as described for multiplex-GAM. c, Example of cell-type-specific contact differences at the Pcdh locus (chromosome 18: 36–39 Mb). GAM matrices represent co-segregation frequencies of 50-kb genomic windows using normalized pointwise mutual information (NPMI). Dashed lines illustrate cell-type differences. NPMI scales range between 0 and 99th percentile per cell type. Contact density heatmaps represent insulation scores using 100–1,000 kb square sizes. RNA-seq and ATAC-seq tracks represent normalized pseudobulk reads from scRNA-seq and scATAC-seq, respectively, except for bulk ATAC-seq from mES cells. d, Strong contacts between Vmn and Olfr receptor gene clusters on chromosome 17 (0–60 Mb) within B compartments (Comp.), separated by ~35 Mb, are observed in brain cells but not in mES cells. Compartments A and B were classified using normalized PCA eigenvectors. Source data
Fig. 2
Fig. 2. Chromatin domains rearrange extensively in brain cells, notably at long genes that undergo melting events.
a, Example of cell-type-specific contacts at genomic regions (chromosome 2: 64.3–67.3 Mb) with differential expression. Dashed boxes represent 500 kb insulation scores used to determine TAD boundaries (indicated with coloured boxes below). Replicate 1 is shown for brain cells. b, UpSet plots representing multiway TAD boundary comparisons show extensive cell-type specificity. Boundaries were defined as 150 kb genomic regions centred on the lowest insulation score windows and were considered different when separated by >50 kb edge-to-edge. c, Cell-type-specific borders contain genes with GO terms relevant for cell functions. The top four GO terms were the most enriched, and the fifth was selected (over-representation measured by Z-score; one-sided Fisher’s exact permuted P values < 0.01). Asterisk indicates multiple Hist1 genes. d, e, Grik2 and Dscam overlap with cell-type-specific TAD borders and extensively decondense, or ‘melt’, in PGNs and DNs, respectively. f, The MELTRON pipeline was applied at long genes (>300 kb, 479 genes) to determine melting scores from contact density maps that represent insulation score values using 100–1,000 kb squares. Genes were considered to melt if the melting score computed across their coding region was >5 (P < 1 × 10−5; one-sided Kolmogorov–Smirnov testing using maximum distances between distributions). g, Melting associates with higher expression, especially in PGNs and DNs (two-sided Wilcoxon rank-sum test; **P < 0.01, ****P < 0.0001; P values from left to right, P = 3.5 × 10−3, P = 1.8 × 10−8, P = 8.3 × 10−6). lsRRPM, length-scaled RNA reads per million; RPM, reads per million. Source data
Fig. 3
Fig. 3. Extensive decondensation and relocalization of highly expressed long neuronal genes.
a, b, Examples of two melting genes. Nrxn3 occupies two dense TADs in mES cells but melts in DNs where it is most highly expressed and accessible (a; chromosome 12: 87.6–92.4 Mb). Rbfox1 is highly condensed in mES cells and melts in PGNs where it is highly expressed and accessible (b; chromosome 16: 4.8–9.8 Mb). Compartment tracks are shown for each cell type, and published lamina-associated domains (LADs) and nucleolus-associated domains (NADs) for mES cells. c, Polymer models show extensive Nrxn3 melting in DNs compared to mES cells. Colour bars shows DN domain positions. d, Gyration radii of green melting domains are significantly higher in DNs than in mES cells (****P = 1.1 × 10−92; two-sided Mann–Whitney test, n = 450). Arrows indicate positions of exemplar models. e, Genomic regions covered by cryo-FISH probes across the entire Rbfox1 gene, or targeting the gene TSS, middle of the coding region (Mid) or TES (Supplementary Table 11 contains the probe list). f, Rbfox1 (pseudocoloured green) occupies small, rounded foci in mES cells, often at the nucleolus periphery (immunostained for nucleophosmin 1, ref. ; pseudocoloured purple). In PGNs, Rbfox1 occupies larger, decondensed foci away from nucleoli. Arrows indicate Rbfox1 foci in mES cells (orange) and PGNs (blue). Scale bars, 3 μm. g, Rbfox1 occupies significantly larger areas in PGNs than in mES cells (**P = 0.008; two-sided Mann–Whitney test; two experimental replicates (Repl. 1 and Repl. 2) with n = 13, 39 and 38, 25 respectively). Most Rbfox1 foci localize at the nucleolar periphery in mES cells, but away from the nucleolus in PGNs. h, Cryo-FISH experiments that target TSS, Mid and TES regions of Rbfox1 (pseudocoloured cyan, green, purple) show extensive separation in PGNs compared with mES cells. Arrows indicate Rbfox1 foci in mES cells (orange) and PGNs (blue). Scale bars, 3 μm. i, The TSS and TES regions of Rbfox1 are significantly more separated in PGNs than mES cells (two-sided Mann–Whitney test; **P < 0.01; from left to right, P = 0.003, P = 0.179, P = 0.331; NS, not significant). j, Schematics summarizing the melting of long genes in neurons, which is accompanied by locus relocalization away from repressive nuclear landmarks. Source data
Fig. 4
Fig. 4. Neuron-specific genes establish specific contacts rich in putative TF-binding sites.
a, GAM contacts from PGNs and DNs (mouse replicate 1) were normalized (Z-score) and subtracted to produce differential contacts matrices. The top 5% most differential contacts (top 5% diff.) ranged from 0.05 to 5 Mb. Contacts containing TF motifs within accessible chromatin on each contacting window were selected in the most (top five) enriched in PGNs or DNs or with the highest discriminatory power (information gain; Extended Data Fig. 9f). b, Multiple TF pairs coincide in the same PGN (left) or DN (right) differential contacts. The most abundant groups of contacts are shown for each cell type. c, Differential contacts with the most enriched combination TF feature pairs contain expressed genes in both windows. d, Differential contacts with the most abundant TF feature pairs in PGNs contain differentially expressed genes (top), with PGN-specific roles (middle; one-sided Fisher’s exact permuted P < 0.01). The top enriched GO terms show that differential contacts between PGN upregulated genes (bottom) contain genes upregulated in PGNs (blue) and other expressed genes. e, Differential contacts with the most abundant TF feature pairs in DNs contain differentially expressed genes (top) with DN-specific functions (middle; one-sided Fisher’s exact permuted P < 0.01). The top enriched GO terms show that differential contacts between DN upregulated genes (bottom) contain genes upregulated in DNs (green) and other expressed genes. f, Left, Egr1 is highly expressed (chromosome 18: 33.7–36.0 Mb) and contacts with its downstream domain in PGNs compared with DNs. Right, the differential contact matrix shows increased PGN-specific contacts in the entire region surrounding Egr1 (right). The Egr1-containing TAD (inset; chromosome 18: 34.65–35.85 Mb) has multiple putative TF-binding sites found within PGN-accessible regions, most notably surrounding the Egr1 gene (grey dashed box), not found in DNs. g, Schematics summarizing the presence of genes related to synaptic plasticity in PGN-specific contacts and to drug addiction in DN-specific contacts, with accessible chromatin harbouring binding sites for differentially expressed TFs. Source data
Fig. 5
Fig. 5. Sensory receptor gene clusters preferentially belong to B compartments in brain cells and form megabase-range interactions.
a, Selected top enriched GO terms for genes that increase expression in all brain cells relative to mES cells and move from compartment B in mES cells to compartment A in brain cells (pink box), and for genes that decrease expression in brain cells and move to compartment B compared to mES cells (blue box). All enriched GO terms had one-sided Fisher’s exact permuted P = 0. b, Top enriched GO terms for genes silent in all cell types that gain membership to compartment B in brain cells. Most genes are Olfr and Vmn sensory receptor cluster genes. All enriched GO terms had one-sided Fisher’s exact permuted P = 0. c, GAM contact matrices containing Vmn and orphan receptor genes (chromosome 7: 35–55 Mb) show large clusters of strong interactions between B compartments in OLGs, PGNs and DNs, but not mES cells. Dashed boxes indicate interacting regions. Source data
Extended Data Fig. 1
Extended Data Fig. 1. ImmunoGAM experimental pipeline and GAM data quality control.
a, ImmunoGAM experimental pipeline. VTA and CA1 dissections and cryoblock preparations are shown as examples. After fixation, brain tissue is dissected and cryopreserved in sucrose/PBS solution, before sectioning on an ultracryomicrotome (~220nm thick tissue slices; −100 °C). For confocal imaging, DAPI staining labels nuclear slices and helps to morphologically identify the CA1 PGN layer in the hippocampus, or was combined with TH immunolabelling to identify DNs in the midbrain, or with GFP immunolabelling to identify OLG lineage cells in the cortex (scale bars = 10 μm for OLGs and DNs, 100 μm for PGNs). For laser microdissection, nuclei were identified by indirect immunofluorescence using anti-pan-histone antibodies to morphologically select PGNs of the pyramidal neuron layer, or were combined with immunofluorescence detection of TH for DNs or GFP for OLGs. Laser microdissection images are shown as examples (scale bars = 30 μm for DNs, 200 μm for PGNs). Three nuclear slices were selected and laser microdissected from the tissue to fall into the same PCR lid, as described for multiplex-GAM (scale bars = 30 μm for panels a and b, 400 μm for panels c-e). Genomic DNA content was extracted from each sample and amplified using whole-genome amplification, followed by Illumina NextSeq sequencing. b, Quality control parameters (uniquely mapped reads, genome coverage of positive windows, and percentage of orphan windows; see Methods) for all combined GAM samples collected from brain cell types. Each data point represents a GAM sample. Samples passing QC are shown in green, samples not passing QC in red. c, Percentages of uniquely mapped reads and orphan windows per GAM sample, shown separately for each dataset produced in this study. Samples not passing QC are shown in red, water control samples (laser-microdissected material not containing a nuclear profile) are shown in black. d, Normalized point-wise mutual information (NPMI) normalization corrects for differences in the co-segregation matrix caused by changes in the window detection frequency (WDF; see Methods). Example shown for PGNs replicate 1 (R1; chr7:60,000,000-80,000,000). Source data
Extended Data Fig. 2
Extended Data Fig. 2. Normalization of immunoGAM data.
a, Summary of GAM datasets used in this study. VTA DNs were collected from two animals, an 8-week old wild-type mouse and a 10-week old mouse carrying a TH-GFP reporter. PGNs were collected from two 8-week old wildtype littermate mice. Cortical OLGs were collected based on detection of GFP expression from a 3-week old Sox10-cre-LoxP-GFP mouse. GAM data from mES cell (clone 46C) was previously published, and available from the 4DNucleome portal after quality control (https://data.4dnucleome.org/; Supplementary Table 1). b, 50-kb windows for PGNs R1 were divided into equally sized groups depending on their GC content, mappability, window detection frequency (WDF) or DpnII restriction density. Heatmaps of mean observed/expected bias (represented as a fold change) are shown for co-segregation, D-prime (used for previous GAM normalizations), PMI and NPMI normalizations. NPMI normalization results in the lowest absolute bias percentage for all tested categories (box plots on right). Box plot definitions were as follows: 25th percentile lower limit, 75th percentile upper limit, and center line as the median; interquartile range (IQR) was 25th to 75th percentile; upper whisker was (75th percentile + (IQR*1.5)), lower whisker was (25th percentile – (IQR*1.5)) or zero if negative; outliers outside the whiskers were indicated with open circles. n = 100 for each bias tested, representing all combinations of deciles in PGNs R1. c, Absolute bias analysis for remaining immunoGAM datasets. Box plot definitions were as in panel b. Source data
Extended Data Fig. 3
Extended Data Fig. 3. ImmunoGAM contact matrices from replicate mice.
a, GAM contact matrices centered on the Pcdh gene cluster for mESC, CA1 PGN replicate 2, and VTA DN replicate 2 (Chr18: 36,000,000-39,000,000; 50-kb resolution). ChIP-seq peaks for CTCF are shown below the mES cell matrix, showing extensive binding at the Pcdh locus. Dashed lines illustrate differences in contacts between Pcdh-α, -β and -γ genes for different cell types. Scale bars are adjusted to a range between the 0 value and the 99th percentile of NPMI values for each cell type. b, Example matrices for replicate 2 of CA1 PGN and VTA DN, for Chr17: 0-60,000,000 at 50-kb resolution. Dashed lines illustrate vomeronasal (Vmn) and olfactory (Olfr) receptor gene clusters within B compartments, separated by ~35 Mb, are observed in brain cells but not in mES cells. Compartments A/B were classified using normalized PCA eigenvectors. Source data
Extended Data Fig. 4
Extended Data Fig. 4. Curation of scRNA-seq and snATAC-seq data from published datasets and datasets produced for the present study.
a, Schematic representation of scRNA-seq datasets used in this study. We collected published scRNA-seq datasets from cortex and hippocampus, and produced scRNA-seq from midbrain. From each of the brain tissues, we select the specific cell types that were matched with those collected for the presented GAM data. The selected datasets from each cell type were combined and visualized through UMAP embedding, coloured by expression of each marker gene: Sox10 for OLGs, Camk2a for PGNs and Th for DNs. Cluster contours are drawn to highlight separation between cell types. All marker genes were found highly expressed in their respective cell types. b, scRNA-seq datasets were also generated from mES cells. UMAP clustering is coloured by the expression of Nanog. c, Pearson’s correlation plot of gene expression in mES cells (clone 46C) between published bulk versus single-cell RNA-seq. Average single-cell expression is highly correlated with bulk RNA-seq (two-sided Pearson’s R product-moment correlation; R = 0.93, p < 2.2x10⁻¹⁶). Only genes common to both datasets are represented (total genes in bulk dataset = 22822, total genes in single cell dataset = 23208, common to both = 22045). d, Single cell expression of Rbfox3, a pan-neuronal marker, overlaid on the UMAP of single cell transcriptomes. e, Additional examples of UMAPs for single cell transcriptomes of cell-type markers. Pou5f1 and Sox2 were used as markers for mES cells, Olig2 and Pdgfra for OLGs, Wfs1 and Satb2 for PGNs, and Slc6a3 and Calb1 for DNs. All markers show higher expression in their respective cell types. f, Distribution of regularized log (R-log) values for pseudobulk scRNA-seq datasets. For each cell type, cells were randomly partitioned into 3 pseudobulk replicates before pooling and normalizing reads. The distribution of R-log values is bi-modal for all cell types and pseudobulk replicates. To consider expressed genes for downstream analysis, a 2.5 R-log threshold (dashed red lines) was applied in all datasets. Genes with R-log 2.5 in all three pseudobulk replicates are considered expressed for that cell type. g, Example scRNA-seq pseudobulk tracks of sequenced reads for marker genes in each cell type. Tracks were RPKM normalized to allow for cell-type comparisons. Markers were: Esrrb for mES cells, Pdgfra for OLGs, Wfs1 for PGNs and Slc6a3 for DNs. All markers are specifically expressed in their respective cell types. h, Exemplar plots of fluorescence-activated cell sorting (FACS) and gating strategy in midbrain VTA samples. Two biological replicate samples from independent mice, VTA-1 (top) and VTA-2 (bottom) were sorted to determine percentage of intact nuclei. Debris was excluded with a first gate (left; SSC/FSC plots, n = 10000 for VTA-1 and VTA-2, a total of n = 200000 DAPI positive events were sorted) and damaged nuclei with a second gate using DAPI (right; DAPI-H/DAPI-A plots, n=8687 and 8748 for VTA-1 and VTA-2, respectively). The frequencies of parent populations are indicated by circles within the plots, and the target intact nuclei are indicated by the boxed area. i, Table indicating the total number of recorded events for VTA-1 and VTA-2 exemplar FACS gating as shown in Extended Data Fig. 4h, as well as the number and percentage of intact nuclei. j, Distribution of fragment sizes for (sc)ATAC-seq data used in this study. Bulk ATAC-seq data was generated from mES cells. snATAC-seq was generated from midbrain VTA, from which 216 nuclei were classified as DNs (see Methods). OLG and PGN scATAC-seq was collected from published data (see Methods, Supplementary Table 6). k, Aggregated sequencing reads at 2kb genomic regions centered on transcription start sites (TSSs). Nucleosome-free regions (NFRs; < 147 bp) were extracted from the ATAC alignment BAM files in each cell type (i.e. fragments). NFRs are enriched at the TSS for all ATAC-seq datasets. l, Number of fragments per cell/nucleus for sc/snATAC-seq datasets. The number of unique fragments per nucleus was highest for DNs. m, Single-cell accessibility maps for DNs generated in the present study were visualized together by UMAP embedding, and coloured by expression of DN marker genes or marker genes for OLGs and PGNs. Per-cell gene scores were calculated for each DNs marker gene (see Methods). DNs expressed DN-specific markers Pitx3, Foxa2, Lmx1b and Th, while not expressing OLG and PGN markers Olig2 and Camk2a, respectively. n, Top four enriched gene ontologies (GO) for DN marker genes (973 genes; over-representation as measured by Z-Score; see Methods for marker selection), containing terms relevant for dopamine metabolism, synaptic transmission and behaviour. All enriched GOs were highly significantly enriched (one-sided Fisher’s exact permuted p-values = 0). Source data
Extended Data Fig. 5
Extended Data Fig. 5. Identification of contact density changes, TAD borders, and differences in contacts between cell types.
a, GAM contact matrices for replicates 2 obtained from PGNs and DNs, within a 2-Mb region (50-kb resolution; Chr2:64,800,000-66,800,000). Contact density maps, TAD borders, pseudobulk scRNA-seq, and pseudobulk scATAC-seq tracks are indicated for each cell type below matrices. b, Distributions of TAD lengths in each GAM dataset. TAD length was calculated as the distance between two boundary points (defined as lowest insulation score point within a boundary). c, Pairwise comparisons of TAD boundary overlap between cell types. TAD boundaries were determined using insulation square method, using square size of 500kb, and the minimum score considered +1 bin on either side, giving a constant total of 150-kb TAD boundaries. The matrix of percentages of common TAD boundaries is not symmetrical as the percentage of overlap between boundaries varies with the direction of the comparison. The first dataset in the comparison is specified on the y axis, and the second on the x-axis. d, Four-way comparison of TAD boundary overlap between all cell types is shown as an UpSet plot. TAD boundaries were defined as in 5c. e, Average insulation score profiles centered on cell-type specific TAD borders show low average insulation scores in the cell type where the borders are detected, with highly significant differences at central border window with all other cell types (two-sided Mann-Whitney U test for central TAD border window in unique cell-type border and compared to all other cell types; ****p < 0.0001; p = 1.1x10⁻²⁰, 1.2x10⁻¹⁷, and 1.0x10⁻¹⁷ for mES cells compared to OLGs, PGNs and DNs, respectively; p = 6.0x10⁻¹⁸, 2.4x10⁻¹², and 4.1x10⁻¹¹ for OLGs compared to mES cells, PGNs and DNs, respectively; p = 1.0x10⁻¹⁰, 2.0x10−07, and 1.3x10−09 for PGNs compared to mES cells, OLGs and DNs, respectively; and p = 6.7x10⁻¹⁰, 1.8x10⁻¹², and 8.5x10−08 for DNs compared to mES cells, OLGs and PGNs, respectively). f, Venn plots show overlap between TAD boundaries in PGN or DN replicates 1 and 2. Overlaps were performed by comparing replicate 1 (R1) to replicate 2 (R2), and conversely R2 to R1. g, Average insulation score profiles of common TAD borders (first UpSet plot group) centered on the lowest insulation point within each TAD border are shown for each cell type (two-sided Mann-Whitney test for central TAD border window in mES cell border and compared to each brain cell-type; ****p < 0.0001; p = 8.6x10⁻¹⁰, 1.5x10⁻¹⁸, and 1.0x10⁻¹⁸ for mES cells compared to OLGs, PGNs and DNs, respectively). h, Percentage of TAD borders containing expressed genes (R-log 2.5) in each cell type for the groups shown in d. Higher percentage of borders contain expressed genes in groups with shared borders in two or more cell types. In all groups, brain cells have a higher percentage of borders with expressed genes compared to mES cells. i, Average insulation score profiles at the gene TSS or TES for genes >300kb in length, using insulation square size 500kb. The top and bottom 20% expressing genes were determined using the length-normalized number of reads covering the gene body (length-scaled RNA Reads per Million; lsRRPM). The top expressing long genes have significantly lower insulation scores compared to the lowest expressed genes, at both the TSS and TES, in DNs and PGNs, while mES cells are lower at the TSS only, and OLGs show no detectable difference (two-sided Mann-Whitney test at TSS or TES windows; *p < 0.05, **p<0.01, ***p < 0.001, ****p<0.0001; p-values at the TSS, p = 0.02, 0.009, 0.328, 0.027 for DNs, PGNs, OLGs and mES cells, respectively; p-values at the TES, p = 7.2x10⁻⁶, 1.8x10⁻⁸, 0.323, 0.177 for DNs, PGNs, OLGs and mES cells, respectively). Source data
Extended Data Fig. 6
Extended Data Fig. 6. Identification of domain melting in long expressed genes.
a, Cumulative probability of insulation square scores ranging from 100 – 1000 kb for Grik2 in all cell types and replicates (left). Comparison between PGNs replicates 1 and 2 and mES cells, with maximum distance (d) and TAD melting scores (right). Cumulative probability distributions of insulation scores and domain melting scores for Grik2 in PGNs, Dscam in PGNs, and Magi2 in OLGs (right). All genes were compared to mES cells, with maximum distance (d) indicated for each comparison. b, Example of domain melting for Magi2 in OLGs. c, Correlation of replicate domain melting scores for replicates 1 and 2 in PGNs and DNs (two-sided Pearson’s R product-moment correlation was calculated for all 479 long genes; ****p < 2.2x10⁻¹⁶ for both PGNs and DNs;). d, Domain melting scores for each gene (n = 479) in PGNs R2 and DNs R2, compared to mES cells. Genes with melting scores > 5 are coloured in each cell type. Density estimates of length-scaled RNA reads per million (lsRRPM) transcription levels are shown for genes with melting scores > 5 (coloured by cell type) compared to non-melting genes (grey; two-sided Wilcoxon rank-sum test; ****p = 5.4x10⁻⁹ and 6.5x10⁻¹¹ in PGNs and DNs, respectively). e, Melting genes have higher density of open chromatin regions throughout their gene bodies (length-scaled ATAC-seq RPM values; lsARPM), especially in PGNs and DNs, and to a minor extent in OLGs (two-sided Wilcoxon rank-sum test; *p<0.05, ****p<0.0001; p-values from left to right, p = 0.015, 4.0x10⁻¹⁰, 1.3x10⁻⁷). f, Domain melting scores compared to length-scaled ATAC-seq reads per million (lsARPM) transcription levels for each gene (n = 479) in PGNs R2 and DNs R2. Density estimates of lsARPM open chromatin levels are shown for genes with melting scores > 5 (coloured by cell type) compared to non-melting genes (grey; two-sided Wilcoxon rank-sum test; ****p = 2.6x10⁻⁶ and 2.2x10⁻¹⁶ in PGNs and DNs, respectively). g, Long genes within the top 3% melting scores in any cell-type (24 of 44 genes) have a higher likelihood of sensitivity to topoisomerase inhibition compared to genes with intermediate melting scores (42 of 261) and genes with no domain melting (27 of 174; two-sided χ2 test; ****p-value = 5.0e-9). h, Heatmaps of genes with domain melting in OLGs, and with domain melting in at least 1 replicate for PGNs and DNs, clustered by change in transcription level (length-scaled RNA RPM; lsRRPM) from mES cells to brain cell type. ATAC-seq (length-scaled ATAC RPM; lsARPM), compartments in each cell-type, and percentage of mES cell lamina- and nucleolus-associated domain (LAD and NAD, respectively) in mES cells are shown for comparison. The density of the change in lsRRPM, lsARPM, and melting scores are shown for each cluster (violin plots on right). Compartment changes are shown as bar plots (lower right). i, mES cell LAD association (defined as > 50% of gene body with feature) for genes with or without melting domains in brain cell types and replicates. For DNs and OLGs, genes with domain melting were less likely to be LAD associated in mES cells, compared to non-melting genes (Two-sided Fisher’s exact test; **p < 0.01, ***p<0.001; p-values from left to right, p = 0.001, 0.272, 0.209, 0.003, 0.0001). j, mES cell NAD association (defined as > 50% of gene body with feature) for genes with or without melting domains in brain cell-types and replicates. For DNs and OLGs, genes with domain melting were less likely to be NAD associated in mES cells, compared to non-melting genes (Two-sided Fisher’s exact test; *p < 0.05, **p < 0.01; p-values from left to right, p = 0.003, 0.272 0.209, 0.055, 0.008). Source data
Extended Data Fig. 7
Extended Data Fig. 7. Characteristics and mechanisms of domain melting in long expressed genes.
a, Contact density maps for each cell type and replicate, at the Nrxn3 locus, calculated using insulation square sizes ranging from 100 − 1000 kb. Contact density is reduced in PGNs and DNs replicate 2 (R2), similar to R1 but occurring in slightly differing regions of the gene. b, Contact density maps for each cell type and replicate, at the Rbfox1 locus. Contact density is reduced in OLGs and PGNs R2, in the same region as R1. c, Ensembles of polymer models were produced for the Nrxn3 locus in mES cells and in DNs from experimental GAM data using PRISMR modelling (n= 450). The quality of the models was verified by applying in-silico GAM to the ensemble of polymers and comparison between NPMI-normalized contact matrices from in-silico and experimental immunoGAM (Pearson r = 0.72 and 0.79 for mES cells and DNs, respectively). Colour bars below in-silico matrices highlight the position of domains in DNs and are used to colour the polymer examples shown in Fig. 3c and Extended Data Fig. 7d. d, Additional examples of polymer models for the Nrxn3 locus in mES cells and DNs. The Nrxn3 melted TAD is represented by the green coloured region and is more decondensed in DNs than mES cells. See Fig. 3c for location and colouring of the domains. e, Distribution of gyration radii of all domains in polymer models for mES cells and DNs (see Fig. 3c for location and colouring of the domains; n= 450, two-sided Mann-Whitney test between mES cells and DNs; dashed lines indicate quartiles; ****p<0.0001; domains from left to right p= 3.0e-151, 0.0005, 1.1e-92, 2.0e-147, 7.3e-40, 2.5e-67). f, Exemplar images of whole gene cryo-FISH for Rbfox1 (green) in mES cells and PGNs, using probes that label the whole gene. Nucleoli (purple) were detected by an anti-nucleophosmin 1 antibody. Yellow inset of the ~400 nm section shows a single nucleus. Inset on nuclear section (yellow box) with Rbfox1 FISH signal and each imaging channel. Yellow outline indicates region of Rbfox1 signal used for area measurement and localization to nuclear landmarks. g, Exemplar images of tri-colour cryo-FISH for Rbfox1 TSS (teal), Mid (green) and TES (purple) in mES cells and PGNs (see Fig. 3e for schematic). Yellow inset of the 400 nm section shows a single nucleus. Inset on nuclear section (yellow box) is shown for all three FISH signals, and each imaging channel separately. Yellow outline indicates region of Rbfox1 signal used for center of mass distance measurements. Source data
Extended Data Fig. 8
Extended Data Fig. 8. Melting genes often show increased contacts with their own chromosome.
a, Melting genes are more likely to gain intra-chromosomal contacts in PGNs and DNs R1, but not OLGs, compared to mES cells (two-sided Wilcoxon rank-sum test; **p<0.01, ***p<0.001; p-values from left to right, p = 0.003, 0.0003, 0.329). Median trans-cis contact ratios were calculated for each gene with domain melting in DNs, PGNs, or OLGs, and compared to mES cells. b, Median trans-cis contact ratios were calculated for each gene with domain melting in PGNs R2 or DNs R2. Median trans-cis ratios were significantly lower for PGNs and DNs R2 melting genes when compared to mES cells (two-sided Wilcoxon rank-sum test; *p<0.05, ***p<0.0001; p-values were p = 0.037 and 0.0003 for PGNs and DNs, respectively). c, Correlation of median trans-cis ratios for all long genes (> 300kb) in R1 and R2 for PGNs or DNs. In PGNs, median trans-cis ratios were significantly correlated between replicates, with a high correlation value (Two-sided Pearson’s R product-moment correlation; R=0.9, ****p < 2.2x10⁻¹⁶). DNs had a lower correlation, though the correlation was still significant (R=0.16, ***p = 0.0005). d, Median trans-cis contact ratios were calculated for each gene without domain melting. Non-melting genes show no preference for changes in trans-cis contact ratios between brain cells and mES cells (two-sided Wilcoxon rank-sum test). e, The Rbfox1 locus gains contacts with other chromosomes in PGNs, compared to mES cells. Trans-cis contact ratios were determined by the mean ratio between trans NPMI scores and cis NPMI scores (250kb genomic bins), and normalizing each ratio as a percentile for each chromosome. Inset (grey shaded region) shows a 7Mb region (Chr16: 3,000,000-10,000,000) containing the Rbfox1 gene (blue shaded region). f, Trans-cis contact ratios are shown for chromosome 12 in mES cells and DNs. Inset (grey shaded region) shows a 7Mb region (Chr12: 85,000,000-92,000,000) containing the Nrxn3 gene (green shaded region). g, Median trans-cis ratios for genes with melting domains, separated by association with NAD association (defined as > 50% of gene body with feature). For DNs, median trans-cis ratios were significantly decreased when compared to mES cells, regardless of association with NADs (two-sided Wilcoxon rank-sum test; *p<0.05, **p<0.01; p-values from left to right, p = 0.927, 0.233, 0.100, 0.010, 0.044, 0.003). For PGNs, median trans-cis ratios were significantly decreased for non-NAD associated genes (**p<0.01), and trending toward significance for NAD-associated genes, when compared to mES cells (p=0.1). OLGs had no significant differences in median trans-cis values for both NAD associated and non-associated genes, when compared to mES cells. h, Median trans-cis ratios for genes without melting domains, separated by association with NAD association (defined as > 50% of gene body with feature). NAD-associated genes had significantly lower trans-cis values in all brain cell types when compared to mES cells (two-sided Wilcoxon rank-sum test; **p<0.01; p-values from left to right, p = 0.002, 0.205, 0.013, 0.147, 0.002, 0.911). For all brain cell types, non-melting genes that were not associated with NADs had no significant differences in median trans-cis values when compared to mES cells. Source data
Extended Data Fig. 9
Extended Data Fig. 9. Analysis of transcription factor binding sites and differentially expressed genes in GAM differential contacts between DNs and PGNs.
a, GAM contacts from PGNs and DNs (mouse replicate 1) were normalized (Z-Score) and subtracted to produce differential contacts matrices. Top 5% differential contacts ranged 0.05-5 Mb. Contacts containing TF motifs within accessible chromatin on each contacting window were selected in most (top 5) enriched in PGNs or DNs or with highest discriminatory power (information gain). b, Distribution of the number of ATAC-seq peaks per 50kb GAM window in DNs and PGNs (upper panel; mean(μ) = 2.6 and 2.0 in DNs and PGNs, respectively). Number of base pairs covered by ATAC-seq peaks per 50kb GAM window in DNs and PGNs (lower panel; μ = 1270 and 1326 in DNs and PGNs, respectively). c, Correlation plot of cell type and replicates for differential gene expression analysis. Pseudobulk replicates correlate most highly with one another, followed by brain cell types. Right, heatmap of differentially expressed (DE) genes between PGNs and DNs, clustered by cell type. d, Selection of TF motifs based on percentage of TF motifs in accessible regions within unique windows (> 5%) and differential expression between PGNs (Benjamini-Hochberg corrected two-sided Wald test; log10(p. adj.) < 3) and DNs (-log10(p. adj.) > 3). PGN-selected TFs (33) are shown in blue, DN-selected TFs (17) are shown in green. A list of selected TFs are shown below, with TF motifs continuing after the TF enrichment analysis in (f) coloured in blue (PGNs) or green (DNs). e, Full pipeline to determine pairs of genomic windows in GAM differential contacts containing transcription factor binding sites. GAM contacts from PGNs and DNs were normalized and compared to produce a differential Z-Score matrix with a 0.05-5 Mb distance range. The top 5% differential contacts with > 0.15 NPMI values for each dataset were extracted from the differential matrices. Accessible chromatin regions were mapped to the top differential contacts. Next, TF motifs were filtered based on expression in at least one cell type. Accessible regions in differential contacts were used to determine the percentage of TF motifs within unique windows. To find TFs with the potential to drive contact specificity between DNs and PGNs, we chose for further analyses the TF motifs that were found in DN or PGN accessible regions within differential contacts which (1) were present in at least 5% of contacts, and (2) the TFs were differentially expressed between DNs and PGNs (-log10(p.adj.) > 3). The 50 TFs which met the requirements were further investigated to determine the frequency of each motif pair (TF feature pair) in PGN and DN differential contacts. The top-20 TF feature pairs were selected for further analyses based: (a) on Information gain score (top 10 feature pairs selected), and (b) on enrichment in either PGNs (top 5 selected) or DNs (top 5 selected). f, TF motif pairs selected by enrichment scores in DNs or PGNs, or by the highest Information gain scores. g, Overlaps of top 20 TF feature pair contacts for PGN and DN significant differential contacts. The top 40 groups with overlapping TF features are shown for each cell type. Source data
Extended Data Fig. 10
Extended Data Fig. 10. Features of top differential contacts containing pairs of TF binding sites.
a, Percentage of contacts at each genomic distance for top differential contacts found in TF feature pair groups. Contacts in all groups are enriched at distances > 2 Mb. b, Aggregated maps of average Z-scores for TF-containing contact groups in PGNs and DNs. The Z-Score was determined for each contact and a 200kb (4 genomic bin) radius. For each group, chromosome- and distance-matched contacts were randomly sampled three times from the genome-wide distribution (one exemplar is shown for each group). c, Percentage of contacts (< 2 Mb) that fall within a TAD border in both windows, one window or no windows. For both cell types, most contacts do not overlap with TAD borders, with a slight no differences detected for top differential contacts found in TF feature pair groups, except a modest increase for contacts that have both windows with a border for Ctcf-Ctcf containing contacts in both PGNs and DNs. d, Overlap of TF-containing contact groups with compartment identity in each contacting window. For both cell types, TF-containing contact groups were more likely to be in A-compartment in both contacting windows, compared to the genome-wide average and all top differential contacts. e, TF motif network and community analysis. After determining the number of contacts for each TF pair, only pairs involved in > 20% of total TF-containing contacts were considered. A network was built with each TF as a node and contacts as the edge weight. Community detection was performed using a Leiden algorithm, before visualizing the network. f, Network analysis and community detection for TF motifs found within DN or PGN differential contacts. g, Overlap of TF-pair containing contacts with 1000 random circular permutations of PGN and DN expressed gene regions shows that the observed enrichments of contacts with genes in both windows are significantly higher than the expected distribution (two-sided t-test; ***empirical p = 0.001 for all observed values tested). The enrichments were also seen, to smaller degree than for the TF-pair containing contacts, for all contacts between A-compartment windows. h, Number of PGN or DN differentially expressed (DE) genes found in differential contacts according to sets of TF feature pairs. i, Differential Z-Score matrix showing PGN-upregulated genes that form contacts across a ~4.5-Mb linear genomic distance (pink box; Chr11: 65,400,000-70,400,000). Upper right inset shows PGN significant differential contacts containing the Neurod group (contacts are shown in pink). Genes highlighted in blue are upregulated in PGNs. j, Differential Z-Score matrix showing DN-upregulated genes that form contacts across a ~5-Mb linear genomic distance (pink boxes; Chr1: 160,000,000-166,000,000). Upper right inset shows DN significant differential contacts containing the Foxa1-TF group (contacts are shown in orange). Genes highlighted in green are upregulated in DNs. k, GAM contact matrices showing a 2.3-Mb region surrounding the Egr1 gene for PGNs R1 and R2 (Chr18: 33,700,000-36,000,000). Source data
Extended Data Fig. 11
Extended Data Fig. 11. Identification of compartments and differences between cell types.
a, Open and closed chromatin compartments (A and B, respectively) display different genomic distributions in mES cells, OLGs, PGNs and DNs. Mouse replicates 1 and 2 (R1 and R2, respectively) are shown. Purple, compartment A; orange, compartment B. b, Comparison of compartment A/B membership in GAM datasets from PGNs and DNs and their replicates. Compartment changes show good overlap between replicates. Purple, compartment A; orange, compartment B. c, Pearson’s correlation of eigenvectors shows the largest differences between mES cells and brain cell types. d, UpSet plot showing all combinations of compartments changes Most genomic windows share membership to compartments A, followed by B, in all cell types. The most frequent compartment changes occur from compartment B in mES cells to A in all brain cells (pink box), followed by changes from A in mES cells to B in all brain cells (blue box). e, Compartment changes for each cell type comparison in each chromosome. Only compartments common to both replicates were used in the comparison. Brain cell types have higher overlap with each other as compared to mES cells. PGNs and DNs had the most overlap for most chromosomes. f, Violin plots of the distribution of compartment lengths show similar lengths between cell types. Right, percentage of the genome covered by A or B compartments in each cell type shows similar distribution between cell types. Source data
Extended Data Fig. 12
Extended Data Fig. 12. Genomic regions involved in strong long-range contacts in brain cells regions contain sensory receptor clusters in B compartments.
a, Heatmap of gene expression for genes that change compartments between compartment B in mES cells to compartment A in all brain cells. Clustering of genes by expression shows six distinct clusters where clusters 3 and 4 contain genes that increase their expression between mES cells and all brain cell types. Gene ontology (GO) in Fig. 5a was done on genes from clusters 3 and 4 combined (pink box). Expression is calculated as the R-log value for each cell type (see Methods). b, Heatmap of gene expression for genes that change from compartment A in mES cells to compartment B in brain cells. Clustering of genes by expression identifies five clusters. Genes in cluster 4 are expressed in mES cells and show lower expression in the brain cell types; they were used for GO analysis presented in Fig. 5a (light blue box). Genes in clusters 2 and 3 are not expressed in mES cells nor brain cells; they were combined and used for GO analyses presented in Fig. 5b (dark blue box). Expression is calculated as the R-log value for each cell-type. c, A higher proportion of Olfr and Vmn genes are found in B compartments in brain cells, compared to mES cells. d, GAM contact matrices show interactions between an Olfr/Vmn gene cluster and a second Olfr cluster (dashed boxes) separated by 25 Mb (Chr7: 80,000,000-110,000,000). The contacts between the two receptor clusters are strongest in OLGs, where the B compartment is strongest. e, GAM contact matrices show strong interactions that span a 30Mb distance between compartment B regions in OLGs, PGNs and DNs (purple circle), but not mES cells (Chr7: 52,000,000-95,000,000). Dashed boxes indicate contacts containing Olfr and Vmn gene clusters. f, Distribution of the top 20% of Z-Score normalized contacts for each genomic window at distances > 3 Mb (Two-sided Mann-Whitney U test; exact p-values are indicated on the plot). g, Summary diagram. The 3D genome is extensively reorganized in brain cells to reflect its gene expression specialization. (i) Contacts are rearranged at multiple scales, where formation of new TAD borders can coincide with genes important for cell specialization in all cell types. (ii) Domain melting occurs at very long genes which are highly transcribed and with high chromatin accessibility in brain cells. (iii) The most specific contacts in neurons contain complex networks of binding sites of neuron-specific transcription factors. Contacts bridge genes expressed in the neurons where the contacts are observed, with specialized functions, such as in synaptic plasticity (PGNs) and addiction (DNs). (iv) Finally, B compartments contain clusters of sensory receptor genes silent in all cell types which form strong contacts across tens of megabases. Source data

Comment in

References

    1. Jung I, et al. A compendium of promoter-centered long-range chromatin interactions in the human genome. Nat. Genet. 2019;51:1442–1449. - PMC - PubMed
    1. Beagrie RA, et al. Complex multi-enhancer contacts captured by genome architecture mapping. Nature. 2017;543:519–524. - PMC - PubMed
    1. Quinodoz SA, et al. Higher-order inter-chromosomal hubs shape 3D genome organization in the nucleus. Cell. 2018;174:744–757. - PMC - PubMed
    1. Fraser J, et al. Hierarchical folding and reorganization of chromosomes are linked to transcriptional changes in cellular differentiation. Mol. Syst. Biol. 2015;11:852. - PMC - PubMed
    1. Beagan JA, et al. Three-dimensional genome restructuring across timescales of activity-induced neuronal gene expression. Nat. Neurosci. 2020;23:707–717. - PMC - PubMed

Publication types