Review
. 2021 Nov 1:12:728012.
doi: 10.3389/fneur.2021.728012. eCollection 2021.

Time-Based Decision Making for Reperfusion in Acute Ischemic Stroke

Affiliations
Review

Time-Based Decision Making for Reperfusion in Acute Ischemic Stroke

Mathias Grøan et al. Front Neurol. .

Abstract

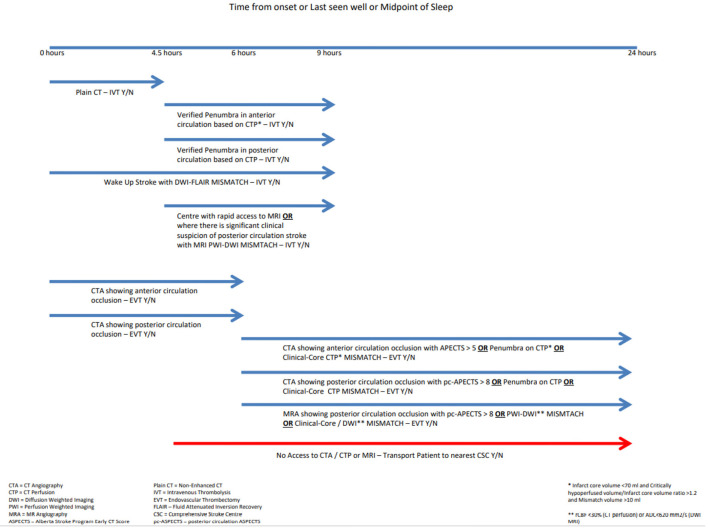
Decision making in the extended time windows for acute ischemic stroke can be a complex and time-consuming process. The process of making the clinical decision to treat has been compounded by the availability of different imaging modalities. In the setting of acute ischemic stroke, time is of the essence and chances of a good outcome diminish by each passing minute. Navigating the plethora of advanced imaging modalities means that treatment in some cases can be inefficaciously delayed. Time delays and individually based non-programmed decision making can prove challenging for clinicians. Visual aids can assist such decision making aimed at simplifying the use of advanced imaging. Flow charts are one such visual tool that can expedite treatment in this setting. A systematic review of existing literature around imaging modalities based on site of occlusion and time from onset can be used to aid decision making; a more program-based thought process. The use of an acute reperfusion flow chart helping navigate the myriad of imaging modalities can aid the effective treatment of patients.

Keywords: acute ischaemia; computer tomography (CT); magnetic resonance imaging (MRI); stroke; thrombectomy; thrombolysis.


Conflict of interest statement

The authors declare that the research was conducted in the absence of any commercial or financial relationships that could be construed as a potential conflict of interest.

Figures

Figure 1
Figure 1
Acute ischemic stroke due to a terminal internal carotid artery occlusion. (A,B) show the initial Plain CT. A hyperdense vessel sign [black arrow in (A)] is seen, and there is loss of gray-white matter differentiation in the left insula, lentiform nucleus and M2 region [asterisks in (B)], corresponding to an ASPECTS score of 7. No ischemic changes are seen at the supraganglionic level (C). Multiphase CTA shows lack of collateral filling in the first (arterial) phase [white arrows in (D)]. However, the pial arterial collaterals fill eventually in the second (peak-venous) phase (E). There is a slight delay in washout in the third phase (F). Intravenous thrombolysis was administered between Plain CT and mCTA, and the patient was treated with EVT after mCTA has been completed. (G) shows the initial digital subtraction angiography run with the occlusion. (H) shows the last intracranial angiography run with complete recanalization [modified thrombolysis in cerebral infarction (mTICI 3)]. On follow-up diffusion-weighted MRI at 24 h, an infarct of moderate size in the left insula, lentiform nucleus, and M2 region was seen (I), corresponding to the areas with early ischemic changes in the initial plain CT. There was also a small infarct in the left M5 region (J) that was not noted on the baseline plain CT.
Figure 2
Figure 2
Multiphase computed tomographic angiography (mCTA) predicted an infarct map compared to a computed tomographic perfusion (CTP) time-dependent Tmax threshold map when compared to a follow-up infarct. (A) Patient who achieved reperfusion (mTICI 2b); (B) patient who did not achieve reperfusion; and (C) patient who achieved complete reperfusion with EVT. Columns: mCTA phase 1–3, mCTA predicted perfusion maps, mCTA predicted core (red in column 5) and penumbra (blue in column 5) overlaid on the mCTA predicted perfusion map, CTP Tmax maps, CTP time-dependent Tmax threshold predicted infarct, infarct contoured in follow-up imaging, respectively. The penumbra is shown as affected tissue from the penumbra model minus affected tissue from the core model. [Reprinted with permission from Journal of Stroke, 2021 (36)].
Figure 3
Figure 3
Flow chart for reperfusion decision making.

References

    1. Powers WJ, Rabinstein AA, Ackerson T, Adeoye OM, Bambakidis NC, Becker K, et al. . 2018 Guidelines for the early management of patients with acute ischemic stroke: a guideline for healthcare professionals from the American Heart Association/American Stroke Association. Stroke. (2018) 49:e46–110. 10.1161/STR.0000000000000163 - DOI - PubMed
    1. Meretoja A, Keshtkaran M, Tatlisumak T, Donnan GA, Churilov L. Endovascular therapy for ischemic stroke: save a minute-save a week. Neurology. (2017) 88:2123–7. 10.1212/WNL.0000000000003981 - DOI - PubMed
    1. Meretoja A, Keshtkaran M, Saver JL, Tatlisumak T, Parsons MW, Kaste M, et al. . Stroke thrombolysis: save a minute, save a day. Stroke. (2014) 45:1053–8. 10.1161/STROKEAHA.113.002910 - DOI - PubMed
    1. Advani R, Naess H, Kurz MW. The golden hour of acute ischemic stroke. Scand J Trauma Resusc Emerg Med. (2017) 25:54. 10.1186/s13049-017-0398-5 - DOI - PMC - PubMed
    1. Goyal M, Demchuk AM, Menon BK, Eesa M, Rempel JL, Thornton J, et al. . Randomized assessment of rapid endovascular treatment of ischemic stroke. N Engl J Med. (2015) 372:1019–30. 10.1056/NEJMoa1414905 - DOI - PubMed

LinkOut - more resources