

Endoscopic duodenal mucosal resurfacing for nonalcoholic steatohepatitis (NASH): a pilot study
- PMID: 34790547
- PMCID: PMC8589546
- DOI: 10.1055/a-1550-7668
Endoscopic duodenal mucosal resurfacing for nonalcoholic steatohepatitis (NASH): a pilot study
Abstract
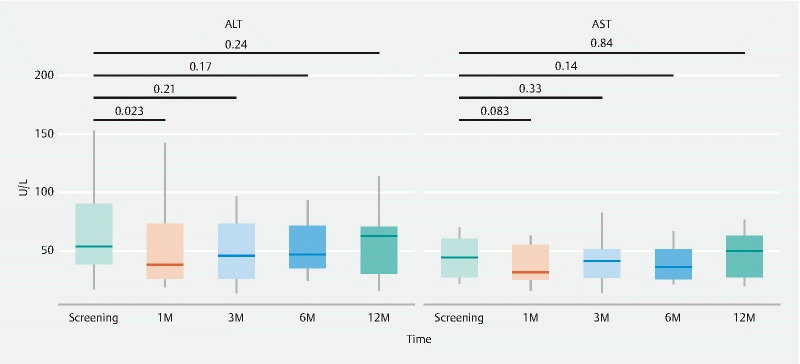
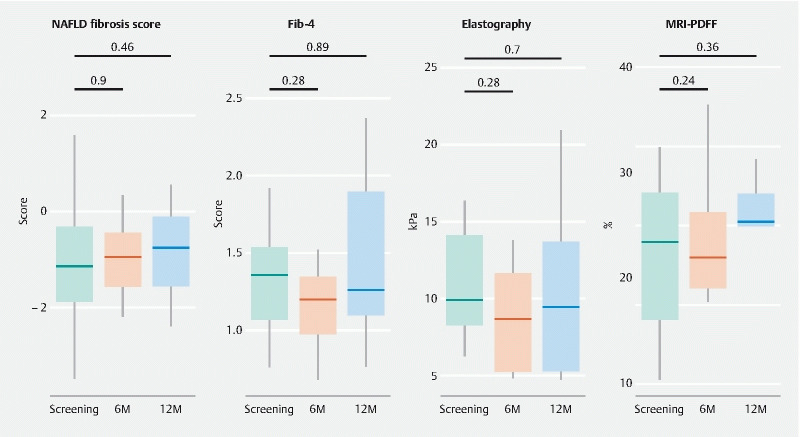
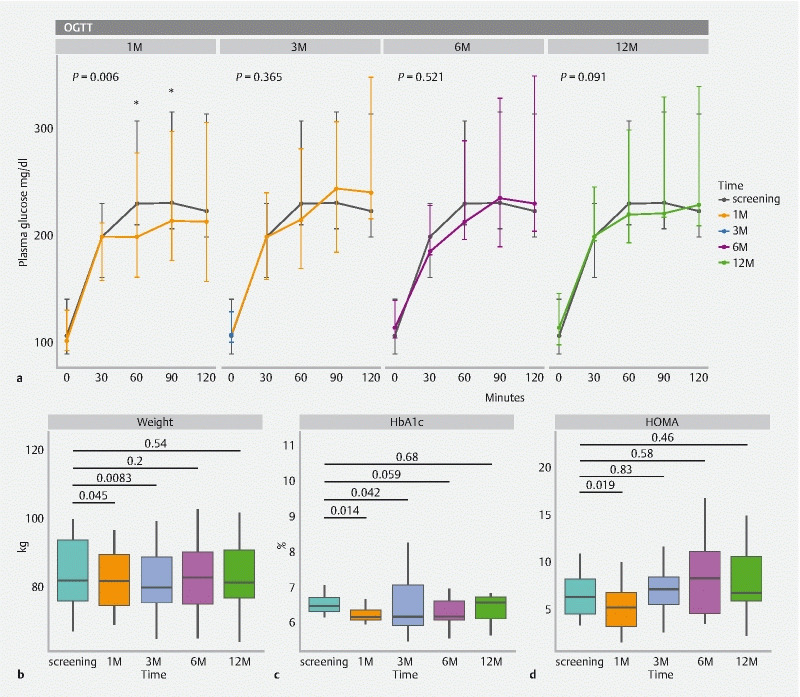
Background and study aims Nonalcoholic steatohepatitis (NASH) is a leading cause of chronic liver disease worldwide with limited treatment options. Duodenal mucosal resurfacing (DMR) has been associated with improvement in glycaemic parameters and liver function tests (LFTs) in type 2 diabetes. This study aimed to assess the effect of DMR in patients with NASH. Patients and methods This was a single-center, open-label pilot study. Patients with definite, biopsy-proven NASH (nonalcoholic fatty liver disease activity score [NAS] ≥ 4) underwent a single DMR procedure followed by a 2-week postprocedural diet, without lifestyle intervention. The primary outcome was either resolution of NASH with no worsening of fibrosis or improvement in fibrosis (≥ 1 stage) with no worsening of NASH at 12 months. Secondary outcomes were changes in key histological parameters of NASH, surrogate markers of fibrosis, LFTs, and metabolic factors at 12 months. Results From 2017 to 2019, 14 patients underwent successful DMR, of whom 11 were included in the analysis. After 12 months, no resolution of NASH was observed, while three patients (27 %) had marginal improvement in fibrosis with no worsening of NASH. Serious adverse events related to the procedure were reported in two patients out of 14 (14 %). Neither weight loss nor improvement in NAS score, or in the other secondary outcomes, were observed at 12 months. Conclusions In this small and heterogenous study population, we found that DMR, in the absence of lifestyle intervention, did not induce NASH resolution and marginally improved liver fibrosis at 12 months.
The Author(s). This is an open access article published by Thieme under the terms of the Creative Commons Attribution-NonDerivative-NonCommercial License, permitting copying and reproduction so long as the original work is given appropriate credit. Contents may not be used for commercial purposes, or adapted, remixed, transformed or built upon. (https://creativecommons.org/licenses/by-nc-nd/4.0/).
Conflict of interest statement
Competing interests This investigator-initiated study was supported in part through a grant from Fractyl Inc., Lexington, Massachusetts, United States. Dr. Devière receives institutional research support for IRB-approved studies from Fractyl Inc, Lexington, Massachusetts, United States. Dr. Hadefi is supported by a research grant from the “Fonds Erasme pour la recherche médicale” (doctoral research fellow grant). Dr. Trépo is a Research Associate of the Fund for Scientific Research-FNRS.
Figures
References
-
- Younossi Z M, Golabi P, de Avila L et al.The global epidemiology of NAFLD and NASH in patients with type 2 diabetes: A systematic review and meta-analysis. J Hepatol. 2019;71:793–801. - PubMed
-
- Younossi Z M. Long-term outcomes of nonalcoholic fatty liver disease: from nonalcoholic steatohepatitis to nonalcoholic steatofibrosis. Clin Gastroenterol Hepatol. 2017;15:1144–1147. - PubMed
-
- Eslam M, Newsome P N, Sarin S K et al.A new definition for metabolic dysfunction-associated fatty liver disease: An international expert consensus statement. J Hepatol. 2020;73:202–209. - PubMed
LinkOut - more resources
Full Text Sources