

Trends in Intracranial Glioma Incidence and Mortality in the United States, 1975-2018
- PMID: 34790574
- PMCID: PMC8591029
- DOI: 10.3389/fonc.2021.748061
Trends in Intracranial Glioma Incidence and Mortality in the United States, 1975-2018
Abstract
Purpose: Glioma incidence in the US seems to have stabilized over the past 20 years. It's also not clear whether changes in glioblastoma incidence are associated with glioma mortality trends. Our study investigated trends in glioma incidence and mortality according to tumor characteristics.
Methods: This study obtained data from the Surveillance, Epidemiology, and End Results-9 (SEER-9) registries to calculate glioma incidence and mortality trends. Annual percent changes (APC) and 95% CIs were calculated using the Joinpoint program.
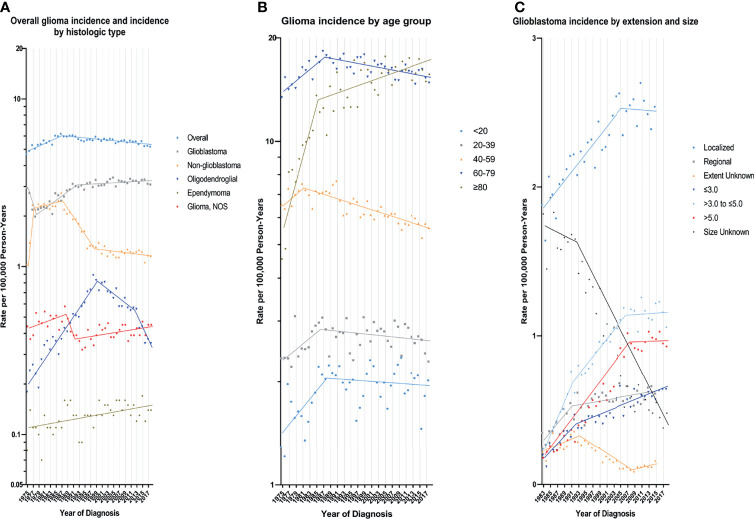
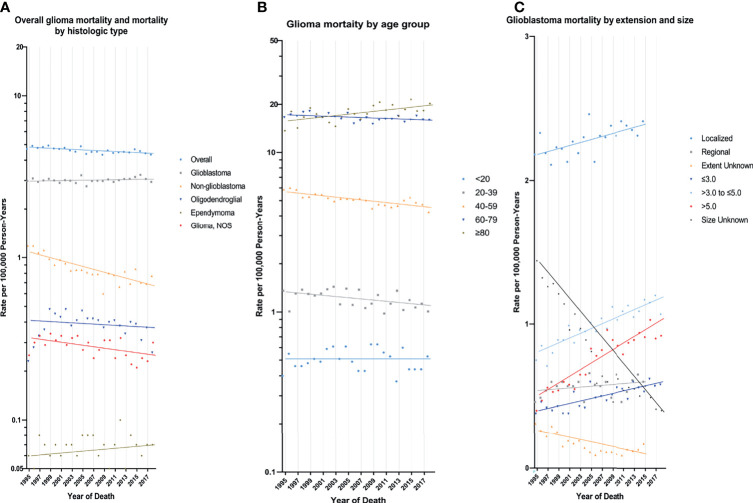
Results: 62,159 patients (34,996 males and 55,424 whites) were diagnosed with glioma during 1975-2018, and 31,922 deaths occurred from 1995-2018. Glioblastoma (32,893 cases) and non-glioblastoma astrocytoma (17,406 cases) were the most common histologic types. During the study period, the incidence of glioma first experienced a significant increase (APC=1.8%, [95% CI, 1.3% to 2.3%]) from 1975 to 1987, and then experienced a slight decrease (APC=-0.4%, [95% CI, -0.5% to -0.3%]) from 1987 to 2018, while the APC was 0.8% for glioblastoma, -2.0% for non-glioblastoma astrocytoma, 1.1% for oligodendroglial tumors, 0.7% for ependymoma and -0.3% for glioma NOS during the study period. Glioblastoma incidence increased for all tumor size and tumor extension except for distant. From 1995 to 2018, glioma mortality declined 0.4% per year (95% CI: -0.6% to -0.2%) but only increased in patients older than 80 years [APC=1.0%, (95% CI, 0.4% to 1.6%)].
Conclusion: Significant decline in glioma incidence (1987-2018) and mortality (1995-2018) were observed. Epidemiological changes in non-glioblastoma astrocytoma contributed the most to overall trends in glioma incidence and mortality. These findings can improve understanding of risk factors and guide the focus of glioma therapy.
Keywords: age-adjusted incidence; glioblastoma; glioma; incidence-based mortality; relative survival; trends.
Copyright © 2021 Lin, Wang, Chen, Gong, Chen, Shi, Lan, Chen, Xiong, Sun and Wan.
Conflict of interest statement
The authors declare that the research was conducted in the absence of any commercial or financial relationships that could be construed as a potential conflict of interest.
Figures
References
LinkOut - more resources
Full Text Sources
Miscellaneous