. 2021 Oct 25;1(6):100091.
doi: 10.1016/j.crmeth.2021.100091.

Metatranscriptomics to characterize respiratory virome, microbiome, and host response directly from clinical samples

Affiliations

Metatranscriptomics to characterize respiratory virome, microbiome, and host response directly from clinical samples

Seesandra V Rajagopala et al. Cell Rep Methods. .

Abstract

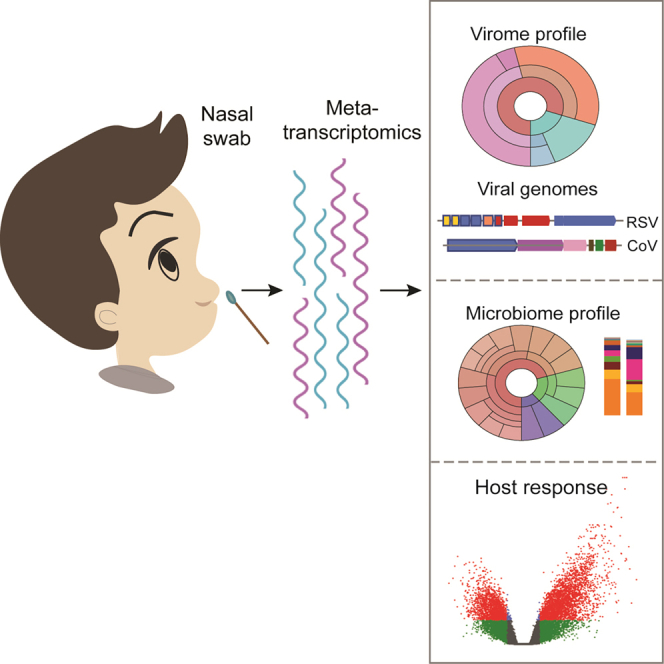
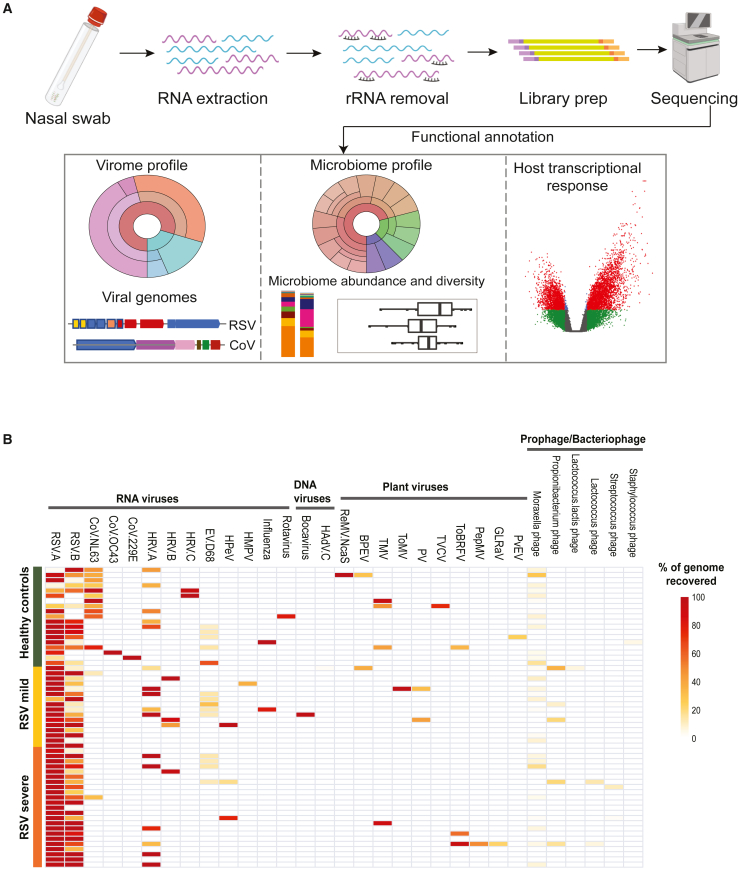
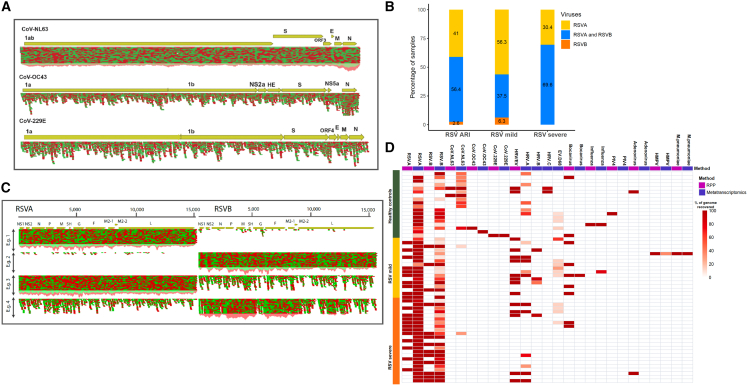
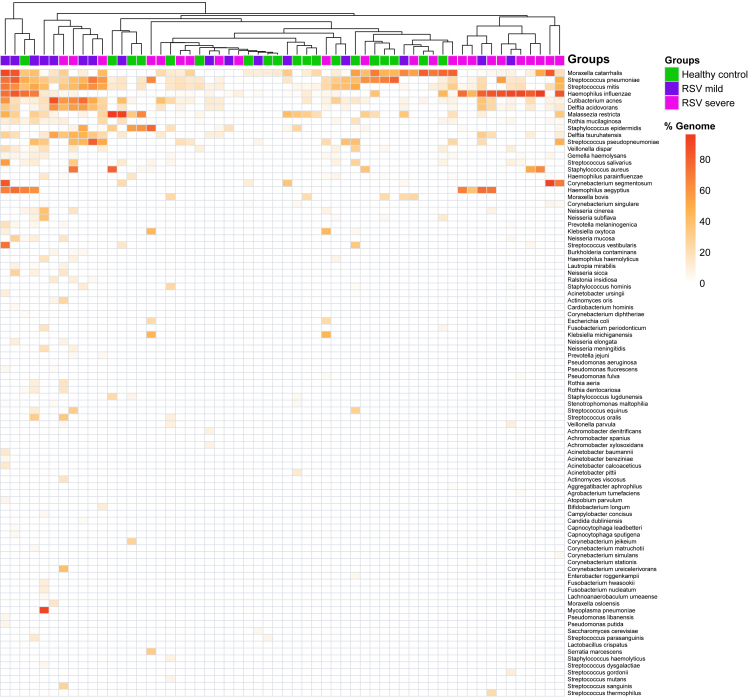
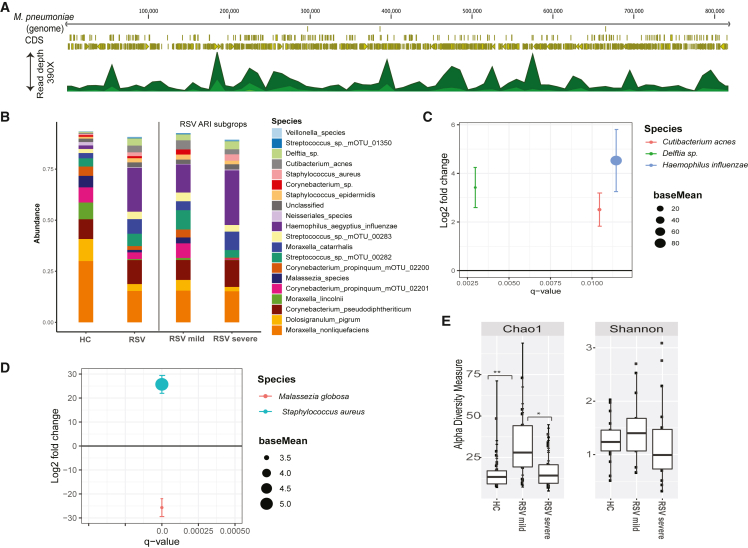
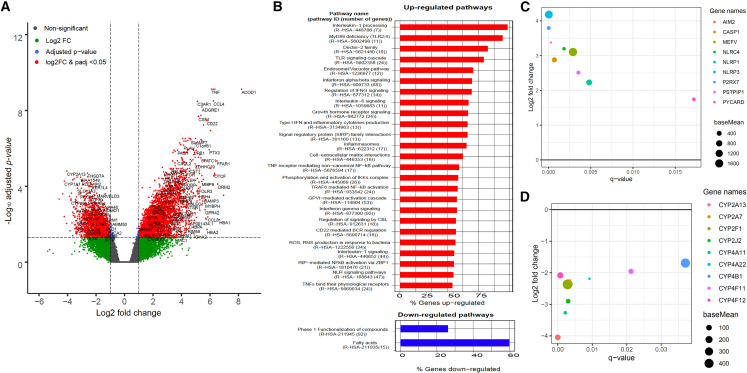
We developed a metatranscriptomics method that can simultaneously capture the respiratory virome, microbiome, and host response directly from low biomass samples. Using nasal swab samples, we capture RNA virome with sufficient sequencing depth required to assemble complete genomes. We find a surprisingly high frequency of respiratory syncytial virus (RSV) and coronavirus (CoV) in healthy children, and a high frequency of RSV-A and RSV-B co-detections in children with symptomatic RSV. In addition, we have identified commensal and pathogenic bacteria and fungi at the species level. Functional analysis revealed that H. influenzae was highly active in symptomatic RSV subjects. The host nasal transcriptome reveled upregulation of the innate immune system, anti-viral response and inflammasome pathway, and downregulation of fatty acid pathways in children with symptomatic RSV. Overall, we demonstrate that our method is broadly applicable to infer the transcriptome landscape of an infected system, surveil respiratory infections, and to sequence RNA viruses directly from clinical samples.


Conflict of interest statement

DECLARATION OF INTERESTS The authors declare no competing interests.

Figures

None
Graphical abstract
Figure 1
Figure 1
Metatranscriptomics workflow and respiratory virome profile (A) Schematic overview of metatranscriptomics sample preparation and data analysis. Total RNA was extracted from nasal samples, and human rRNA was depleted before library preparation and sequencing. The sequencing reads were used to profile virome, bacteriome, and host transcriptional response. (B) Heatmap showing the virome profile. Each row represents a sample and each column represents the percentage of a virus genome recovered. The samples are grouped into healthy and RSV-ARI-positive samples; RSV samples are further split into RSV-severe and RSV-mild groups based on days of hospitalization. Complete genomes of common RNA respiratory viruses, such as RSV, coronavirus, rhinovirus, and influenza were recovered. In addition, a DNA virus, Bocavirus, was recovered in one sample. Plant viruses and phages were also recovered in both the HC and RSV samples.
Figure 2
Figure 2
Respiratory virome in healthy and children with RSV-ARI (A) Read coverage maps showing three different coronavirus strains (NL63, OC43, and 229E) identified. The reference genomes were used to map the sequence reads to show that the complete genome sequences were recovered from the metatranscriptome approach. (B) Bar plots showing number of samples with RSV-A, RSV-B, or co-detected by the metatranscriptomics method, in RSV-ARI samples. RSV-ARI samples were sub-grouped into RSV-severe and RSV-mild based on clinical presentations. (C) Read coverage map showing four conditions of RSV presence. RSV-A (reference genome JX627336) and RSV-B (reference genome KM517573) genome sequences were concatenated and used as the reference. Mapping reads to this reference shows the presence of RSV-A in example 1, RSV-B in example 2, both in example 3 with RSV-A being dominant, and both in example 4 with RSV-B being dominant. (D) Each row represents a sample and the columns represent results for each virus from the RPP (pink) followed by the metatranscriptomics method (purple). RPP results show the presence or absence of a virus, whereas metatranscriptomics results show the percentage of genome recovered for each virus. All viruses detected by RPP in at least one sample are shown here. The samples are grouped into healthy and RSV-ARI. The RSV-ARI samples are grouped into mild and severe.
Figure 3
Figure 3
High-confidence nasal microbiome Heatmap showing percentage of transcriptome recovered for each bacterial and fungal species identified. The columns represent each sample, which have been color coded to identify healthy controls (green), and RSV-mild (blue) and RSV-severe (pink) groups.
Figure 4
Figure 4
Nasal microbiome abundance and diversity (A) Read coverage along the full genome of Mycoplasma pneumoniae (reference genome: NC000912), which was recovered in a sample co-infected with RSV. (B) Nasal microbiome relative abundance in HC and children with RSV-ARI. A color-coded bar plot shows the relative abundance of the nasal microbiome at the species level. The samples are portioned into HC and RSV-ARI groups. The RSV-ARI samples were portioned into RSV-mild and RSV-severe groups. Only the top 20 most abundant species are shown here. (C) Differentially abundant nasal species in children with RSV-ARI and HC groups. All displayed values were calculated within the DESeq2 package, where we compared species abundance. On the x axis is displayed the q value for the tested species; only significant species with q < 0.05 are shown. On the y axis is displayed the log2 fold abundance change for that species. Error bars show the standard error of the log2 fold change. Log2 fold changes >0 indicate that a species was more abundant in RSV-ARI children compared with HC. (D) Similar to (C), the nasal microbiome of children with severe RSV-severe was compared with the RSV-mild group. Log2 fold changes >0 indicate that a species was more abundant in RSV-severe children compared with the RSV-mild group. Malassezia globosa was less abundant and Staphylococcus aureus was more abundant in the RSV-severe group compared with RSV-mild group. (E) Richness and alpha diversity of the nasal microbiome. Alpha diversity (measured by Shannon index) and richness (measured by S.chao1) are compared between the HC, RSV-severe, and RSV-mild groups. The richness was highest in the RSV-mild group compared with the HC and RSV-severe groups. The differences were significant between the RSV-mild and RSV-severe groups and the RSV-mild and HC groups. Differences in alpha diversity between the groups were not significant.
Figure 5
Figure 5
Host transcriptional response (A) Volcano plot showing differentially expressed host genes between RSV-ARI and HC children. We use a threshold of log2 fold change >1 and adjusted p < 0.05 to call the genes that are up- or downregulated. The genes that satisfy the threshold are shown in red dots. Non-significant genes are shown in gray dots. The genes that pass the adjusted p value threshold but not log2 fold change are shown in blue dots. The genes that pass the log2 fold change threshold but not adjusted p value are shown in green dots. (B) Enriched Reactome human pathways from the differential gene expression analysis. Upregulated pathways are shown in red and downregulated pathways are shown in blue. On the y axis is displayed the pathway name and number of genes in the pathway. On the x axis is displayed the percentage of genes upregulated in that pathway; only a subset of significant pathway enrichment with q < 0.05 are shown. (C) Plot showing the Reactome (Jassal et al., 2020) inflammasome pathway (R-HSA-622312) genes that are significantly upregulated in the RSV-ARI group compared with the HC group. On the x axis is displayed the q value for the upregulated genes with q < 0.05. On the y axis is displayed the log2 fold change for those genes. The size of the dots represents base mean, which is the mean of normalized counts of all samples. (D) Similar to (C), a plot showing the Reactome fatty acid synthesis pathway (R-HSA-211935) genes that are significantly downregulated in the RSV-ARI group compared with the HC group.

References

    1. Abbas A.A., Taylor L.J., Dothard M.I., Leiby J.S., Fitzgerald A.S., Khatib L.A., Collman R.G., Bushman F.D. Redondoviridae, a family of small, circular DNA viruses of the human oro-respiratory tract associated with periodontitis and critical illness. Cell Host Microbe. 2019;25:719–729 e714. - PMC - PubMed
    1. Abu-Ali G.S., Mehta R.S., Lloyd-Price J., Mallick H., Branck T., Ivey K.L., Drew D.A., DuLong C., Rimm E., Izard J., et al. Metatranscriptome of human faecal microbial communities in a cohort of adult men. Nat. Microbiol. 2018;3:356–366. - PMC - PubMed
    1. Anders S., Pyl P.T., Huber W. HTSeq—a Python framework to work with high-throughput sequencing data. Bioinformatics. 2015;31:166–169. - PMC - PubMed
    1. Antunes K.H., Fachi J.L., de Paula R., da Silva E.F., Pral L.P., Dos Santos A.A., Dias G.B.M., Vargas J.E., Puga R., Mayer F.Q., et al. Microbiota-derived acetate protects against respiratory syncytial virus infection through a GPR43-type 1 interferon response. Nat. Commun. 2019;10:3273. - PMC - PubMed
    1. Balique F., Colson P., Barry A.O., Nappez C., Ferretti A., Moussawi K.A., Ngounga T., Lepidi H., Ghigo E., Mege J.L., et al. Tobacco mosaic virus in the lungs of mice following intra-tracheal inoculation. PLoS One. 2013;8:e54993. - PMC - PubMed

Publication types