. 2022 Feb 4;188(2):1174-1188.
doi: 10.1093/plphys/kiab529.

A NYN domain protein directly interacts with DECAPPING1 and is required for phyllotactic pattern

Affiliations

A NYN domain protein directly interacts with DECAPPING1 and is required for phyllotactic pattern

Marlene Schiaffini et al. Plant Physiol. .

Abstract

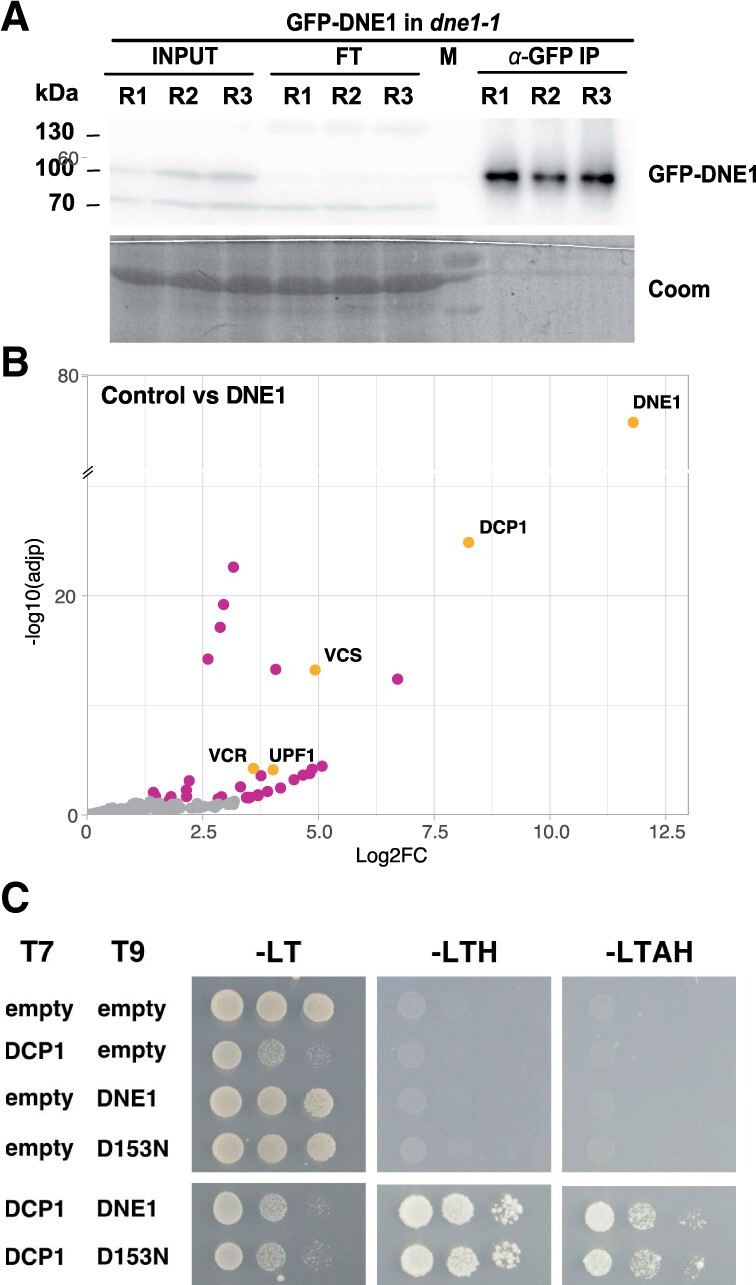
In eukaryotes, general mRNA decay requires the decapping complex. The activity of this complex depends on its catalytic subunit, DECAPPING2 (DCP2), and its interaction with decapping enhancers, including its main partner DECAPPING1 (DCP1). Here, we report that in Arabidopsis thaliana, DCP1 also interacts with a NYN domain endoribonuclease, hence named DCP1-ASSOCIATED NYN ENDORIBONUCLEASE 1 (DNE1). Interestingly, we found DNE1 predominantly associated with DCP1, but not with DCP2, and reciprocally, suggesting the existence of two distinct protein complexes. We also showed that the catalytic residues of DNE1 are required to repress the expression of mRNAs in planta upon transient expression. The overexpression of DNE1 in transgenic lines led to growth defects and a similar gene deregulation signature than inactivation of the decapping complex. Finally, the combination of dne1 and dcp2 mutations revealed a functional redundancy between DNE1 and DCP2 in controlling phyllotactic pattern formation. Our work identifies DNE1, a hitherto unknown DCP1 protein partner highly conserved in the plant kingdom and identifies its importance for developmental robustness.


Figures

Figure 1
Figure 1
Identification of proteins associated with the decapping complex components DCP1 and DCP2. A, Western blot analysis of GFP IPs performed in triplicate on extracts from YFP-DCP1 dcp1-3 and from GFP-DCP2 tdt-1 complemented lines. WT plants used as negative controls are shown in the right (control). B, Semi-volcano plot of proteins enriched in YFP-DCP1 IPs (n = 6), results provided in Supplemental Table S2. (C, Semi-volcano plot of proteins enriched in GFP-DCP2 IPs (n=3), results provided in Supplemental Table S3. Control IPs (n = 6) for results presented in (B) and (C). Colored points (yellow and magenta) indicate proteins significantly enriched with Log FoldChange (Log2FC) >1 and adjusted P-value (adjp) <0.05. Yellow points highlight expected partners of the decapping complex and DNE1. Coomassie staining (Coom), protein ladder (M), input (INPUT), flow-through (FT), and immunoprecipitated fractions (α-GFP IP).
Figure 2
Figure 2
Identification of proteins associated with the DCP1-associated endonuclease DNE1. A, Western blot analysis of GFP IPs performed in triplicate on extracts from GFP-DNE1 dne1-1 lines. Coomassie staining (Coom), protein ladder (M), input (INPUT), flow-through (FT), and immunoprecipitated fractions (α-GFP IP). B, Semi-volcano plot of proteins enriched in GFP-DNE1 IPs (n = 8), control IPs (n = 9), results provided in Supplemental Table S4. The volcano plot is represented as in Figure  1. C, Specific growth on selective media for the DCP1–DNE1 and DCP1–D153N combinations highlights the direct interaction between DCP1 and DNE1. Minimal SD medium –LT, –LTH, and –LTAH were used, in which Adenine (A); Histidine (H); Leucin (L); Tryptophan (T). 5-mM 3-AT was used to avoid autoactivation. T7: pGADT7 AD (LEU2); T9: pGBT9 BD (TRP1).
Figure 3.
Figure 3.
Crosslinked IPs improve the sensitivity for the identification of proteins associated with DCP1, DCP2, and DNE1. A, Semi-volcano plot of proteins enriched in YFP-DCP1 crosslinked IPs (n=4), results provided in Supplemental Table S5. B, Semi-volcano plot of proteins enriched in GFP-DCP2 crosslinked IPs (n = 4), results provided in Supplemental Table S6. C, Semi-volcano plot of proteins enriched in GFP-DNE1 crosslinked IPs (n = 4), results provided in Supplemental Table S7. Control IPs (n = 4) for results presented in (A–C). Colored points (yellow and magenta) indicate proteins significantly enriched with Log FoldChange (Log2FC) >1 and adjusted P-value (adjp) <0.05. Yellow points highlight expected partners of the decapping complex and DNE1, cytosolic exoribonucleases XRN4 and SOV, and the NMD protein UPF1.
Figure 4
Figure 4
DNE1 co-localizes with DCP1 and UPF1 in P-bodies. A, Confocal microscopy co-localization study of DNE1 with the stress granule marker PAB2-RFP, the P-body markers YFP-DCP1, and UPF1-RFP in stable Arabidopsis transformants. A 30-min heat stress at 37°C was applied to GFP-DNE1 PAB2-RFP to induce stress granule formation. Scale bar: 10 µm. B, Dot plot showing the quantification of foci co-localization in the green (ch1, y-axis) and red (ch2, x-axis) channels. The number of foci analyzed (n) is indicated on the plot. The calculated Pearson’s correlation coefficient (r) and P-values are indicated.
Figure 5
Figure 5
DNE1 is an evolutionary conserved NYN domain protein harboring two OST-HTH modules. A, DNE1 phylogenetic tree obtained with the maximum likelihood method. Bootstrap values are indicated for each node. B, Schematic domain structure of DNE1. In purple the catalytic NYN domain, in yellow the OST-HTH predicted RNA binding domains. C, Multiple alignments of amino-acid sequences of NYN domains from DNE1 plant orthologs as in (A). We indicate using purple uppercase D the conserved aspartic acid residues important for catalysis. D, Multiple alignments of aa sequences of OST-HTH 1 domains from DNE1 plant orthologs as in (A). E, Structural alignment of the predicted tridimensional structure of AtDNE1 NYN domain sequence (in purple) with the tridimensional crystal structure of HsMARF1 NYN domain (6fdl, Nishimura et al., 2018; in blue). Conserved D residues are shown in orange. F, Structural alignment of the predicted tridimensional structure of AtDNE1 OST-HTH1 domain sequence (in yellow) with the tridimensional crystal structure of MmMARF1 OST-HTH1 domain (5yad, Yao et al., 2018; in orange).
Figure 6
Figure 6
Transient expression of DNE1 impairs the expression of a co-expressed and endogenous mRNAs. Northern blot analysis showing the impact of the expression of RFP-DNE1 or RFP-DNE1-D153N (RFP-D153N) on mRNA accumulation in N. benthamiana, empty plasmid (−) is used as a control. Methylene blue staining showing ribosomal RNAs (rRNA) and a U6 probe are used as loading controls.
Figure 7
Figure 7
Altering DNE1 expression impairs plant growth and leads to the same gene deregulation signature compared to mutations in VCS and DCP2. A, Pictures of WT, dne1-1, GFP-DNE1 and GFP-D153N overexpressors (OEs) 14 d after planting. Scale bar: 1 cm. B, Analysis of GFP-DNE1 and GFP-D153N transgenic lines by Western blot using anti-GFP antibody. Two independent plant lines 1 and 2 are analyzed for GFP-DNE1 and one for the GFP-D153N. Coomassie staining used as a loading control (Coom). C, Histogram showing the global changes in gene expression based on RNAseq analyses in dne1-1, GFP-DNE1 OE, GFP-D153N OE, and vcs-6 compared to the WT. Genes were considered as upregulated and downregulated when adjusted P <0.05 and Log2FC >0.75 or Log2FC less than −0.75, respectively (n ≥ 3). Y-axis represents the number of deregulated genes. D, Venn diagrams showing comparisons between significantly upregulated or downregulated genes in DNE1 OE or D153N OE lines and vcs-6. E, Boxplot comparing the change levels (Log2FC) between the different genotypes of the 64 genes that are commonly upregulated in both DNE1 and D153N lines. F, Venn diagrams showing comparisons between significantly upregulated or downregulated genes in D153N OE, vcs-6, and the weak dcp2 mutant tdt-1. G, Box plot showing the proportion of uncapped transcripts as found by GMUCT in Anderson et al. (2018) for all genes detected in RNAseq (all), genes not deregulated in any genotypes (other), and genes deregulated in vcs-6 or D153N OE lines. In (E) and (G) boxplots display the median, first, and third quartiles (lower and upper hinges), the largest value smaller and the smallest value larger than the 1.5 interquartile (upper and lower whiskers). Letters in (E) and (G) show statistically (P <0.05) different groups based on a Wilcoxon rank-sum test. The complete statistical analysis of Figure  7 is provided in Supplemental Table S9.
Figure 8
Figure 8
Synergistic effect of mutations in dne1 and dcp2 on phyllotactic pattern. A, Pictures showing representative stems from the WT, dcp2its1, dne1-2, dne1-2 dcp2its1, dne1-3, dne1-3 dcp2its1, and xrn4-3 plants. B, Density plots showing the quantification of divergent angles from the genotypes shown in (A). The analysis was performed on three to four biological replicates. Differences between divergent angles distribution was assessed using the Kolmogorov–Smirnov test, complete results are shown in Supplemental Table S12. The analysis is shown for each biological replicates separately in Supplemental Figure S6.

References

    1. Anderson SJ, Kramer MC, Gosai SJ, Yu X, Vandivier LE, Nelson ADL, Anderson ZD, Beilstein MA, Fray RG, Lyons E, et al. (2018) N6-methyladenosine inhibits local ribonucleolytic cleavage to stabilize mRNAs in Arabidopsis. Cell Rep 25: 1146–1157.e3 - PubMed
    1. Arribas-Layton M, Wu D, Lykke-Andersen J, Song H (2013) Structural and functional control of the eukaryotic mRNA decapping machinery. Biochim Biophys Acta 1829: 580–589 - PMC - PubMed
    1. Ayache J, Bénard M, Ernoult-lange M, Minshall N, Standart N, Kress M, Weil D (2015) P-body assembly requires DDX6 repression complexes rather than decay or Ataxin2/2L complexes. Mol Biol Cell 26: 2579–2595 - PMC - PubMed
    1. Bassal M, Abukhalaf M, Majovsky P, Thieme D, Herr T, Ayash M, Tabassum N, Al Shweiki MR, Proksch C, Hmedat A, et al. (2020) Reshaping of the Arabidopsis thaliana proteome landscape and co-regulation of proteins in development and immunity. Mol Plant 13: 1709–1732 - PubMed
    1. Besnard F, Refahi Y, Morin V, Marteaux B, Brunoud G, Chambrier P, Rozier F, Mirabet V, Legrand J, Lainé S, et al. (2014) Cytokinin signalling inhibitory fields provide robustness to phyllotaxis. Nature 505: 417–421 - PubMed

Publication types

MeSH terms

LinkOut - more resources