. 2022 Jan 20;34(1):395-417.
doi: 10.1093/plcell/koab276.

Potentiation of plant defense by bacterial outer membrane vesicles is mediated by membrane nanodomains

Affiliations

Potentiation of plant defense by bacterial outer membrane vesicles is mediated by membrane nanodomains

Tuan Minh Tran et al. Plant Cell. .

Abstract

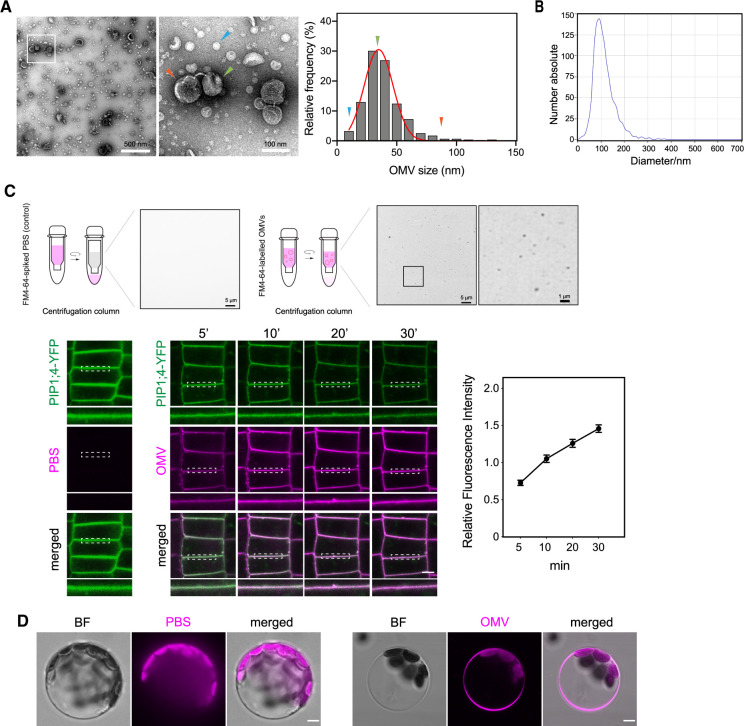
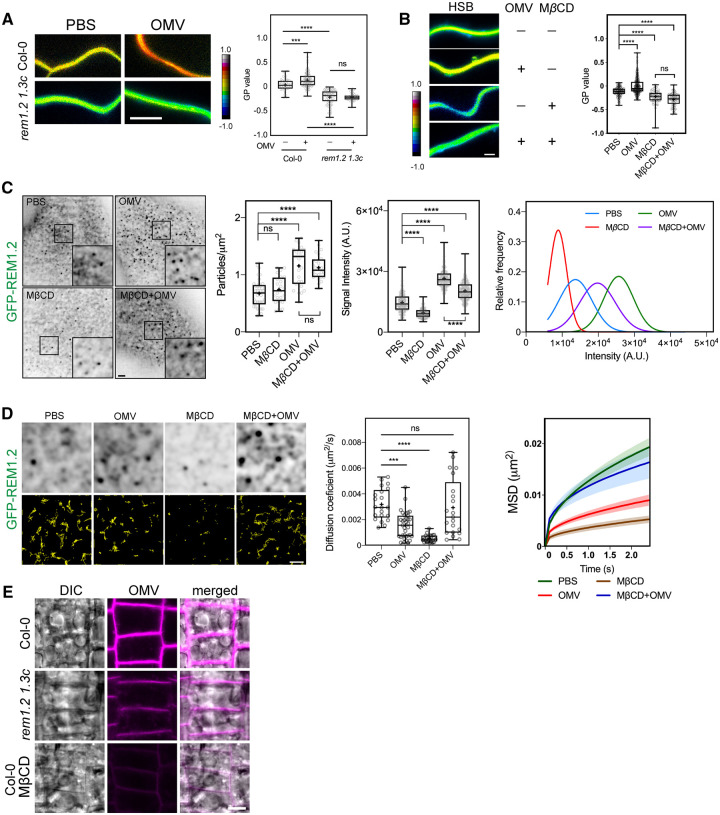
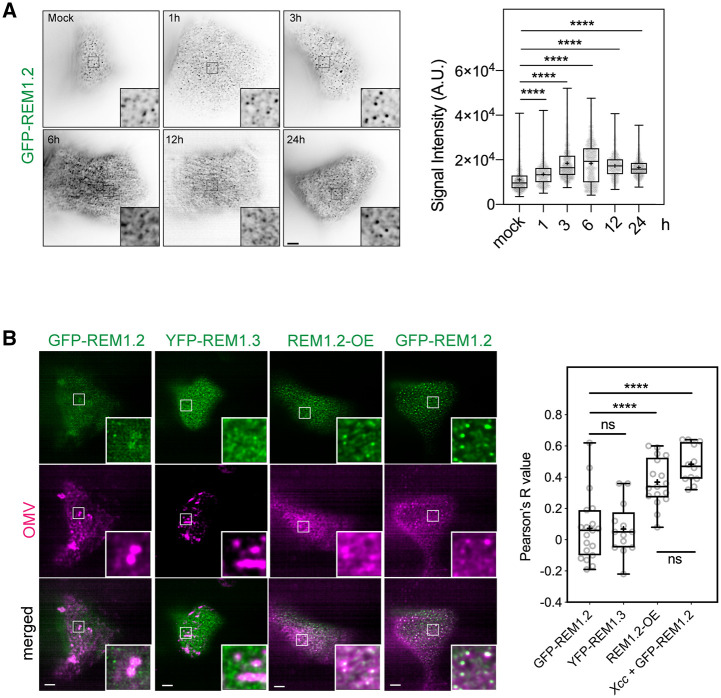
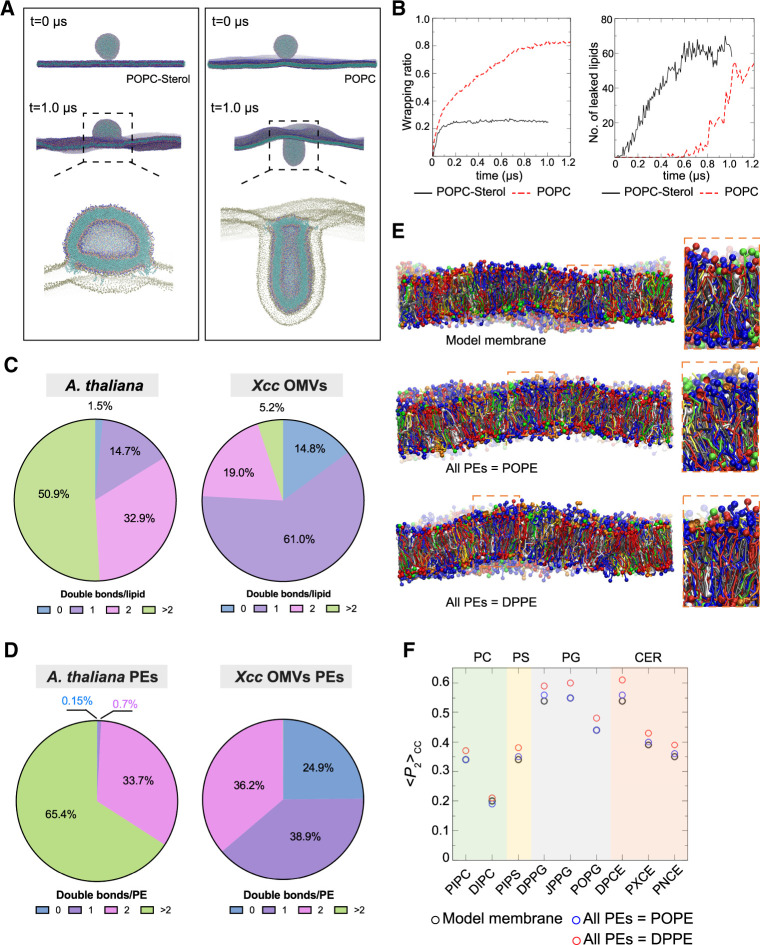
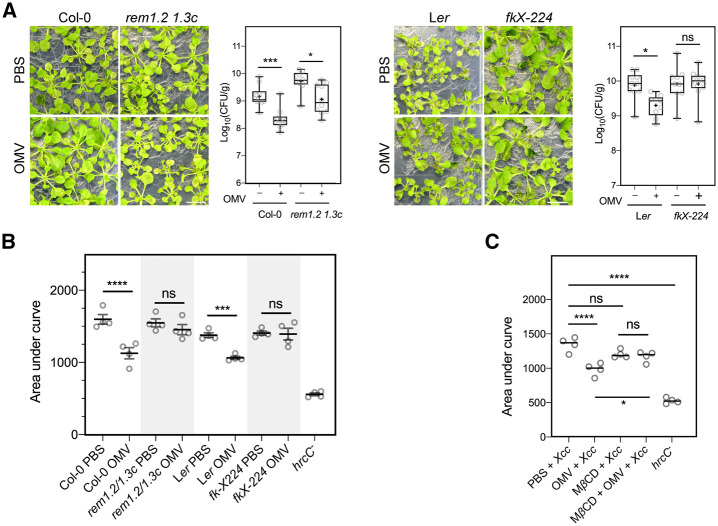
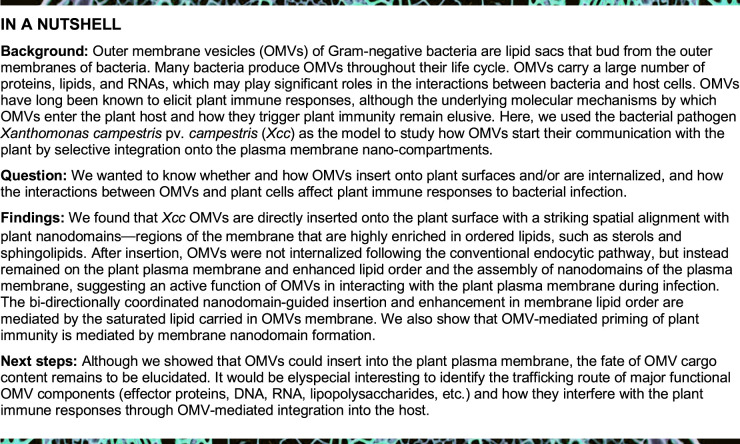
Outer membrane vesicles (OMVs) are released from the outer membranes of Gram-negative bacteria during infection and modulate host immunity during host-pathogen interactions. The mechanisms by which OMVs are perceived by plants and affect host immunity are unclear. Here, we used the pathogen Xanthomonas campestris pv. campestris to demonstrate that OMV-plant interactions at the Arabidopsis thaliana plasma membrane (PM) modulate various host processes, including endocytosis, innate immune responses, and suppression of pathogenesis by phytobacteria. The lipid phase of OMVs is highly ordered and OMVs directly insert into the Arabidopsis PM, thereby enhancing the plant PM's lipid order; this also resulted in strengthened plant defenses. Strikingly, the integration of OMVs into the plant PM is host nanodomain- and remorin-dependent. Using coarse-grained simulations of molecular dynamics, we demonstrated that OMV integration into the plant PM depends on the membrane lipid order. Our computational simulations further showed that the saturation level of the OMV lipids could fine-tune the enhancement of host lipid order. Our work unraveled the mechanisms underlying the ability of OMVs produced by a plant pathogen to insert into the host PM, alter host membrane properties, and modulate plant immune responses.


Figures

Figure 1
Figure 1
Bacterial OMVs’ morphology and direct insertion of OMVs into plant PM. A, TEM micrographs of OMVs extracted from cell-free Xcc culture supernatant from NYG culture (bar, 500 nm in the left and 100 nm in the right). Arrowheads indicate several representative sizes of OMVs observed in the electron micrographs. The frequency distribution of OMV diameter was curve fitted using Gaussian distribution with GraphPad Prism 8.0. B, Diameter of Xcc OMVs measured by NTA. C, Labeling of Xcc OMVs with FM4–64 dye using centrifugal filter (bars, 5 µm and 1 µm) and fusion of FM4–64-labeled Xcc OMV to plant PM. Super-resolution of FM4–64-labeled OMVs was acquired on a Nikon Ti2 system equipped with Live-SR structured illumination microscopy. Xcc OMVs was labeled with FM4–64 dye, then applied onto Arabidopsis YFP-PIP1;4 seedling roots. Seedlings were mounted immediately, and the confocal images of root cells were taken at indicated time-points up to 30 min after incubation. Insets beneath each image are regions marked by white dashed boxes (bar, 5 µm). Relative fluorescence intensity of FM4–64 (OMV) signal on the PM over time was measured by Fiji and normalized to the intensity of the corresponding ROIs in the Green (YFP-PIP1;4) channel. In addition, PBS buffer was spiked with FM4–64 dye, subjected to centrifugation on a centrifugal column and the left-over buffer on the column was used to apply onto YFP-PIP1;4 plants and imaged as control. D, Integration of FM4–64 labeled OMVs into the PM of Arabidopsis Col-0 protoplast. FM4–64-labeled Xcc OMVs were applied on leaf protoplasts for 30 min (bar, 5 µm) prior to imaging.
Figure 2
Figure 2
OMVs increase the lipid order of the plant PM in a nanodomain assembly-dependent manner. A, OMVs induced an increase in lipid order of Arabidopsis PM. PM order was monitored in Col-0 and rem1.2 1.3c double mutants treated with PBS or OMVs (30 µg·mL1, 30 min) using the lipid dye di-4-ANEPPDHQ (N = 3 plants, bar, 5 µm). B, OMV-induced lipid order increase could be reverted by an acute sterol depletion using MβCD. Col-0 seedlings were incubated with PBS, MβCD (N = 3 plants, 2 mM, 30 min), Xcc OMVs (30 µg·mL1), or MβCD followed by an OMV treatment prior to staining with di-4-ANEPPDHQ dye (bar, 1 µm). C, Density and signal intensity of GFP-REM1.2 foci on Arabidopsis PM. Seven-day-old pREM1.2:GFP-REM1.2 seedlings were treated with PBS, MβCD (2 mM, 30 min), OMV (30 µg·mL1, 30 min) or a sequential treatment of both MβCD and OMV, then washed with 1/2 MS and imaged using a VA-TIRF microscope. GFP-REM1.2 foci density and signal intensity were quantified using TrackMate in Fiji (N ≥ 3 plants, bar, 1 µm). D, Dynamics of REM1.2 foci on Arabidopsis PM. pREM1.2:GFP-REM1.2 seedlings were tracked and diffusion coefficient was measured with SpatTrack (bar, 1 µm). Representative tracks were shown for 100-frame time-lapse movies, with 100-ms intervals. E, OMVs insertion is dependent on membrane nanodomain. Vertically grown Col-0 and rem1.2 1.3c mutant were inoculated with FM4–64-labeled OMV (100 µg·mL1) for 30 min before imaging (bar, 5 µm).
Figure 3
Figure 3
Colocalization of remorins with FM4–64-labelled OMVs. A, Time-dependent increment of GFP-REM1.2 intensity on Arabidopsis PM after flooding inoculation with Xcc. Seven-day-old pREM1.2:GFP-REM1.2 seedlings were flooded with 1 × 107 CFU·mL1 bacterial suspension before TIRFM imaging at the indicated times post-inoculation. Images of GFP-REM1.2 foci were acquired by VA-TIRFM using a Zeiss LSM780 + ELYRA microscope, equipped with a 100× oil objective (NA = 1.46, bar, 5 µm). B, VA-TIRF dual imaging of the colocalization of GFP-REM1.2, YFP-REM1.3, GFP-REM1.2 in the XVE:GFP-REM1.2 seedlings (REM1.2-OE) and under infection condition (flooded with Xcc 8004 and incubated for 6 h) with FM4–64-labeled OMVs. VA-TIRF dual-color images were acquired by a Zeiss LSM780 + ELYRA microscope equipped with a 100× oil-objective lens. XVE:GFP-REM1.2 seedlings were induced with 5-µM β-estradiol for 24 h prior to imaging (bar, 5 µm). Violin plot shows Person’s R values, representing the colocalization between remorins and FM4–64 labeled OMVs. The differences between treatments were determined by one-way ANOVA (ns, not significant, *P≤0.05; **P≤0.01, ***P≤0.001, ****P≤0.0001).
Figure 4
Figure 4
Simulation of OMV-plant PM interaction and the lipid order modulation in model plant membrane by receiving OMV lipids. A, Molecular simulation snapshots of a 23-nm diameter POPC vesicle placed above a POPC-sterol (1:1) (Left) or POPC (Right) planar membrane at the beginning of the simulation and after 1 μs. Bottom panels show the cross-sectional views. Phospholipid particles are colored as follows: head-group particles in blue, phosphate particles in dark green, glycerol particles in pink, and fatty acid tail particles in cyan. Sterol particles are colored as follows: head-group particles in purple and the rest in cyan. B, The temporal evolution of the wrapping ratio (Left) and number of vesicle lipids leaked into planar membrane (Right) for systems in (A): POPC-sterol membrane (black solid line) and a control system (POPC membrane, red dashed line). C, Saturation levels of lipids in Arabidopsis and Xcc OMVs characterized by lipidomic analyses. Data represent the mean of six biological replicates (N = 6). Results of the Arabidopsis lipidome were reported previously (Tran et al., 2020). D, Saturation levels of PEs in Arabidopsis and Xcc OMVs characterized by lipidomic analyses. Data represent mean of six biological replicates (N = 6). E, Side views of the simplified Arabidopsis PM model (Top) and the ones with all PEs replaced by POPE (Middle) or by DPPE (DP: dipalmitoyl) (Bottom) after 2 μs of simulation. Lipids are in ball-and-stick representation and colored as follows: sterols in gray, PEs in red, PCs in blue, PGs in green, phosphatidylserines (PSs) in yellow, ceramides in white, and galactolipids in orange. Each lipid has one of its head-group particles shown as a sphere (except for sterols). F, Lipid order parameters averaged over fatty acid tail particles from both tails for phospholipids (PC, PS, PG) and ceramides (CER) with PE tails being poly-unsaturated (original: 1-palmitoyl-2-linoleoyl or PI, dilinoleoyl or DI), mono-unsaturated (PO) or saturated (DP). JPPG (C16:1(3t)/16:0 PG) is phosphatidylglycerol lipid with trans-3-hexadecenoic acid tail (sn1) and a palmitoyl (sn2) tail. DPCE, PXCE, and PNCE are ceramides with 18:0, 24:0, and 24:1 fatty acid tail, respectively. See Supplemental Data Set S4 for detailed information on the fatty acid tails.
Figure 5
Figure 5
Protective effect of Xcc OMVs against bacterial infection. A, OMVs protect Arabidopsis seedlings from Xcc infection. OMVs from Xcc 8004 were extracted as indicated above. Arabidopsis Col-0, rem1.2 1.3c, Ler, and fk-X224 seedlings were incubated with 10 µg·mL1 Xcc OMVs or PBS (control) for 24 h prior to flooding inoculation with 20 mL of 107 CFU·mL1 Xcc 8004 bacterial suspension. Seedlings were sampled at 3 DPI and the bacterial population was quantified by serial dilution plating on NYG plates (three plants were pooled as a single technical replicate, N ≥ 9 replicates/treatment). Statistical differences between treatments were determined by one-way ANOVA using GraphPad Prism 8.0 (ns, not significant, *P ≤ 0.05; **P ≤ 0.01, ***P ≤ 0.001). OMV-induced protection of cell damage from pathogen infection is dependent on Remorin and sterol balance (bars, 1 cm). B, Arabidopsis leaf discs of WT ecotypes (Col-0, Ler), remorin double mutant (rem1.2 1.3c), sterol biosynthesis mutant (fk-X224 – Ler background) were incubated with Xcc OMV (30 µg·mL1) for 24 h, then infiltrated with Xcc 8004. Xcc hrcC was infiltrated into Col-0 leaf discs as the negative control. AUC of conductivity increase was calculated by GraphPad Prism 8.0 and statistical differences between treatments were determined by one-way ANOVA (ns, not significant, *P ≤ 0.05; **P ≤ 0.01, ***P ≤ 0.001, ****P ≤ 0.0001). C, Ion leakage measurement from Arabidopsis Col-0 leaf discs incubated with OMVs (30 µg·mL1), MβCD (2 mM), or a combination of both (MβCD +OMV) prior to vacuum infiltration with Xcc 8004 (WT). The Xcc hrcC- mutant was used as the negative control. Statistical differences between treatments were determined by one-way ANOVA (ns, not significant, *P ≤ 0.05; **P ≤ 0.01; ***P ≤ 0.001; ****P < 0.0001).
None

Comment in

  • Back to the roots: A focus on plant cell biology.
    Weijers D, Bezanilla M, Jiang L, Roeder AHK, Williams M. Weijers D, et al. Plant Cell. 2022 Jan 20;34(1):1-3. doi: 10.1093/plcell/koab278. Plant Cell. 2022. PMID: 34755878 Free PMC article. No abstract available.

References

    1. Abel NB, Buschle CA, Hernandez-Ryes C, Burkart SS, Deroubaix A-F, Mergner J, Gronnier J, Jarsch IK, Folgmann J, Braun KH (2021) A hetero-oligomeric remorin-receptor complex regulates plant development. bioRxiv, 10.1101/2021.01.28.428596 (January 29, 2021) - DOI
    1. Abraham MJ, Murtola T, Schulz R, Páll S, Smith JC, Hess B, Lindahl E (2015) GROMACS: high performance molecular simulations through multi-level parallelism from laptops to supercomputers. SoftwareX 1: 19–25
    1. Adani F, Papa G, Schievano A, Cardinale G, D’Imporzano G, Tambone F (2011) Nanoscale structure of the cell wall protecting cellulose from enzyme attack. Environ Sci Technol 45: 1107–1113 - PubMed
    1. Albers P, Üstün S, Witzel K, Kraner M, Börnke F (2019) A remorin from Nicotiana benthamiana interacts with the Pseudomonas type-III effector protein HopZ1a and is phosphorylated by the immune-related kinase PBS1. Mol Plant-Microbe Interact 32: 1229–1242 - PubMed
    1. Arnarez C, Uusitalo JJ, Masman MF, Ingólfsson HI, De Jong DH, Melo MN, Periole X, De Vries AH, Marrink SJ (2015) Dry Martini, a coarse-grained force field for lipid membrane simulations with implicit solvent. J Chem Theory Comput 11: 260–275 - PubMed

Publication types

MeSH terms

LinkOut - more resources