. 2022 Jan;9(1):e2101235.
doi: 10.1002/advs.202101235. Epub 2021 Nov 17.

Smad3 Promotes Cancer-Associated Fibroblasts Generation via Macrophage-Myofibroblast Transition

Affiliations

Smad3 Promotes Cancer-Associated Fibroblasts Generation via Macrophage-Myofibroblast Transition

Philip Chiu-Tsun Tang et al. Adv Sci (Weinh). 2022 Jan.

Abstract

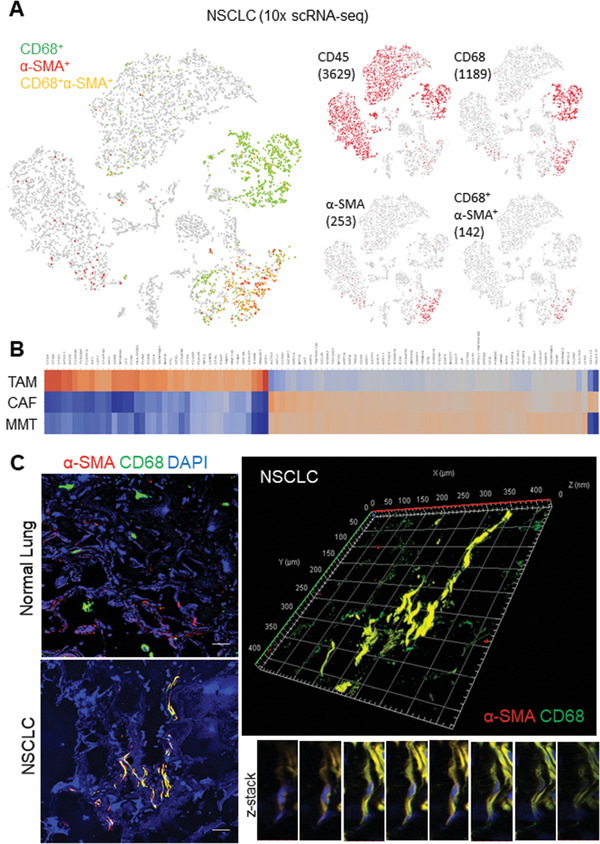
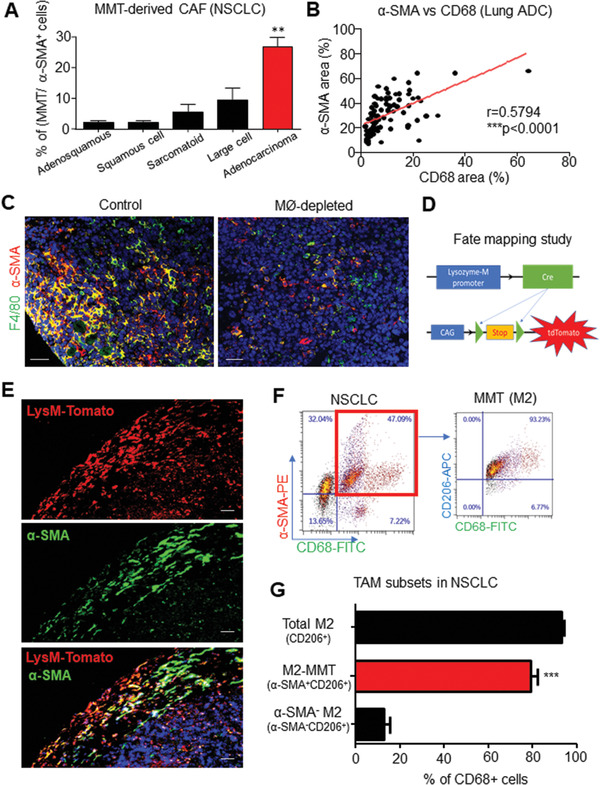
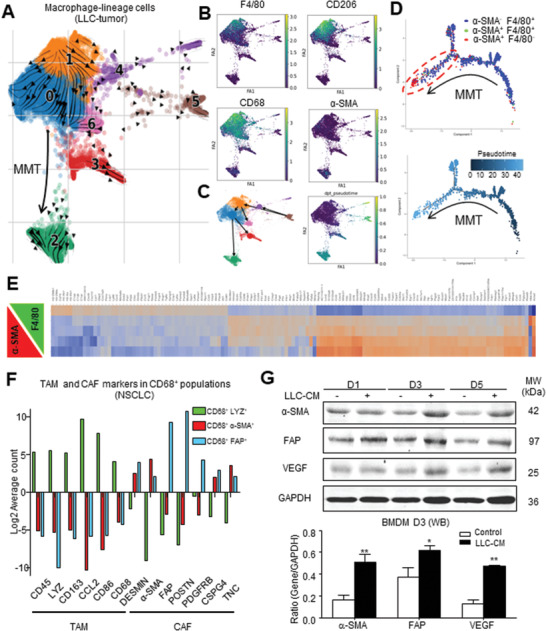
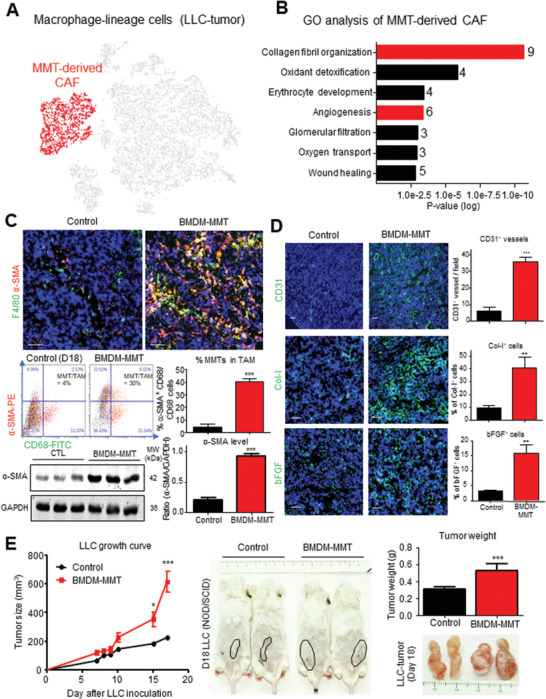
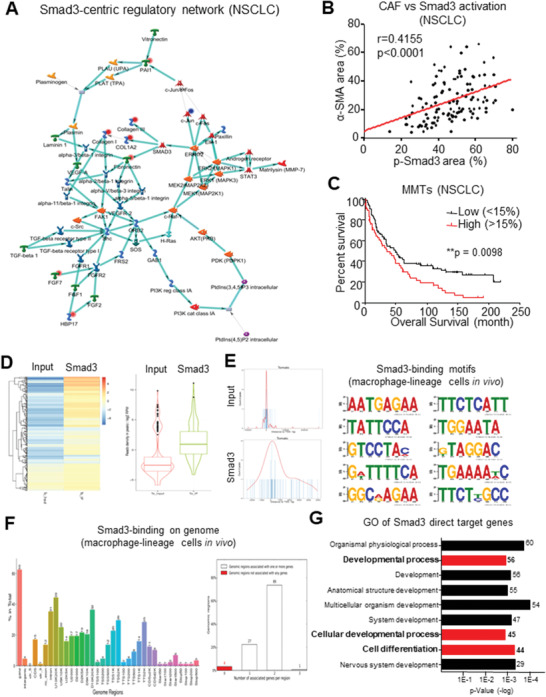
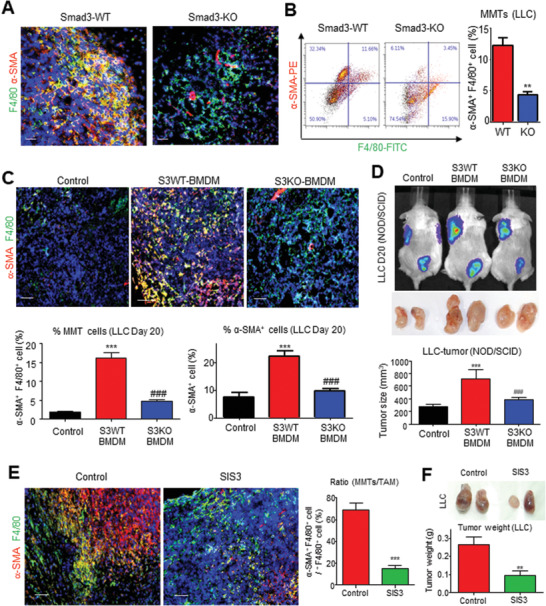
Cancer-associated fibroblasts (CAFs) are important in tumor microenvironment (TME) driven cancer progression. However, CAFs are heterogeneous and still largely underdefined, better understanding their origins will identify new therapeutic strategies for cancer. Here, the authors discovered a new role of macrophage-myofibroblast transition (MMT) in cancer for de novo generating protumoral CAFs by resolving the transcriptome dynamics of tumor-associated macrophages (TAM) with single-cell resolution. MMT cells (MMTs) are observed in non-small-cell lung carcinoma (NSCLC) associated with CAF abundance and patient mortality. By fate-mapping study, RNA velocity, and pseudotime analysis, existence of novel macrophage-lineage-derived CAF subset in the TME of Lewis lung carcinoma (LLC) model is confirmed, which is directly transited via MMT from M2-TAM in vivo and bone-marrow-derived macrophages (BMDM) in vitro. Adoptive transfer of BMDM-derived MMTs markedly promote CAF formation in LLC-bearing mice. Mechanistically, a Smad3-centric regulatory network is upregulated in the MMTs of NSCLC, where chromatin immunoprecipitation sequencing(ChIP-seq) detects a significant enrichment of Smad3 binding on fibroblast differentiation genes in the macrophage-lineage cells in LLC-tumor. More importantly, macrophage-specific deletion and pharmaceutical inhibition of Smad3 effectively block MMT, therefore, suppressing the CAF formation and cancer progression in vivo. Thus, MMT may represent a novel therapeutic target of CAF for cancer immunotherapy.

Keywords: Smad3; cancer-associated fibroblasts; macrophage-myofibroblast transition; tumor microenvironment; tumor-associated macrophages.


Conflict of interest statement

The authors declare no conflict of interest.

Figures

Figure 1
Figure 1
MMTs resemble as CAFs in NSCLC. A) 10x scRNA‐seq detects 142 MMTs (CD68+ α‐SMA+ cells) accounted for more than half of the CAF population (253 α‐SMA+ cells). B) Heat map showing the CAF‐like transcriptome of MMTs in the comparison of significant (p < 0.05) differentially expressed genes between TAM (CD68+ CD45+), CAFs (α‐SMA+), and MMTs (α‐SMA+CD68+) of NSCLC. C) Confocal imaging detected MMTs in NSCLC but not in normal lung tissue, and further demonstrated spindle‐like myofibroblast morphology of MMT cell by z‐stack scanning and reconstructed 3D modeling. Scale bar, 50 µm.
Figure 2
Figure 2
MMTs originate from protumoral M2 TAM. MMT highly occurred in A) adenocarcinoma of NSCLC (p < 0.01 adenocarcinoma compared with other NSCLC subtypes, one‐way analysis of variance (ANOVA), n = 121), B) where TAM (CD68) and CAF (α‐SMA) levels are positively correlated (Spearman correlation, p < 0.0001, n = 87) in our lung adenocarcinoma (ADC) cohort. C) Immunostaining showing diphtheria toxin (DT)‐driven macrophage ablation largely suppresses MMT‐dependent CAF formation (α‐SMA+CD68+) in LLC tumor on LysM‐Cre/ROSA‐DTR mice. D) Lineage tracing strategy of LysM‐Cre/ROSA‐tdTomato mice, where tdTomato open reading frame (ORF) is linked to a constant CAG promoter, which can be activated by macrophage‐specific Cre‐mediated stop codon excision, resulting in the continuous tdTomato expression in the macrophage lineage. E) Immunofluorescence visualizes macrophage‐lineage‐derived CAFs (α‐SMA+ tdTomato+) in LLC tumor at day 12. M2‐TAM are the major source of F) M2‐MMTs (α‐SMA+CD206+CD68+) in human NSCLC TME quantifying by G) flow cytometry analysis (***p < 0.001 M2‐MMT versus α‐SMA M2, one‐way ANOVA, n = 6). Scale bar, C) 50 and E) 25 µm.
Figure 3
Figure 3
Macrophage‐lineage scRNA‐seq captures the de novo formation of CAFs from TAM. RNA velocity and pseudotime analysis showing the de novo generation of CAFs via MMT in the developmental trajectory of macrophage lineage since TAM (α‐SMAF4/80+, cluster 1 in A‐C) RNA velocity projected plot, D) blue dots in pseudo‐timeline), to MMTs (α‐SMA+F4/80+, cluster 0, green dots), then finally to CAFs (α‐SMA+F4/80, cluster 2, red dots), associated with the successive transcriptional change of a panel of TAM to CAF markers observed in E) murine macrophage‐lineage tracing study and F) human NSCLC. G) LLC‐derived cancer secretome (LLC‐CM) effectively induces macrophage–myofibroblast transition on BMDM in vitro, showing by the progressive expression of CAF markers (α‐SMA, FAP) and effector (VEGF) compared to the control in western blot (*p < 0.05 vs control, **p < 0.01 vs control, one‐way ANOVA, n = 3).
Figure 4
Figure 4
MMT generates angiogenic CAFs for tumor promotion. GO analysis (DAVID) reveals upregulated DEGs of A) macrophage‐derived CAFs (α‐SMA+ cells, red‐highlighted) in macrophage‐lineage scRNA‐seq of LLC‐TME were highly associated with B) protumoral CAF functions (collagen fibril organization, and angiogenesis). BMDM‐derived MMTs (BMDM‐MMT) adoptive transfer significantly increased the C) transition and CAF formation (% of MMTs in TAM population and α‐SMA protein level; n = 4, ***p < 0.01 vs control, t‐test) and D) angiogenesis (CD31, Col‐I, and bFGF; n = 4, ***p < 0.001, **p < 0.01 vs control, t‐test) detected by immunofluorescence, flow cytometry and western blotting and E) resulted in a dramatic acceleration of tumor growth in macrophage‐malfunctioned NOD/SCID mice in vivo (*p < 0.05, ***p < 0.001 versus control, one‐way ANOVA (growth curve), t‐test (tumor weight), n = 4). Scale bar, 50 µm.
Figure 5
Figure 5
MMT is associated with Smad3‐wild‐type TME. A) A Smad3‐centric regulatory gene network is reconstructed with the upregulated DEGs of human α‐SMA+ CD68+ MMTs in NSCLC by MetaCore. B) Our NSCLC cohort reveals Smad3 activation level (p‐Smad3) positively correlated with CAF abundance (α‐SMA) (Spearman correlation, p < 0.0001, n = 121). C) Survival analysis of NSCLC cohort finds the weight of MMTs in CAFs >15% (α‐SMA+CD68+/α‐SMA+; n = 58 (MMTs/CAFs > 15%) and n = 103 (MMTs/CAFs < 15%)) were significantly associated with the poor overall survival of NSCLC patients (log‐rank test, p = 0.0098, n = 161). D) Heat map and box plot showing Smad3 immuno‐enrichment of genomic sequences in macrophage‐lineage cells (tdTomato+ cells) in LLC tumors, where cell‐type‐specific Smad3 binding preference on E) conserved sequence and F) function regions were identified by motif analysis and peak annotation. G) GO analysis (DAVID) reveals that Smad3 direct target genes were highly associated with cell developmental process and cell differentiation.
Figure 6
Figure 6
Macrophage‐specific Smad3 is a key regulator of MMT in NSCLC. Smad3 deletion significantly suppresses MMT (α‐SMA+ F4/80+) compared to Smad3‐WT mice: A) visualized by immunofluorescence and B) quantified by flow cytometric analysis (** p < 0.01 vs WT, n = 4, t‐test). C) Immunofluorescence and quantification shows that Smad3 deletion in adoptively transferred BMDM significantly suppresses the level of MMTs and α‐SMA+ CAFs in the LLC tumor of the S3KO‐BMDM group compared with S3WT‐BMDM group (***p < 0.001 vs control, ###p < 0.001 vs S3WT‐BMDM, one‐way ANOVA, n = 4). D) Live bioluminescence imaging, and tumor volume shows macrophage‐specific Smad3 blockade significantly inhibits the LLC‐luc cancer progression in S3KO‐BMDM group compared with the S3WT‐BMDM group (***p < 0.001 vs control, ###p < 0.001 vs S3WT‐BMDM, one‐way ANOVA, n = 4). Immunofluorescent shows that Smad3 inhibition by specific inhibitor SIS3 significantly suppresses E) the level of MMTs and F) tumor growth in the 5 mg kg−1 SIS3 treatment group compared with the solvent control group (***p < 0.001 vs control, **p < 0.01 vs control, one‐way ANOVA, n = 4). Scale bar, 50 µm.

References

    1. Costa A., Kieffer Y., Scholer‐Dahirel A., Pelon F., Bourachot B., Cardon M., Sirven P., Magagna I., Fuhrmann L., Bernard C., Bonneau C., Kondratova M., Kuperstein I., Zinovyev A., Givel A. M., Parrini M. C., Soumelis V., Vincent‐Salomon A., Mechta‐Grigoriou F., Cancer Cell 2018, 33, 463. - PubMed
    1. Sakai T., Aokage K., Neri S., Nakamura H., Nomura S., Tane K., Miyoshi T., Sugano M., Kojima M., Fujii S., Kuwata T., Ochiai A., Iyoda A., Tsuboi M., Ishii G., Lung Cancer 2018, 126, 64. - PubMed
    1. Calaf G. M., Zepeda A. B., Castillo R. L., Figueroa C. A., Arias C., Figueroa E., Farias J. G., Int. J. Oncol. 2015, 47, 437. - PubMed
    1. Quail D. F., Joyce J. A., Nat. Med. 2013, 19, 1423. - PMC - PubMed
    1. Raz Y., Cohen N., Shani O., Bell R. E., Novitskiy S. V., Abramovitz L., Levy C., Milyavsky M., Leider‐Trejo L., Moses H. L., Grisaru D., Erez N., J. Exp. Med. 2018, 215, 3075. - PMC - PubMed

Publication types

MeSH terms

LinkOut - more resources