. 2021 Nov 18:10:e68487.
doi: 10.7554/eLife.68487.

Hydrogen sulfide blocks HIV rebound by maintaining mitochondrial bioenergetics and redox homeostasis

Affiliations

Hydrogen sulfide blocks HIV rebound by maintaining mitochondrial bioenergetics and redox homeostasis

Virender Kumar Pal et al. Elife. .

Abstract

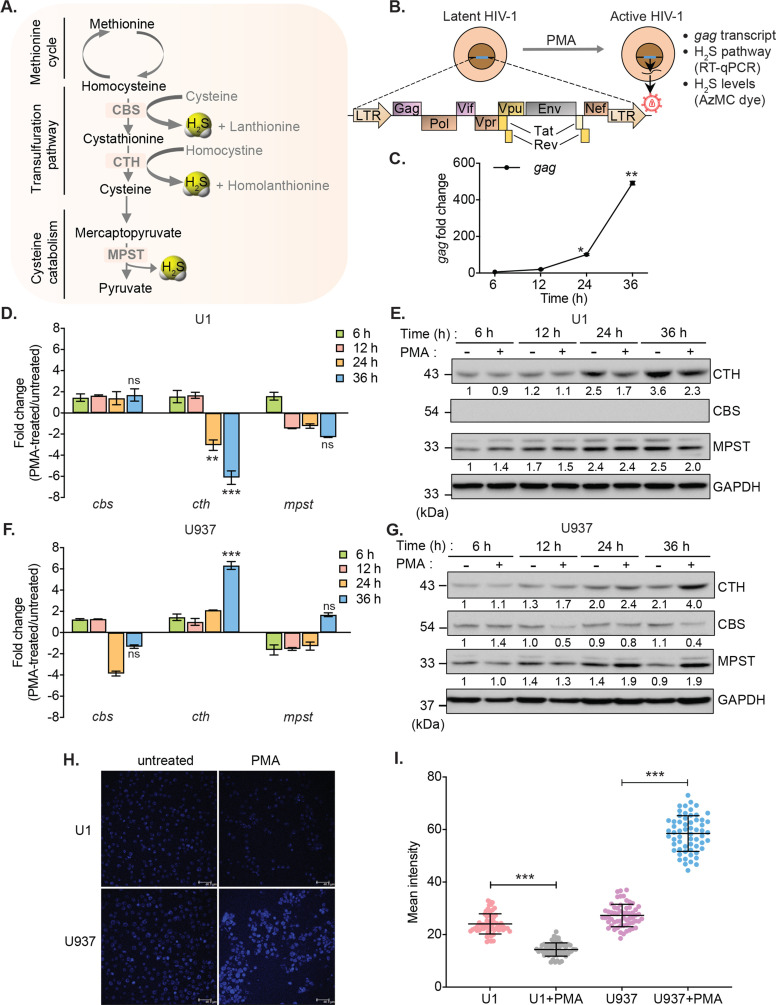
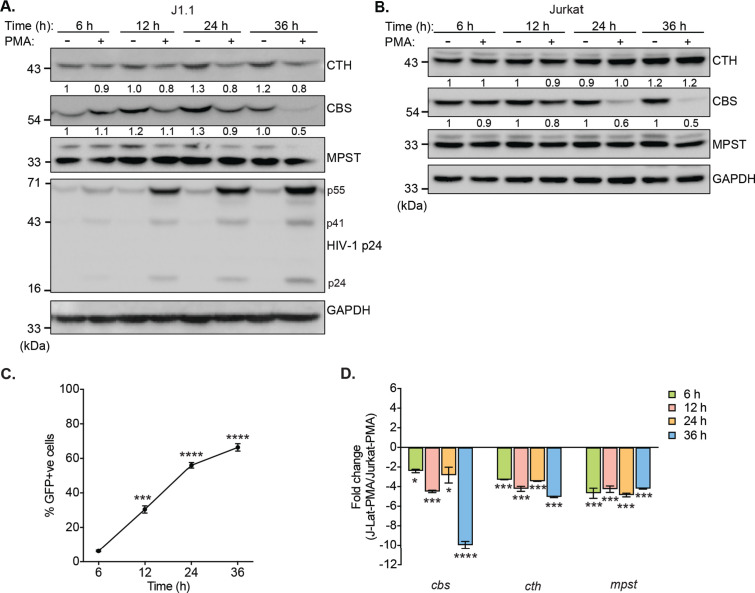
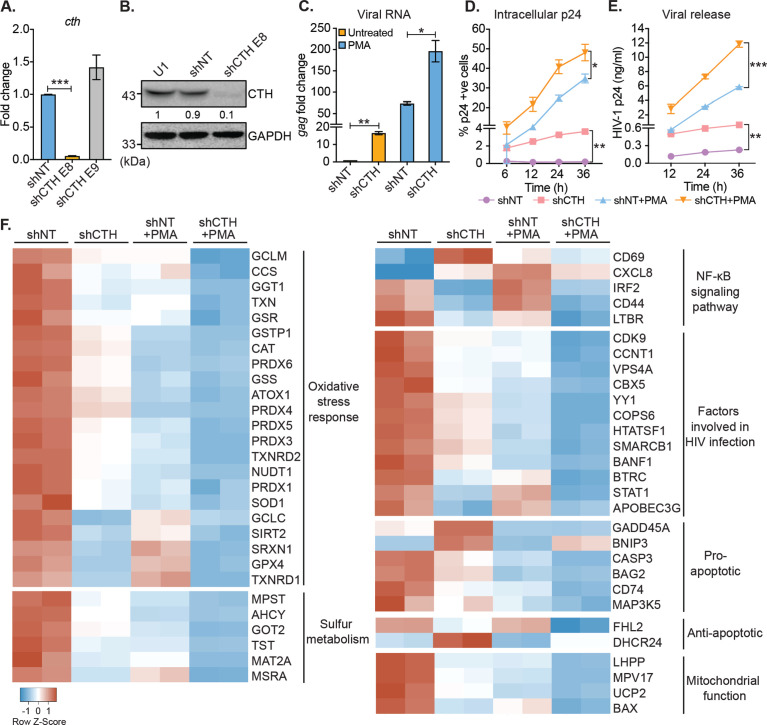
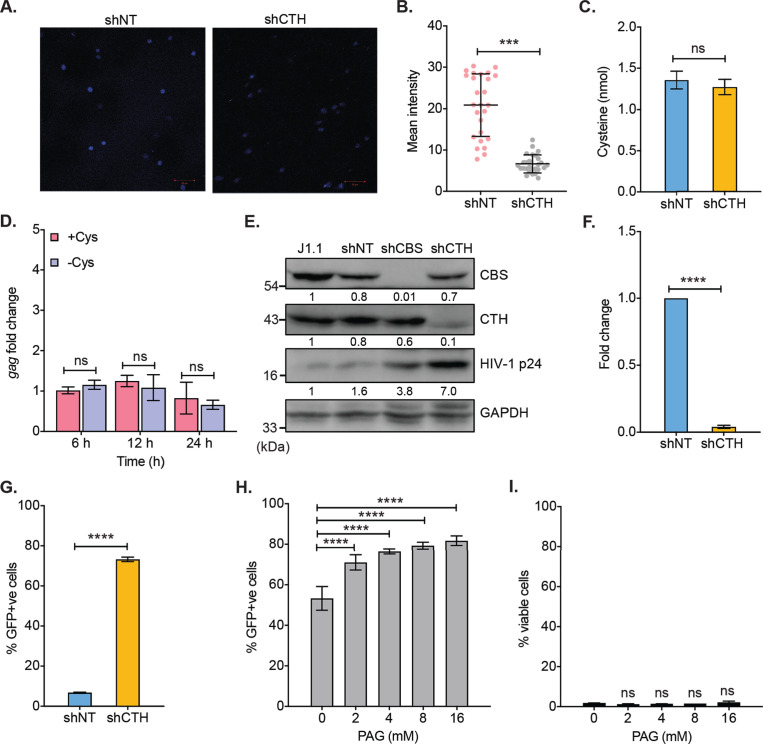
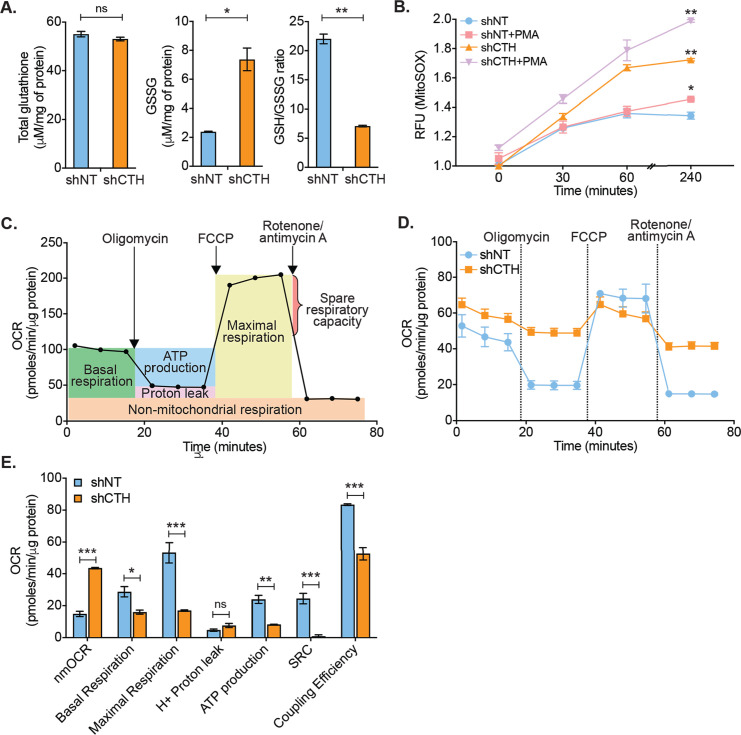
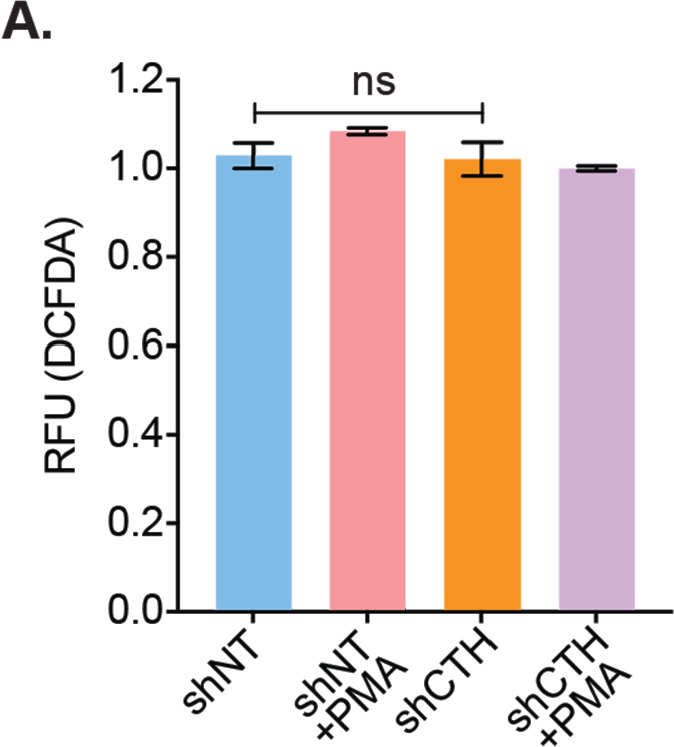
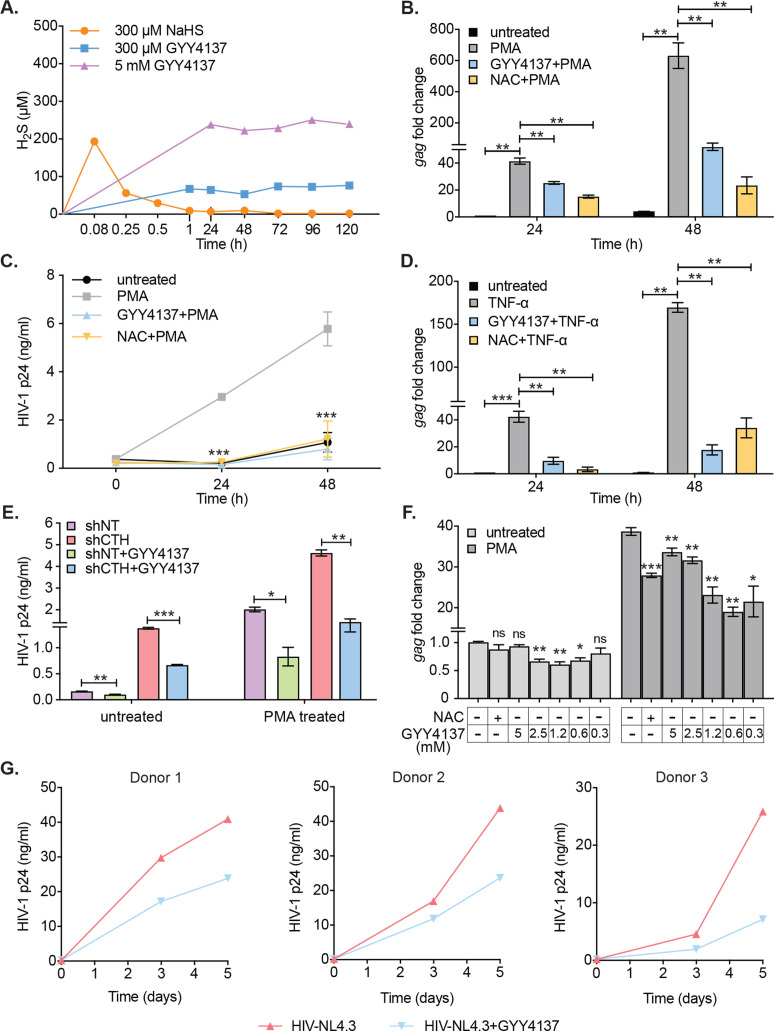
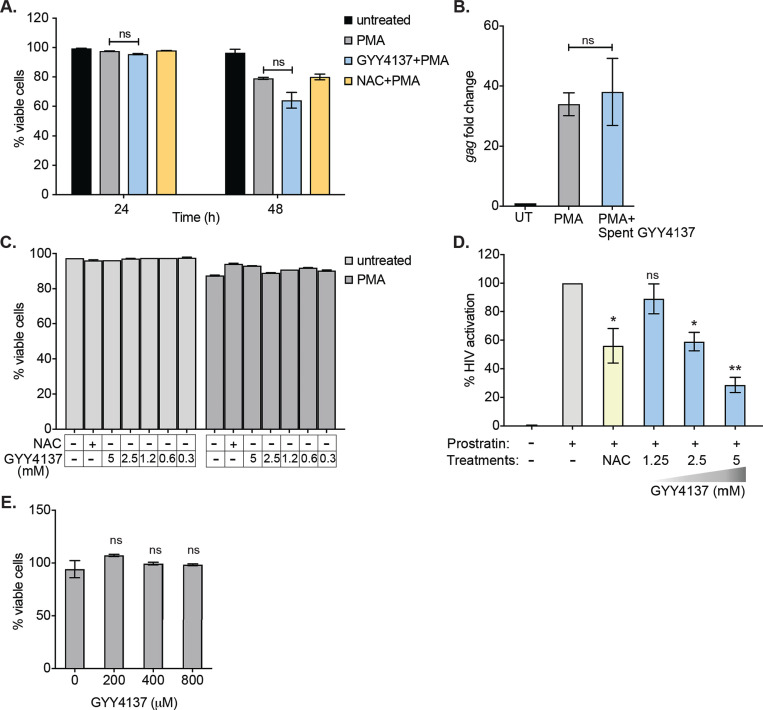
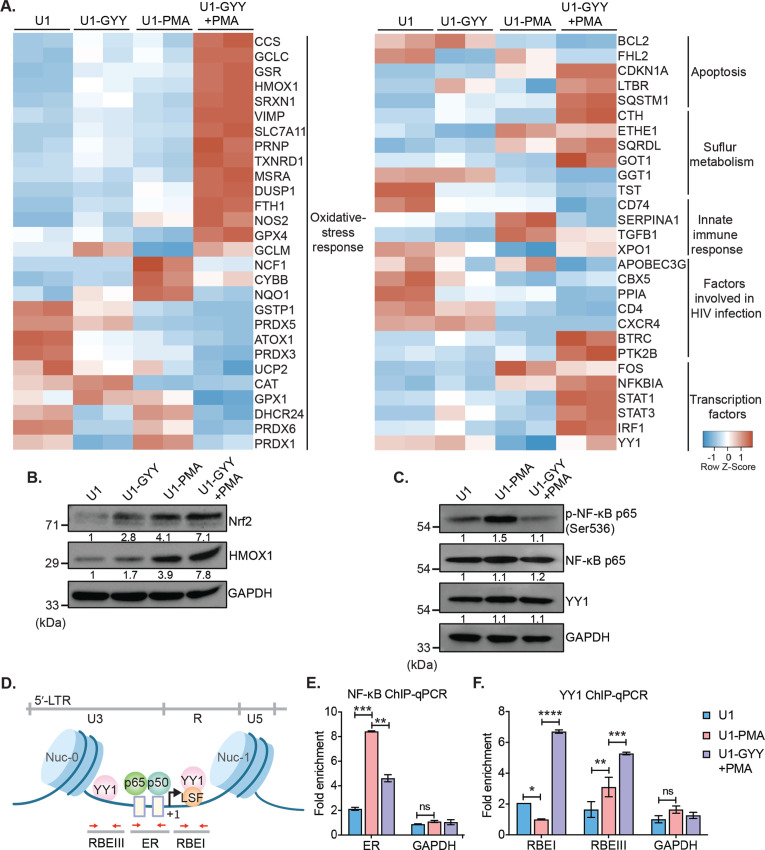
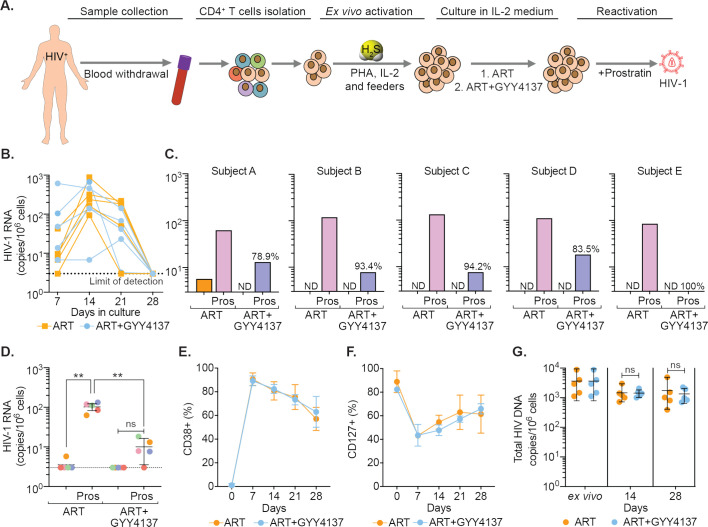
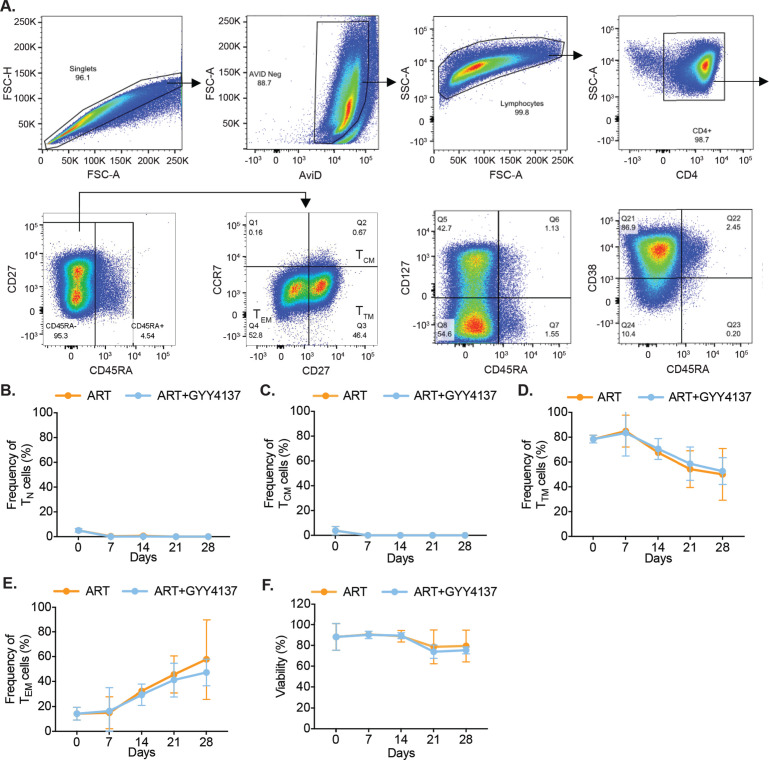
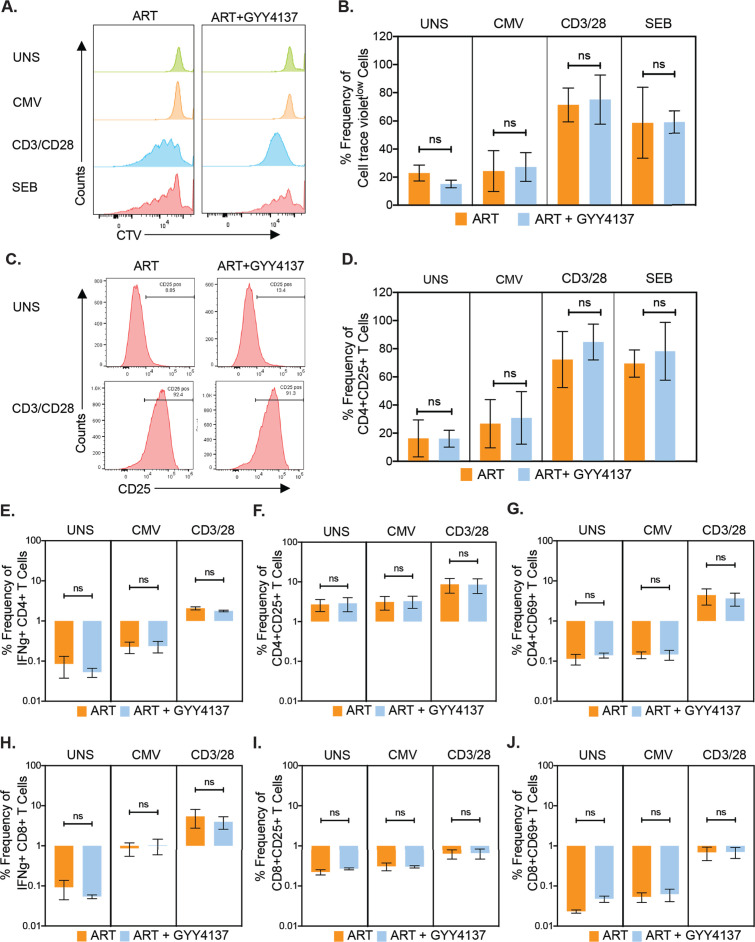
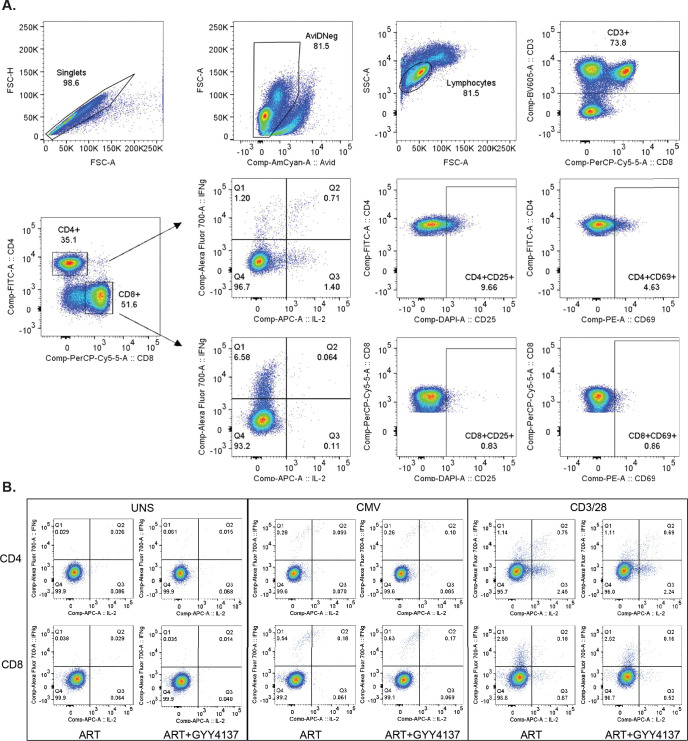
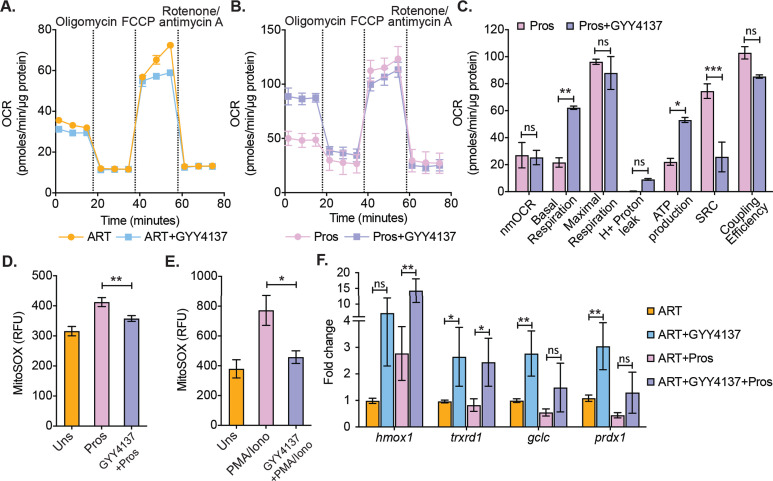
A fundamental challenge in human immunodeficiency virus (HIV) eradication is to understand how the virus establishes latency, maintains stable cellular reservoirs, and promotes rebound upon interruption of antiretroviral therapy (ART). Here, we discovered an unexpected role of the ubiquitous gasotransmitter hydrogen sulfide (H2S) in HIV latency and reactivation. We show that reactivation of HIV is associated with downregulation of the key H2S producing enzyme cystathionine-γ-lyase (CTH) and reduction in endogenous H2S. Genetic silencing of CTH disrupts redox homeostasis, impairs mitochondrial function, and remodels the transcriptome of latent cells to trigger HIV reactivation. Chemical complementation of CTH activity using a slow-releasing H2S donor, GYY4137, suppressed HIV reactivation and diminished virus replication. Mechanistically, GYY4137 blocked HIV reactivation by inducing the Keap1-Nrf2 pathway, inhibiting NF-κB, and recruiting the epigenetic silencer, YY1, to the HIV promoter. In latently infected CD4+ T cells from ART-suppressed human subjects, GYY4137 in combination with ART prevented viral rebound and improved mitochondrial bioenergetics. Moreover, prolonged exposure to GYY4137 exhibited no adverse influence on proviral content or CD4+ T cell subsets, indicating that diminished viral rebound is due to a loss of transcription rather than a selective loss of infected cells. In summary, this work provides mechanistic insight into H2S-mediated suppression of viral rebound and suggests exploration of H2S donors to maintain HIV in a latent form.

Keywords: GYY4137; T-cells; biochemistry; chemical biology; cystathionine-gamma-lyase; gasotransmitter; infectious disease; latency; microbiology; redox; viruses.


Conflict of interest statement

VP, RA, SR, PS, DM, AV, AS No competing interests declared

Figures

Figure 1.
Figure 1.. HIV-1 reactivation diminishes expression of H2S metabolic enzymes and endogenous H2S levels.
(A) Schematic showing H2S producing enzymes in mammalian cells. (B) Experimental strategy for measuring HIV-1 reactivation and H2S production in U1. (C) U1 cells were stimulated with 5 ng/ml PMA and the expression of gag transcript was measured at indicated time points. (D, E) Time-dependent changes in the expression of CTH, CBS, and MPST at mRNA and protein level during HIV-1 latency (−PMA) and reactivation (+PMA [5 ng/ml]) in U1 cells. (F, G) Time-dependent changes in the expression of CTH, CBS, and MPST at mRNA and protein level in U937 cells with or without PMA treatment. Results were quantified by densitometric analysis for CTH, CBS, and MPST band intensities and normalized to GAPDH, using ImageJ software. (H, I) U1 and U937 cells were treated with 5 ng/ml PMA for 24 hr or left untreated, stained with AzMC for 30 min at 37°C, and images were acquired using Leica TCS SP5 confocal microscope (H). Scale bar represents 40 μm. Average fluorescence intensity was quantified by ImageJ software (I). Results are expressed as mean ± standard deviation and are representative of data from three independent experiments. *, p<0.05; **, p<0.01; ***, p<0.001, by two-way ANOVA with Tukey’s multiple comparison test.
Figure 1—figure supplement 1.
Figure 1—figure supplement 1.. HIV-1 reactivation decreases levels of H2S metabolizing enzymes in T cell line models of latency.
(A, B) J1.1 and Jurkat cells were stimulated with 5 ng/ml PMA for 6, 12, 24, and 36 hr and total cell lysates were prepared to analyze CTH, CBS, and MPST protein levels. HIV-1 reactivation was assessed by immunoblotting for intracellular viral protein, p24. The results are representative of data from three independent experiments. Results were quantified by densitometric analysis for CTH, CBS, and MPST band intensities and normalized to GAPDH. (C, D) J-Lat 10.6 cells were stimulated with 5 ng/ml PMA for indicated time and the levels of HIV-1 reactivation are represented as the percentage of GFP+ve cells by flow cytometry. (D) Time-dependent changes in the expression of CBS, CTH, and MPST at mRNA level during HIV-1 reactivation. Data generated using PMA-treated J-Lat cells were normalized to uninfected PMA-treated Jurkat cells. Results are expressed as mean ± standard deviation and are representative of data from three independent experiments. *, p<0.05; **, p<0.01; ***, p<0.001; ****, p<0.0001 by two-way ANOVA with Tukey’s multiple comparison test.
Figure 2.
Figure 2.. Genetic silencing of CTH reactivates HIV-1 and alters gene expression associated with redox stress, apoptosis, and mitochondrial function.
(A) Total RNA was isolated from shCTH E8, shCTH E9, and non-targeting shRNA (shNT) lentiviral vectors transduced U1 cells and change in CTH mRNA was examined by RT-qPCR. (B) Cell lysates of U1, shNT, and shCTH E8 were assessed for CTH abundance using immunoblotting. The CTH band intensities were quantified by densitometric analysis and normalized to GAPDH. (C) shCTH and shNT were treated with 5 ng/ml PMA or left untreated for 24 hr and HIV-1 reactivation was determined by gag RT-qPCR. (D, E) shCTH and shNT were treated with 5 ng/ml PMA or left untreated. At the indicated time points, HIV-1 reactivation was measured by flow-cytometry using fluorescent tagged (PE-labeled) antibody specific to intracellular p24 (Gag) antigen and p24 ELISA in the supernatant. Results are expressed as mean ± standard deviation and are representative of data from two independent experiments. *, p<0.05; **, p<0.01; ***, p<0.001, by two-way ANOVA with Tukey’s multiple comparison test. (F) Total RNA isolated from untreated or PMA (5 ng/ml; 24 hr)-treated U1-shNT and U1-shCTH were examined by NanoString Technology to assess the expression of genes associated with HIV-1 infection and oxidative stress response. Heatmap showing functional categories of significantly differentially expressed genes. Gene expression data obtained were normalized to internal control β2 microglobulin (B2M), and fold changes were calculated using the nSolver 4.0 software. Genes with fold changes values of >1.5 and p<0.05 were considered as significantly altered. RT-qPCR, reverse transcription quantitative PCR.
Figure 2—figure supplement 1.
Figure 2—figure supplement 1.. Genetic silencing of CTH reduces endogenous H2S levels and reactivates HIV-1 from latency.
(A, B) U1 cells stably transduced with non-targeting (shNT) and shCTH lentiviral vectors were stained with AzMC for 30 min at 37°C, and images were acquired using ZEISS LSM 880 confocal microscope (A). Scale bar represents 20 μm. Average fluorescence intensity was quantified by ImageJ software (B). (C) U1-shNT and U1-shCTH cells were cultured in complete RPMI medium and cysteine levels were assessed in cell lysates using cysteine assay kit (Sigma-Aldrich). (D) U1 cells were cultured in complete RPMI medium containing cysteine (+Cys) or cysteine-free RPMI (−Cys) for indicated time points. Total RNA was isolated and assessed for HIV-1 reactivation by gag RT-qPCR. (E) Total cell lysates were prepared from un-transduced (J1.1), non-targeting (shNT), shCBS, and shCTH knockdown J1.1 cells. Expression of CBS, CTH, MPST, and HIV-1 p24 levels was assessed by immunoblotting. (F) Total RNA was isolated from shCTH E8 and non-targeting shRNA (shNT) lentiviral vectors transduced J-Lat 10.6 cells and changes in CTH mRNA was examined by RT-qPCR. (G) HIV-1 reactivation upon CTH knockdown in J-Lat 10.6 cells is represented as percentage of GFP+ve cells by flow cytometry. (H, I) J-Lat 10.6 cells were pre-treated with indicated concentration of PAG or left untreated for 24 hr and then stimulated with 5 ng/ml PMA for 24 hr. HIV-1 reactivation is represented as the percentage of GFP+ve cells and cell viability was determined by Live/Dead fixable far red dead cell stain kit (Invitrogen). Results are expressed as mean ± standard deviation and are representative of data from two independent experiments. ***, p<0.001, ****, p<0.0001; ns, non-significant, by two-way ANOVA with Tukey’s multiple comparison test (panels D, H, and I) or two-tailed unpaired Student’s t-test (panels B, C, F, G). RT-qPCR, reverse transcription quantitative PCR.
Figure 3.
Figure 3.. CTH maintains redox homeostasis and mitochondrial bioenergetics to promote HIV-1 latency.
(A) Total and oxidized cellular glutathione (GSSG) content was assessed in U1-shCTH and U1-shNT cell lysates using glutathione assay kit. (B) U1-shNT and U1-shCTH were stained with MitoSOX Red dye for 30 min at 37°C and analyzed by flow cytometry (Ex-510 nm, Em-580 nm). (C) Schematic representation of Agilent Seahorse XF Cell Mito Stress test profile to assess key parameters related to mitochondrial respiration. (D) U1-shNT and U1-shCTH (5×10⁴) were seeded in triplicate wells of XF microplate and incubated for 1 hr at 37°C in a non-CO2 incubator. Oxygen consumption was measured without adding any drug (basal respiration), followed by measurement of OCR change upon sequential addition of 1 μM oligomycin (ATP synthase inhibitor) and 0.25 μM carbonyl cyanide 4-(trifluoromethoxy) phenylhydrazone (FCCP), which uncouples mitochondrial respiration and maximizes OCR. Finally, rotenone (0.5 μM) and antimycin A (0.5 μM) were injected to completely inhibit respiration by blocking complex I and complex III, respectively. (E) Various respiratory parameters derived from OCR measurement were determined by Wave desktop software. nmOCR; non-mitochondrial oxygen consumption rate and SRC; spare respiratory capacity. Error bar represents standard deviations from mean. Results are representative of data from three independent experiments. *, p<0.05; **, p<0.01; ***, p<0.001; ns, non-significant, by two-way ANOVA with Bonferroni’s multiple comparison test.
Figure 3—figure supplement 1.
Figure 3—figure supplement 1.. Effect of CTH knockdown on cytosolic ROS generation.
(A) U1-shNT and U1- shCTH cells were left untreated or treated with 5 ng/ml PMA for 6 hr, stained with CM-H2DCFDA dye (5 μM) analyzed using flow cytometry. Results are expressed as mean ± standard deviation and data are representative of two independent experiments. ns, nonsignificant, by two-way ANOVA with Tukey’s multiple comparison test. ROS, reactive oxygen species.
Figure 4.
Figure 4.. H2S donor (GYY4137) suppresses HIV-1 reactivation and replication.
(A) U1 cells were treated with NaHS or GYY4137 and media supernatant was harvested to assess H2S production by methylene blue assay over time. (B, C) U1 cells were pre-treated with 5 mM GYY4137 or 5 mM NAC for 24 hr and then stimulated with 5 ng/ml PMA for 24 and 48 hr. Total RNA was isolated and HIV-1 reactivation was assessed by gag RT-qPCR (B). Culture supernatant was harvested to monitor HIV-1 release by p24 ELISA (C). (D) U1 cells were pretreated with 5 mM GYY417, 5 mM NAC for 24 hr or left untreated and then stimulated with 100 ng/ml TNF-ɑ for 24 and 48 hr. HIV-1 reactivation was assessed by gag RT-qPCR. (E) U1-shCTH and U1-shNT were pretreated with 5 mM GYY4137 for 24 hr and stimulated with 5 ng/ml PMA for 24 hr. Culture supernatant was harvested to determine HIV-1 reactivation by HIV-1 p24 ELISA. (F) J1.1 cells were pretreated with indicated concentrations of GYY4137 or 5 mM NAC for 24 hr and then stimulated with 5 ng/ml PMA for 12 hr. Cells were harvested to isolate total RNA and HIV-1 reactivation was assessed by gag RT-qPCR. (G) Primary human CD4+ T cells purified from PBMCs samples of healthy donors were activated with anti-CD3/anti-CD28 beads for 3 days. Activated primary CD4+ T cells (three healthy donors) were pre-treated with 800 μM GYY4137 for 6 hr, and infected with HIV-NL4.3 (1 ng p24/106 cells). Post-infection (p.i.) cells were washed, seeded in fresh media, and treated with 800 μM GYY4137 or left untreated. Virus released in the supernatant was quantified by p24 ELISA at 3rd and 5th day post-infection. Results are expressed as ± standard deviation and data are representative of three independent experiments. *, p<0.05; **, p<0.01; ***, p<0.001, ns, non-significant by two-way ANOVA with Tukey’s multiple comparison test. PBMC, peripheral blood mononuclear cell; RT-qPCR, reverse transcription quantitative PCR.
Figure 4—figure supplement 1.
Figure 4—figure supplement 1.. Effect of GYY4137 on HIV-1 reactivation and cellular viability.
(A) U1 cells were pretreated with 5 mM GYY4137 or 5 mM NAC for 24 hr and then stimulated with 5 ng/ml PMA for 24 or 48 hr. Cells were stained with 3 μM propidium iodide (PI) for 15 min in dark, washed, and analyzed using flow cytometry. (B) Decomposed GYY4137 (spent GYY4137) which was aerated for at least 180 days at left at room temperature was used to pretreat U1 cells. Cells pretreated with 5 mM spent GYY4137 for 24 hr or left untreated were stimulated with 5 ng/ml PMA for 24 hr and HIV-1 reactivation was assessed by gag RT-qPCR. (C) J1.1 cells were pretreated with GYY4137 for 24 hr and then stimulated with PMA for 12 hr. Cells were then harvested, stained with PI, and subjected to flow cytometry to assess viability. (D) J-Lat cells were pretreated with 5 mM NAC or indicated concentrations of GYY4137 for 24 hr and then stimulated with 2.5 μM prostratin for 24 hr. HIV-1 reactivation was determined by estimating GFP expressing cells using flow cytometry. (E) Primary human CD4+ T cells purified from PBMCs samples of healthy donors were activated with CD3/CD28 for 3 days. Post-activation CD4+ T cells were treated with indicated concentration of GYY4137. Cell viability was determined at 3rd day post-treatment using Live/Dead fixable far red dead cell stain kit (Invitrogen) by flow cytometry. Error bar represents standard deviations from mean. Results are representative of data from two independent experiments. *, p<0.05; **, p<0.01; ***, p<0.001; ****, p<0.0001; ns, nonsignificant, by two-way ANOVA with Tukey’s multiple comparison test. PBMC, peripheral blood mononuclear cell; RT-qPCR, reverse transcription quantitative PCR.
Figure 5.
Figure 5.. GYY4137 modulates Nrf2, NF-κB, and YY1 pathways.
(A) U1 cells pre-treated with 5 mM GYY4137 for 24 hr or left untreated and then stimulated with 5 ng/ml PMA for 24 hr or left unstimulated. Total RNA was isolated and expression of genes associated with HIV-1 infection and oxidative stress response was assessed by nCounter NanoString Technology. Heatmap showing functional categories of significant DEGs in all four conditions: untreated (U1), GYY4137 alone (U1-GYY) or PMA- alone (U1-PMA), and GYY4137+PMA (U1-GYY+PMA). Gene expression data obtained were normalized to internal control β2 microglobulin (B2M), and fold changes were calculated using the nSolver 4.0 software. Genes with fold changes values of >1.5 and p<0.05 were considered as significantly altered. (B) Total cell lysates were used to analyze the expression levels of Nrf2 and HMOX1 by immunoblotting. Results were quantified by densitometric analysis of Nrf2 and HMOX1 band intensities and normalized to GAPDH. (C) U1 cells were pretreated with 5 mM GYY4137 for 6 hr and then stimulated with 30 ng/ml PMA for 4 hr or left unstimulated. Cells were harvested to prepare total cell lysate. Levels of phosphorylated NF-κB p65 (Ser536), NF-κB p65, and YY1 were determined by immunoblotting. Results were quantified by densitometric analysis for each blot and were normalized to GAPDH. (D) Schematic depiction of the binding sites for NF-κB (p65-p50 heterodimer) and YY1 on HIV-1 5´-LTR. Highlighted arrow in red indicates the regions targeted for genomic qPCR; ER site for NF-κB, and RBEI and RBEIII sites for YY1 enrichments, respectively. (E, F) U1 cells were pretreated with 5 mM GYY4137 for 6 hr, stimulated with PMA (30 ng/ml) for 4 hr, fixed with formaldehyde, and lysed. Lysates were subjected to immunoprecipitation for p65 and YY1 and protein-DNA complexes were purified using protein-G magnetic beads. The enrichment of NF-κB p65 and YY1 on HIV-1 LTR was assessed by qPCR for designated regions using purified DNA as a template. Results are expressed as mean ± standard deviation and data are representative of three independent experiments *, p<0.05; **, p<0.01; ***, p<0.001; ****, p<0.0001; ns, non-significant, by two-way ANOVA with Tukey’s multiple comparison test. DEG, differentially expressed gene.
Figure 6.
Figure 6.. GYY4137 subverts HIV-1 reactivation in latent CD4+ T cells derived from HIV-1 infected patients.
(A) Schematic representation of the experimental design to study the effect of H2S on HIV-1 reactivation using CD4+ T cells from ART-treated HIV-1 infected subjects. CD4+ T cells were sorted and activated with PHA (1 μg/ml), IL-2 (100 U/ml), feeder PBMCs (gamma-irradiated) from healthy donors. CD4+ T cells were activated in the presence of ART or ART in combination with 100 μM GYY4137. Post-activation cells were cultured with ART alone or ART +GYY4137 treatment in IL-2 containing medium. (B) Total RNA was isolated from five patients CD4+ T cells expanded in ART or ART+GYY4137. HIV-1 RNA levels were measured every 7 days by ultrasensitive semi-nested RT-qPCR with detection limit of three viral RNA copies per million cells. (C) On day 28, cells were washed of any treatment and both ART or ART+GYY4137 treatment groups were stimulated with 1 μM prostratin for 24 hr. HIV-1 RNA copies were assessed by RT-qPCR. Reduction in viral stimulation in GYY4137 treated samples is represented as percentage values. ND, non-determined. (D) Aggregate plot for five patients from data shown in (C). (E, F) Primary CD4+ T cells expanded and cultured in the presence of ART or ART+GYY4137 were analyzed over time for the expression of activation (CD38) and quiescence markers (CD127) by flow cytometry. (G) Total HIV-1 DNA content was determined up to 28 days in ART or ART+GYY4137 treated groups. Results are expressed as mean ± standard deviation. **, p<0.01; ns, non-significant, by two-way ANOVA with Tukey’s multiple comparison test. RT-qPCR, reverse transcription quantitative PCR.
Figure 6—figure supplement 1.
Figure 6—figure supplement 1.. Phenotypic features of CD4+ T cells were preserved upon prolonged treatment with GYY4137.
(A) Flow cytometry-gating strategy used to analyze the expression of activation (CD38), quiescence (CD127), and frequency of different memory subsets of CD4+ T cells. The figure represents expression of different markers at day 7 post-activation of CD4+ T cells from a single patient sample. (B–E) Primary human CD4+ T cells from HIV-1 infected patients cultured with ART or ART with GYY4137 were analyzed by flow cytometry over time to determine frequency of different subsets of CD4+ T cells- TN (naive [B]) and TCM (central memory [C]), TTM (transition memory [D]), TEM (effector memory [E]). (F) Cell viability was assessed by Live-Dead staining over time. Results obtained suggest no difference in viability between ART alone and ART with GYY4137 treated group over time. Error bar represents standard deviations from mean. Results are representative of data from four patients’ samples.
Figure 6—figure supplement 2.
Figure 6—figure supplement 2.. Lack of HIV-1 reactivation in CD4+ T cells cultured in the presence of GYY4137 is not due to impaired T cell activation.
(A–D) PHA/IL-2 expanded CD4+ T cell lines cultured for 14 days in the presence of ART or ART in combination with 100 μM GYY4137 were labeled with 0.5 μM cell trace violet (CTV) and stimulated with either CMV, anti-CD3/anti-CD28 beads (at a bead:cell ratio of 0.25:1), or SEB (100 ng/ml). After 3 days, IL-2 (20 U/ml) supplemented medium was added to the cells and cultured for another 2 days. Proliferation was measured by CTV dilution and CD25 expression was analyzed by flow cytometry after 5 days of culture. (A) Representative histogram plots of CTV dilution are shown. (B) Frequencies of antigen-specific proliferating cells (CTVlow) in 14-day cell lines cultured in ART alone or in combination with GYY4137. (C) Representative histogram plots of CD25 expression are shown. (D) Frequencies of antigen-specific CD25+ cells in 14-day cell lines cultured in ART alone or in combination with GYY4137. (E–J) PBMCs from HIV positive ART-treated patients were incubated with ART or ART in combination with 100 μM GYY4137 and left unstimulated or stimulated with either CMV or anti-CD3/anti-CD28 beads (at a bead:cell ratio of 0.25:1) for 18 hr. Cells were analyzed for surface expression of CD25 and CD69 and intracellular staining of IFNγ by flow cytometry. Bar graphs depict the frequencies of IFNγ+, CD25+, and CD69+ CD4+ (E–G) and CD8+ T cells (H–J) cultured in ART alone (orange) or ART in the presence of GYY4137 (blue). Data were plotted after background subtraction and presented as the means ± SEM. p-value between paired samples was determined by Wilcoxon matched-pairs signed-rank test.
Figure 6—figure supplement 3.
Figure 6—figure supplement 3.. Flow cytometry gating strategy for ex vivo stimulation of PBMCs derived from ART-treated HIV-1 patients cultured in the presence of GYY4137 in combination with ART or ART alone.
(A) Representative gating strategy of PBMCs from HIV positive ART-treated patients stimulated ex vivo with CD3/CD28 beads and cultured in the presence of ART or ART in combination with GYY4137. (B) Representative FACS plots of CD4+ and CD8+ T cells expressing IFNγ are shown. PBMC, peripheral blood mononuclear cell.
Figure 7.
Figure 7.. Effect of H2S on mitochondrial respiration and ROS generation in latent CD4+ T cells derived from HIV-1 patients.
(A) Primary human CD4+ T cells from HIV-1 infected subjects were activated and cultured ex vivo with ART or ART+GYY4137. On day 28, cells from ART or ART+GYY4137 treatment groups were harvested to assess mitochondrial respiration by using Seahorse XF mito-stress test as described in Materials and methods. (B) Cells from ART and ART+GYY4137 treated groups were stimulated with 1 μM prostratin 6 hr. Post-stimulation mitochondrial respiration profile was determined by Seahorse XF mito-stress test. (C) Various mitochondrial respiratory parameters derived from OCR measurement were determined by Wave desktop software. nmOCR; non-mitochondrial oxygen consumption rate and SRC; spare respiratory capacity. (D) On day 28, cells from both ART and ART+GYY4137 treatment groups were stimulated with 1 μM Prostratin for 6 hr. Cells were harvested and stained with 5 μM MitoSOX-Red dye for 30 min followed by washing. Samples were analyzed by flow cytometry. Unstimulated (Uns)- cells cultured under ART alone. (E) Both ART and ART+GYY4137 treated cells at day 14 post-activation were stimulated with 1 μg/ml PMA and 100 μg/ml ionomycin (Iono) for 6 h. Cells were harvested post-stimulation and stained with 5 μM MitoSOX-Red dye. Samples were analyzed by flow cytometry to assess mitoROS generation. Unstimulated (Uns)- cells cultured under ART alone. (F) CD4+ T cells from ART and ART+GYY4137 treated groups were stimulated with 1 μM prostratin on 28th day for 24 hr or left unstimulated. Cells were harvested to isolate total RNA and expression of hmox1, txnrd1, gclc, and prdx1 were determined by RT-qPCR. Data obtained were normalized to internal control β2 microglobulin (B2M). Error bar represents standard deviations from mean. Results are representative of data from three patient samples. *, p<0.05; **, p<0.01, by two-way ANOVA with Tukey’s multiple comparison test. RT-qPCR, reverse transcription quantitative PCR.

Similar articles

Cited by

References

    1. Alzahrani J, Hussain T, Simar D, Palchaudhuri R, Abdel-Mohsen M, Crowe SM, Mbogo GW, Palmer CS. Inflammatory and immunometabolic consequences of gut dysfunction in HIV: Parallels with IBD and implications for reservoir persistence and non-AIDS comorbidities. EBioMedicine. 2019;46:522–531. doi: 10.1016/j.ebiom.2019.07.027. - DOI - PMC - PubMed
    1. Amini S, Clavo A, Nadraga Y, Giordano A, Khalili K, Sawaya BE. Interplay between cdk9 and NF-kappaB factors determines the level of HIV-1 gene transcription in astrocytic cells. Oncogene. 2002;21:5797–5803. doi: 10.1038/sj.onc.1205754. - DOI - PubMed
    1. Badley AD, Roumier T, Lum JJ, Kroemer G. Mitochondrion-mediated apoptosis in HIV-1 infection. Trends in Pharmacological Sciences. 2003;24:298–305. doi: 10.1016/S0165-6147(03)00125-1. - DOI - PubMed
    1. Banerjee R. Hydrogen sulfide: redox metabolism and signaling. Antioxidants & Redox Signaling. 2011;15:339–341. doi: 10.1089/ars.2011.3912. - DOI - PMC - PubMed
    1. Beauchamp RO, Bus JS, Popp JA, Boreiko CJ, Andjelkovich DA, Philip L. A critical review of the literature on hydrogen sulfide toxicity. Critical Reviews in Toxicology. 1984;13:25–97. doi: 10.3109/10408448409029321. - DOI - PubMed

Publication types