. 2022 Apr;6(4):821-840.
doi: 10.1002/hep4.1854. Epub 2021 Nov 18.

Single-Cell, Single-Nucleus, and Spatial RNA Sequencing of the Human Liver Identifies Cholangiocyte and Mesenchymal Heterogeneity

Affiliations

Single-Cell, Single-Nucleus, and Spatial RNA Sequencing of the Human Liver Identifies Cholangiocyte and Mesenchymal Heterogeneity

Tallulah S Andrews et al. Hepatol Commun. 2022 Apr.

Abstract

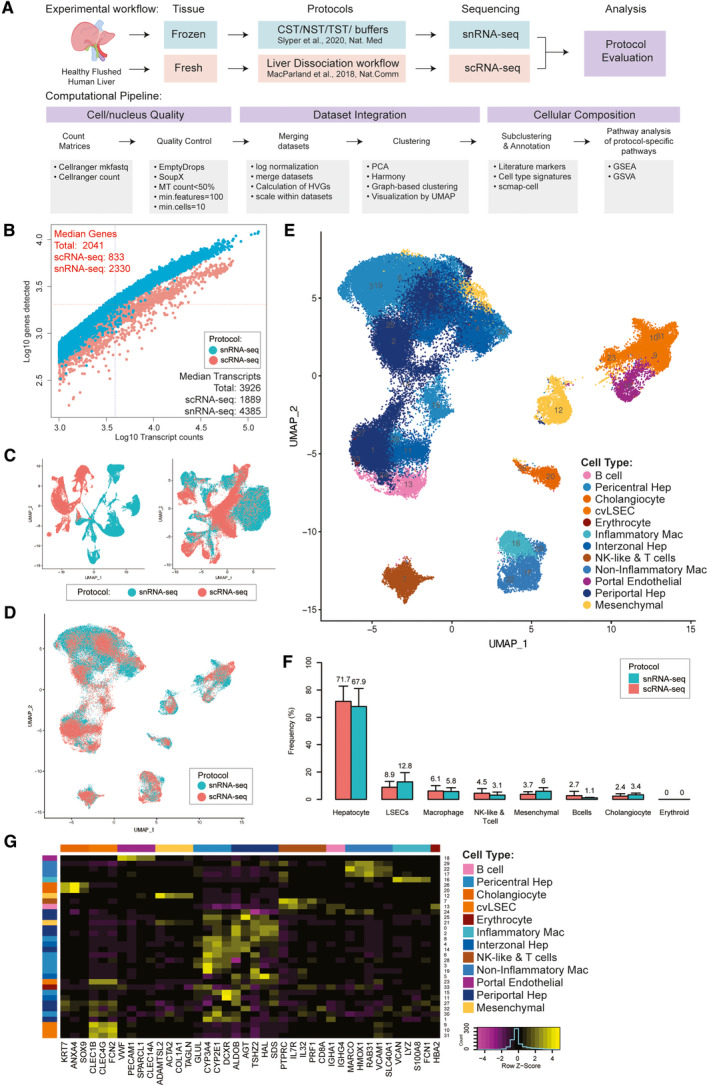
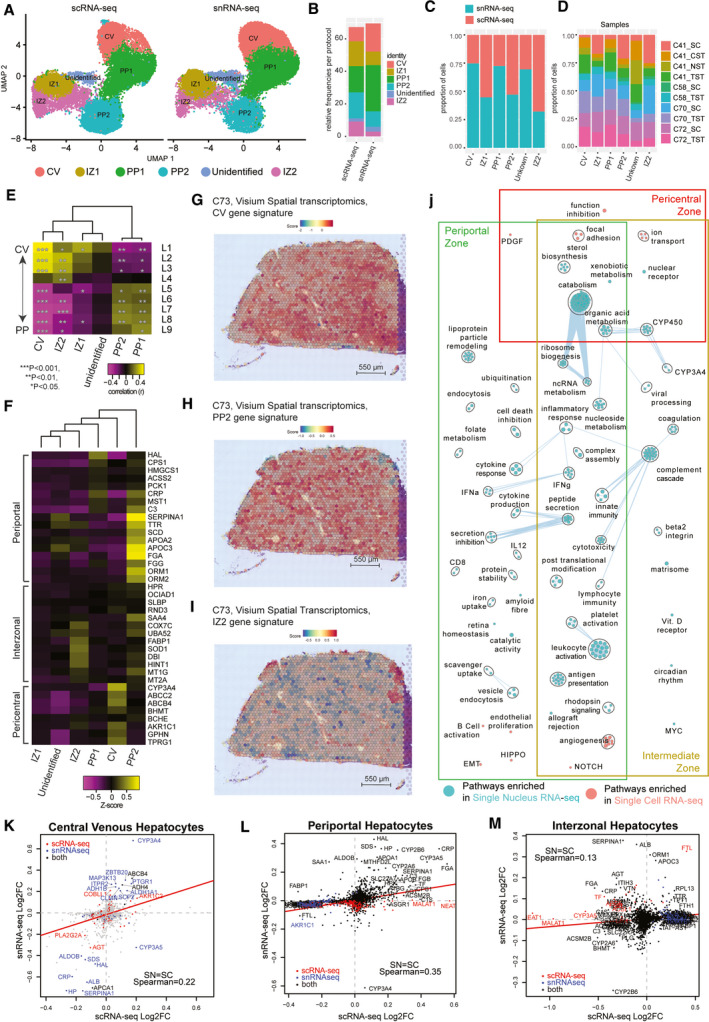
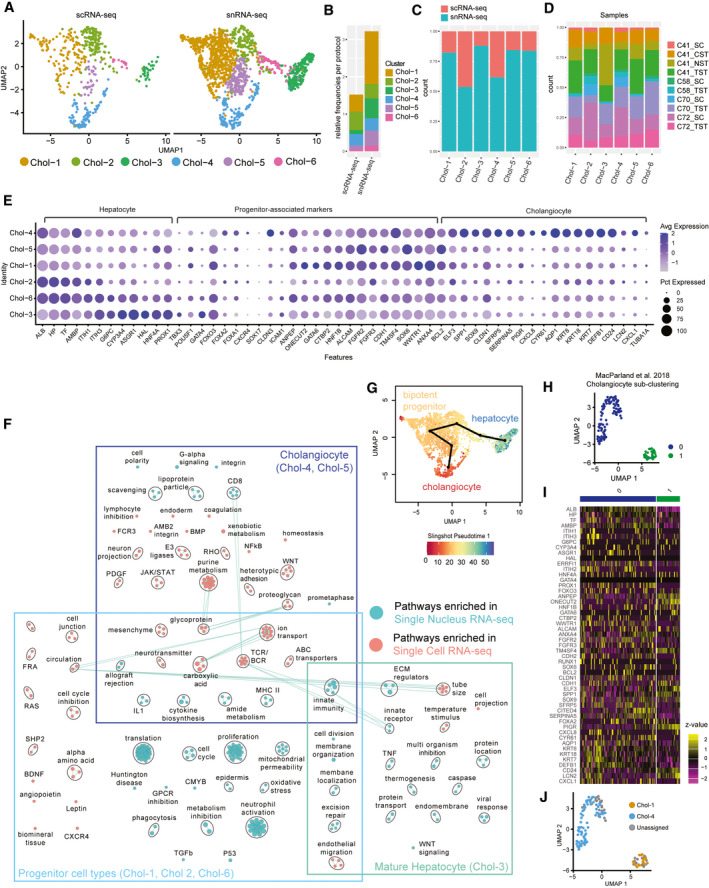
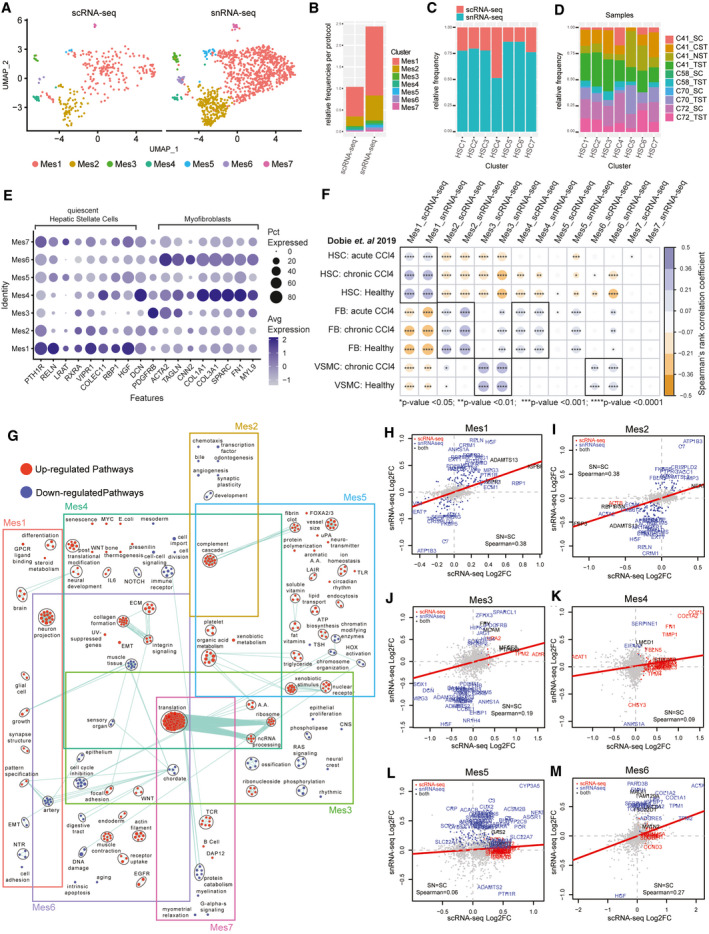
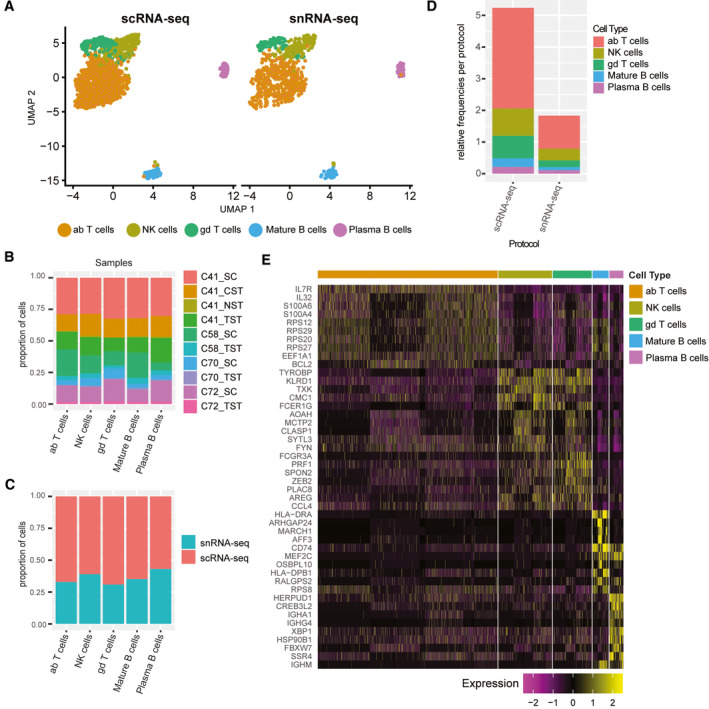
The critical functions of the human liver are coordinated through the interactions of hepatic parenchymal and non-parenchymal cells. Recent advances in single-cell transcriptional approaches have enabled an examination of the human liver with unprecedented resolution. However, dissociation-related cell perturbation can limit the ability to fully capture the human liver's parenchymal cell fraction, which limits the ability to comprehensively profile this organ. Here, we report the transcriptional landscape of 73,295 cells from the human liver using matched single-cell RNA sequencing (scRNA-seq) and single-nucleus RNA sequencing (snRNA-seq). The addition of snRNA-seq enabled the characterization of interzonal hepatocytes at a single-cell resolution, revealed the presence of rare subtypes of liver mesenchymal cells, and facilitated the detection of cholangiocyte progenitors that had only been observed during in vitro differentiation experiments. However, T and B lymphocytes and natural killer cells were only distinguishable using scRNA-seq, highlighting the importance of applying both technologies to obtain a complete map of tissue-resident cell types. We validated the distinct spatial distribution of the hepatocyte, cholangiocyte, and mesenchymal cell populations by an independent spatial transcriptomics data set and immunohistochemistry. Conclusion: Our study provides a systematic comparison of the transcriptomes captured by scRNA-seq and snRNA-seq and delivers a high-resolution map of the parenchymal cell populations in the healthy human liver.


Figures

FIG. 1
FIG. 1
Technical differences between scRNA‐seq and snRNA‐seq in profiling cells from the healthy human liver. (A) Overview of single‐cell and single‐nucleus isolation, data set integration, and analysis workflows. (B) Sensitivity of each approach as measured by the number of genes and transcripts identified in each cell/nucleus. (C) UMAP projection of cells derived from scRNA‐seq and snRNA‐seq merged (i) and then scaled individually before merging (ii). (D) UMAP projection of cells from scRNA‐seq (pink) and snRNA‐seq (blue) individually scaled before merging and then integrated using harmony. (E) UMAP plot showing the assigned identity for each cluster after scaling individually, merging and integrating. (F) Frequency of each major cell population in their source data set; error bars indicate 95% confidence intervals across samples. (G) Heatmap showing scaled mean expression of known marker genes in each cluster. Abbreviations: cvLSECS, central venous LSECs; GSVA, gene‐set variation analysis; MT, proportion of RNA content derived from the mitochondiral genome; PCA, Principal Component Analysis; and UMAP, Uniform Manifold Approximation and Projection.
FIG. 2
FIG. 2
Hepatocyte populations in sample‐matched scRNA‐seq and snRNA‐seq data are spatially resolved by spatial transcriptomics. (A) UMAP plot with the six major populations of hepatocytes split by protocol. (B) Stacked bar plot indicating the frequency of each population in either scRNA‐seq or snRNA‐seq data sets. Distribution of hepatocytes by protocol (C) or by donor sample (D) in the combined data set. (E) Correlation of human hepatocyte clusters to known mouse liver sinusoid layers calculated using Spearman correlation. ***P < 0.001, ** P < 0.01, *P < 0.05. (F) Expression of known marker genes in hepatocyte subpopulations in the combined data set. Gene signature scores of the top 30 marker genes in clusters CV (G), PP2 (H), and IZ2 (I) across the spatial transcriptomics spots of a healthy human liver cryosection. (J) Pathway enrichment analysis examining which cellular pathways are better represented by snRNA‐seq (cyan) and scRNA‐seq (pink) in the central venous, periportal, and interzonal hepatocyte populations. Circles (nodes) represent pathways, sized by the number of genes included in that pathway. Related pathways, indicated by light blue lines, are grouped into a theme (black circle) and labeled. Intra‐pathway and inter‐pathway relationships are shown in light blue and represent the number of genes shared between each pathway. Log2FC of significant genes (q‐value < 0.05) within either scRNA‐seq (red) or snRNA‐seq (blue) or both (black) for CV hepatocytes (K) (cluster CV), PP clusters (L) (clusters PP1 and PP2), and IZ clusters (M) (clusters IZ1 and IZ2). Abbreviations: IZ, interzonal; and PP, periportal.
FIG. 3
FIG. 3
Cholangiocyte‐associated cells as revealed by snRNA‐seq. (A) UMAP plot with the six major populations of cholangiocytes and progenitor cells identified in the combined data set split by protocol. (B) Frequency of each population in either scRNA‐seq or snRNA‐seq data sets. Distribution of each population by protocol (C) and by sample (D) in the combined data set. (E) Expression of known cholangiocyte, progenitor, and hepatocyte marker genes in each population. The size of the circle indicates the percentage of cells in each population expressing each gene. (F) Pairwise pathway analysis comparing cholangiocyte‐like, progenitor‐like, and mature hepatocyte‐like cells from snRNA‐seq (cyan) to those from scRNA‐seq (pink). Circles (nodes) represent pathways, sized by the number of genes included in that pathway. Related pathways, indicated by light blue lines, are grouped into a theme (black circle) and labeled. Due to low cell number, similar clusters were combined for pathway analysis (see Supporting Fig. S15) for more details. (G) Color value in UMAP plot indicates distance along the cholangiocyte to bipotent progenitor cells to hepatocyte pseudo‐time trajectory as inferred by Slingshot.( 18 ) (H) UMAP of subclustered cholangiocyte‐like populations from an independent scRNA‐seq healthy human liver data set.( 2 ) (I) Heatmap depicting the relative expression of cholangiocyte subpopulation‐associated marker genes in cholangiocyte‐like cells.( 2 ) (J) Projection of cell‐type annotations from the combined scRNA‐seq and snRNA‐seq cholangiocyte data set onto scRNA‐seq data from MacParland et al.( 2 ) using scmap‐cell.( 23 )
FIG. 4
FIG. 4
Identification of HSCs, FBs, and VSMCs in the healthy human liver through scRNA‐seq and snRNA‐seq. (A) UMAP plots with the seven major clusters of mesenchymal cells in the combined data set, split by protocol. (B) Stacked bar plot indicating the frequency of each population in either scRNA‐seq or snRNA‐seq data sets. Distribution of each population by protocol (C) and by sample (D) in the combined data set. (E) Dot plot indicating the relative expression of known quiescent HSCs and myofibroblast‐specific marker genes in each population. The size of the circle indicates the percentage of cells in each cluster expressing each gene. (F) Spearman correlation of transcriptional gene signatures from mouse HSCs, FBs and VSMCs, sourced from healthy and carbon tetrachloride–induced acute and chronically fibrotic livers (Dobie et al. 2019) to the human mesenchymal cells clusters from this study.( 29 ) ****P < 0.0001, ***P < 0.001, **P < 0.01, *P < 0.05. (G) Pathway enrichment analysis examining what are the up‐regulated (red) and down‐regulated (cyan) biological pathways in each mesenchymal cell cluster in the combined scRNA‐seq and snRNA‐seq data set. Circles (nodes) represent pathways, sized by the number of genes included in that pathway. Related pathways, indicated by light blue lines, are grouped into a theme (black circle) and labeled. (H)‐(M) Log2FC of significant genes (q‐value < 0.05) within either scRNA‐seq (red) or snRNA‐seq (blue) or both (black) for each cluster within the mesenchymal cell data set.
FIG. 5
FIG. 5
Analysis of LSECs in the combined scRNA‐seq and snRNA‐seq data set. (a) UMAP plots with the three major endothelial cell populations in the combined data set split by protocol. (B) Frequency of each population in either scRNA‐seq or snRNA‐seq data sets. Distribution of each population by protocol (C) and by sample (D) in the combined data set. (E) Dot plot indicating the relative expression of known LSEC marker genes in each population by protocol. The size of the circle indicates the percentage of cells in each population expressing each gene. (F) Pathway enrichment analysis examining which cellular pathways are better represented by snRNA‐seq (cyan) and scRNA‐seq (pink) in each of the LSEC subpopulations. Circles (nodes) represent pathways, sized by the number of genes included in that pathway. Related pathways, indicated by light blue lines, are grouped into a theme (black circle) and labeled. (G),(I) Log2FC of significant genes (q‐value < 0.05) within either scRNA‐seq (red) or snRNA‐seq (blue) or both (black) for each cluster within the LSEC data set.
FIG. 6
FIG. 6
Analysis of liver‐resident macrophages in the combined scRNA‐seq and snRNA‐seq data set. (A) UMAP plots depicting the clustering of inflammatory and non‐inflammatory macrophages in the combined data set split by protocol. (B) Stacked bar plot indicating the frequency of each population in either scRNA‐seq or snRNA‐seq data sets. Distribution of each population by protocol (C) and by sample (D) in the combined data set. (E) Dot plot indicating the relative expression of known inflammatory and non‐inflammatory macrophage marker genes in each cluster by protocol. The size of the circle indicates the percentage of cells in each population expressing each gene. (F) Log2FC of significant genes (5% false discovery rate) within either scRNA‐seq (red) or snRNA‐seq (blue) or both (black) for each cluster within the macrophage populations; nonsignificant shown in gray. (G) Pairwise pathway enrichment analysis comparing snRNA‐seq to scRNA‐seq in each macrophage subpopulation. Pathways enriched in snRNA‐sq are labeled in cyan, and pathways enriched in scRNA‐seq are indicated in pink. Circles (nodes) represent pathways, sized by the number of genes included in that pathway. Related pathways, indicated by light blue lines, are grouped into a theme (black circle) and labeled. Abbreviation: Macs, macrophages.
FIG. 7
FIG. 7
Liver‐resident lymphocytes are enriched in scRNA‐seq data sets. (A) UMAP plots depicting the clustering of various lymphocyte subpopulations in the combined data set split by protocol. (B) Frequency of each population in either scRNA‐seq or snRNA‐seq data sets. Distribution of each population by protocol (C) and by sample (D) in the combined data set. (E) Heat map showing the most significantly up‐regulated genes per cluster. Abbreviations: ab, alpha‐beta; and gd, gamma‐delta.

Similar articles

Cited by

References

    1. Segal JM, Kent D, Wesche DJ, Ng SS, Serra M, Oulès B, et al. Single cell analysis of human foetal liver captures the transcriptional profile of hepatobiliary hybrid progenitors. Nat Commun 2019;10:3350. - PMC - PubMed
    1. MacParland SA, Liu JC, Ma X‐Z, Innes BT, Bartczak AM, Gage BK, et al. Single cell RNA sequencing of human liver reveals distinct intrahepatic macrophage populations. Nat Commun 2018;9:4383. - PMC - PubMed
    1. Aizarani N, Saviano A, Sagar, Mailly L, Durand S, Herman JS, et al. A human liver cell atlas reveals heterogeneity and epithelial progenitors. Nature 2019;572:199‐204. - PMC - PubMed
    1. Ramachandran P, Dobie R, Wilson‐Kanamori JR, Dora EF, Henderson BEP, Luu NT, et al. Resolving the fibrotic niche of human liver cirrhosis at single‐cell level. Nature 2019;575:512‐518. - PMC - PubMed
    1. Massalha H, Bahar Halpern K, Abu‐Gazala S, Jana T, Massasa EE, Moor AE, et al. A single cell atlas of the human liver tumor microenvironment. Mol Syst Biol 2020;16:e9682. - PMC - PubMed

Publication types