. 2021 Dec 31:10:e71900.
doi: 10.7554/eLife.71900.

Pan-genome analysis identifies intersecting roles for Pseudomonas specialized metabolites in potato pathogen inhibition

Affiliations

Pan-genome analysis identifies intersecting roles for Pseudomonas specialized metabolites in potato pathogen inhibition

Alba Pacheco-Moreno et al. Elife. .

Abstract

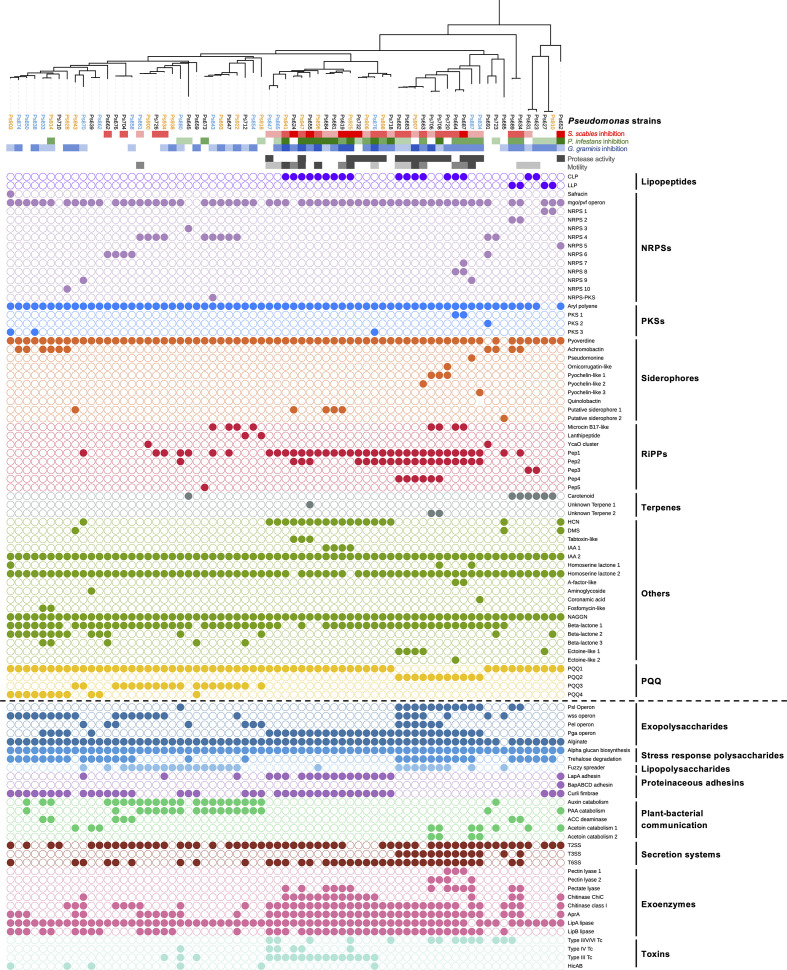
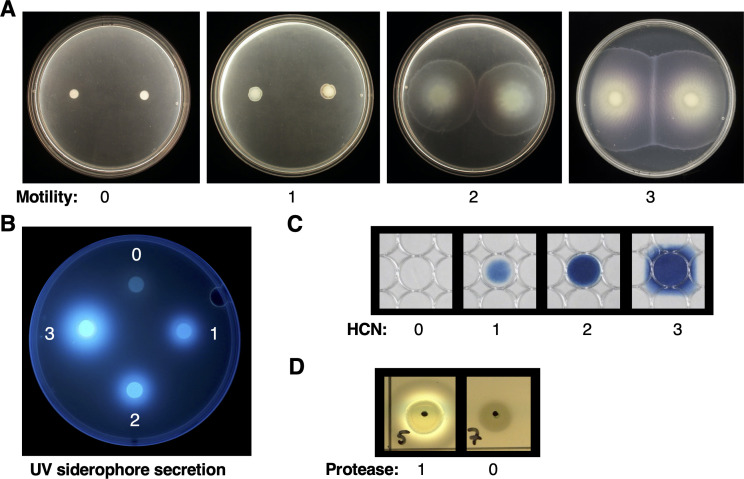
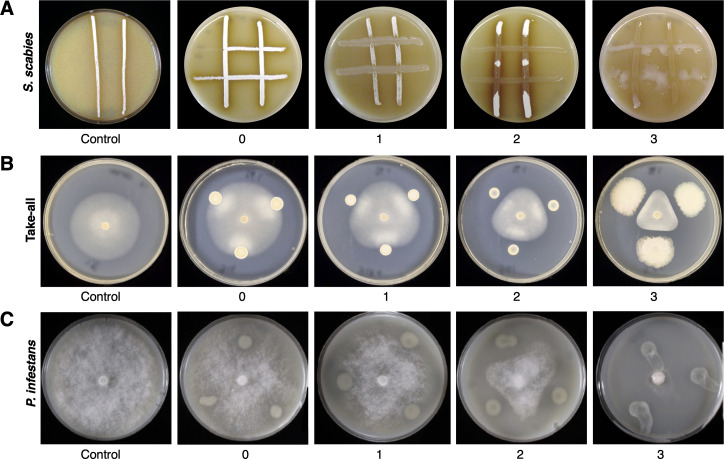
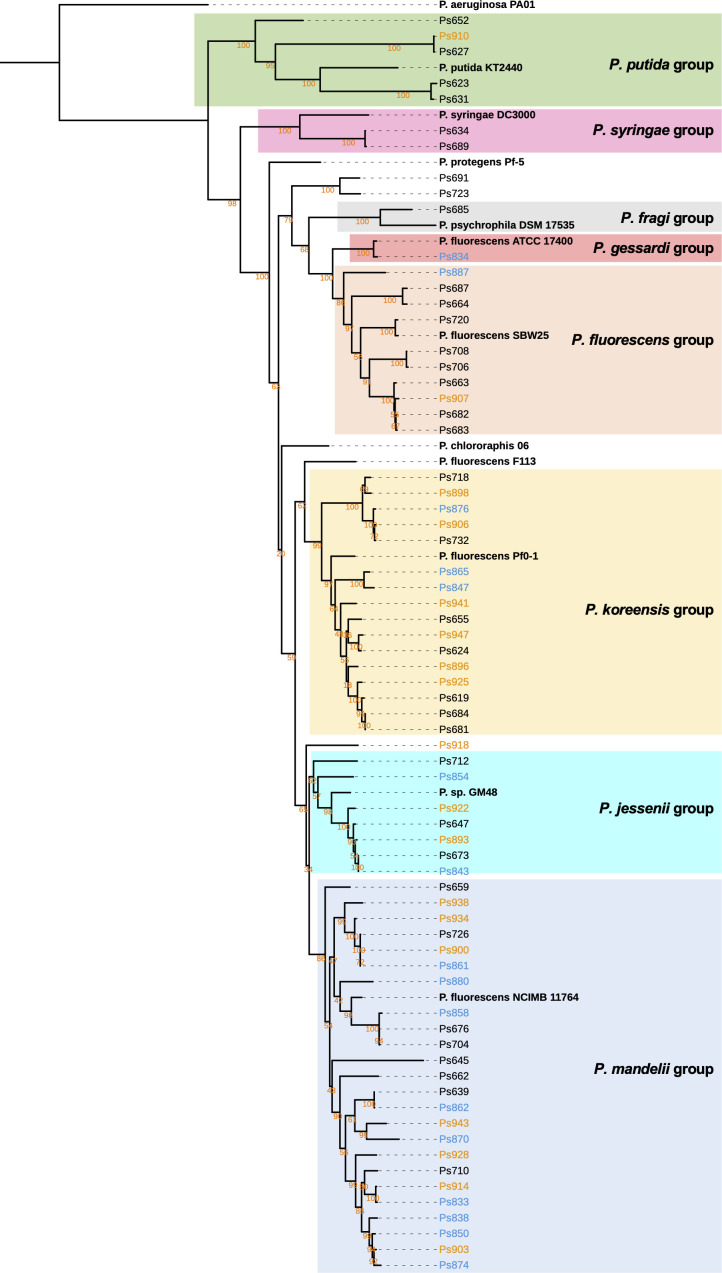
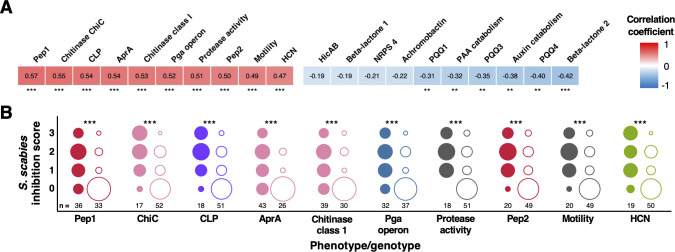
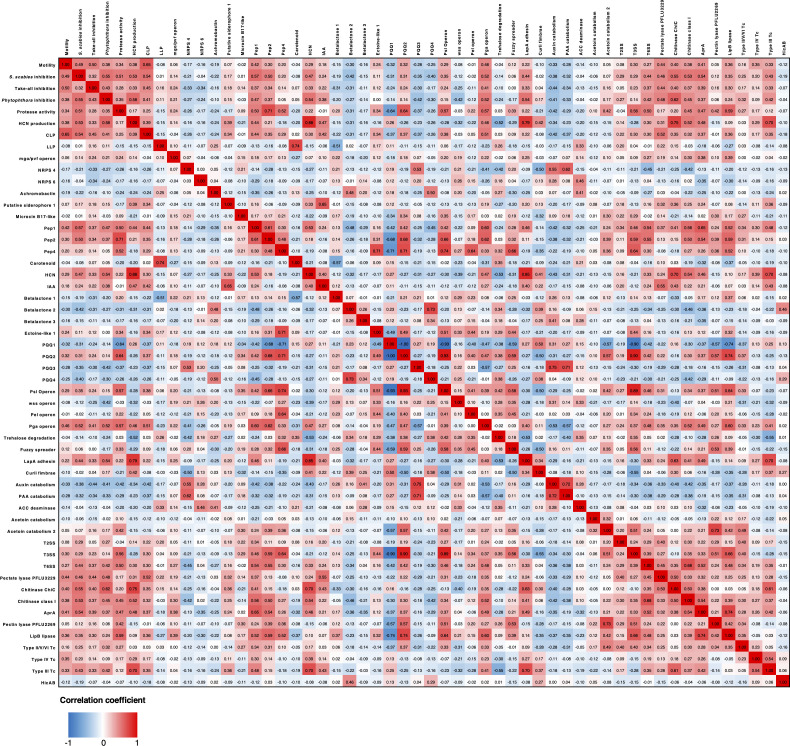
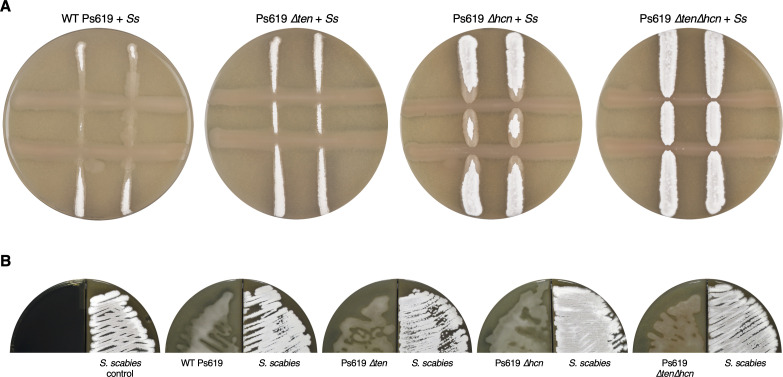
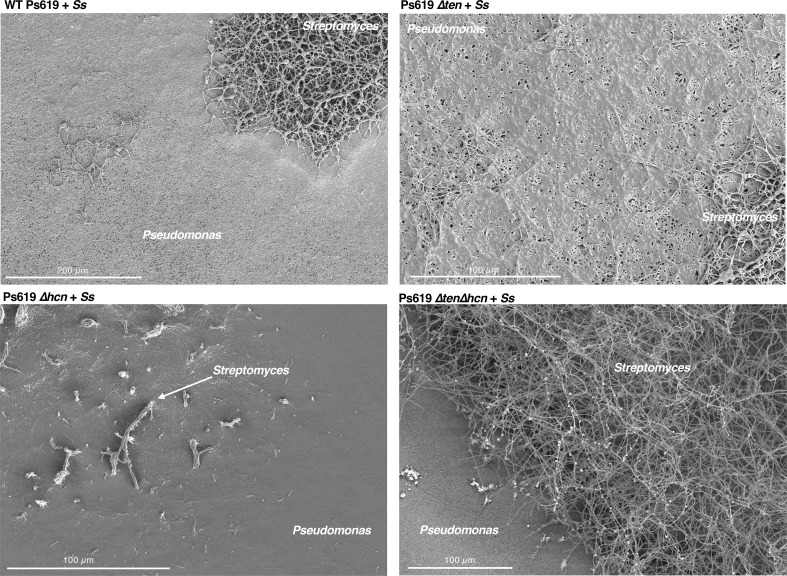
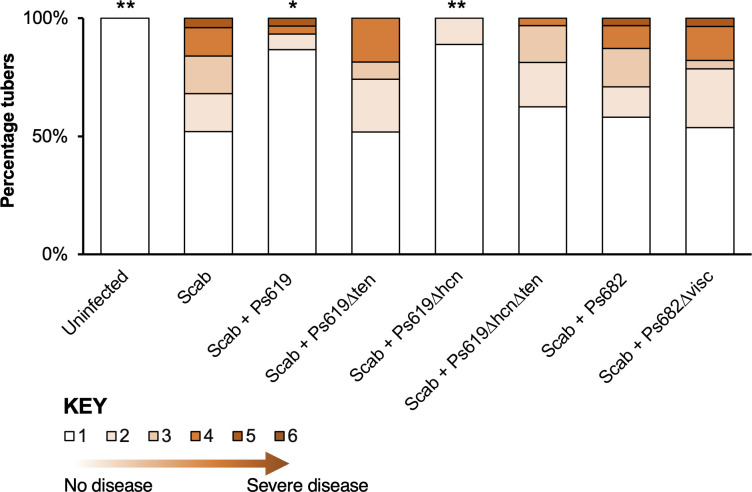
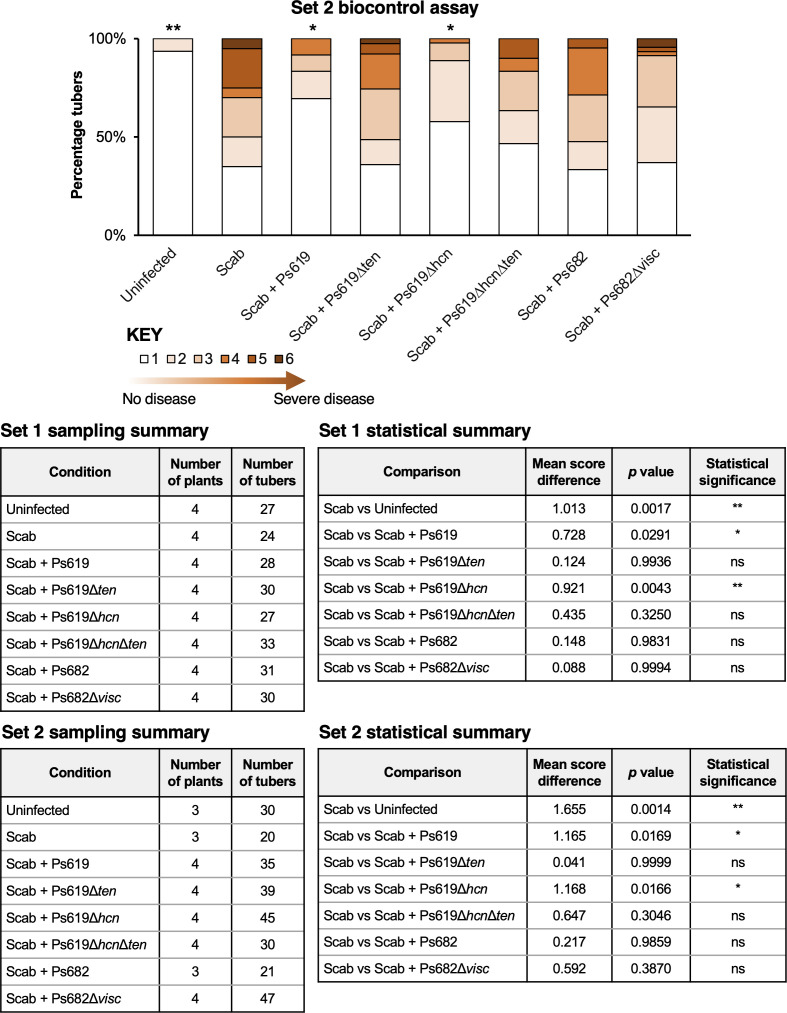
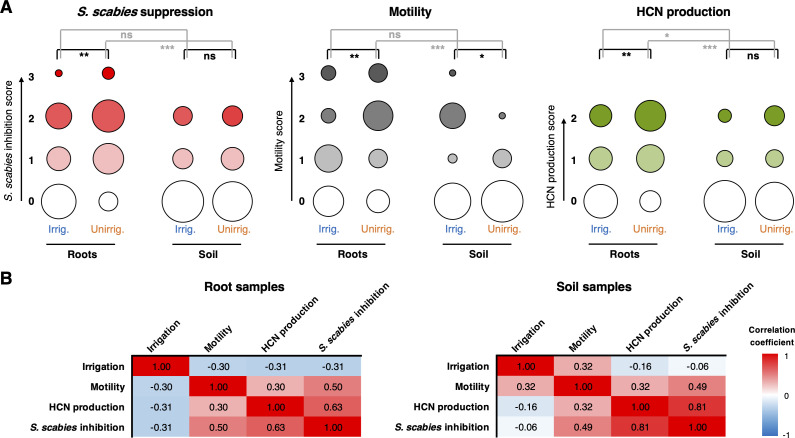
Agricultural soil harbors a diverse microbiome that can form beneficial relationships with plants, including the inhibition of plant pathogens. Pseudomonas spp. are one of the most abundant bacterial genera in the soil and rhizosphere and play important roles in promoting plant health. However, the genetic determinants of this beneficial activity are only partially understood. Here, we genetically and phenotypically characterize the Pseudomonas fluorescens population in a commercial potato field, where we identify strong correlations between specialized metabolite biosynthesis and antagonism of the potato pathogens Streptomyces scabies and Phytophthora infestans. Genetic and chemical analyses identified hydrogen cyanide and cyclic lipopeptides as key specialized metabolites associated with S. scabies inhibition, which was supported by in planta biocontrol experiments. We show that a single potato field contains a hugely diverse and dynamic population of Pseudomonas bacteria, whose capacity to produce specialized metabolites is shaped both by plant colonization and defined environmental inputs.

Keywords: Pseudomonas; Streptomyces scabies; biocontrol; genetics; genomics; infectious disease; microbiology; natural products; plant disease; potato; pseudomonas fluorescens.

Plain language summary

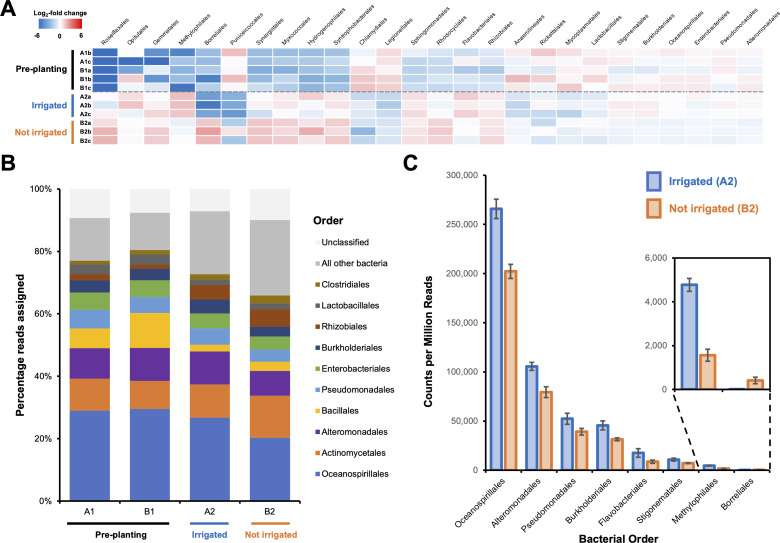
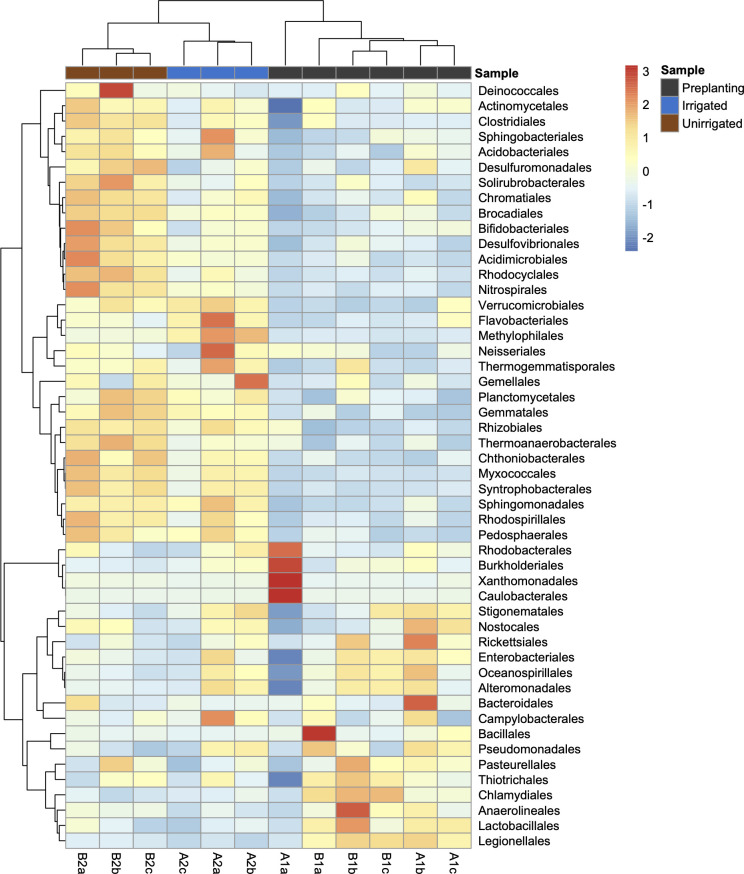
Potato scab and blight are two major diseases which can cause heavy crop losses. They are caused, respectively, by the bacterium Streptomyces scabies and an oomycete (a fungus-like organism) known as Phytophthora infestans. Fighting these disease-causing microorganisms can involve crop management techniques – for example, ensuring that a field is well irrigated helps to keep S. scabies at bay. Harnessing biological control agents can also offer ways to control disease while respecting the environment. Biocontrol bacteria, such as Pseudomonas, can produce compounds that keep S. scabies and P. infestans in check. However, the identity of these molecules and how irrigation can influence Pseudomonas population remains unknown. To examine these questions, Pacheco-Moreno et al. sampled and isolated hundreds of Pseudomonas strains from a commercial potato field, closely examining the genomes of 69 of these. Comparing the genetic information of strains based on whether they could control the growth of S. scabies revealed that compounds known as cyclic lipopeptides are key to controlling the growth of S. scabies and P. infestans. Whether the field was irrigated also had a large impact on the strains forming the Pseudomonas population. Working out how Pseudomonas bacteria block disease could speed up the search for biological control agents. The approach developed by Pacheco-Moreno et al. could help to predict which strains might be most effective based on their genetic features. Similar experiments could also work for other combinations of plants and diseases.


Conflict of interest statement

AP, FS, JF, CT, LG, RD, NK, AK, LA, SN, KF, JC, MT, GC, JM, AT No competing interests declared, GT affiliated with VCS Potatoes and has no financial interests to declare

Figures

Figure 1.
Figure 1.. Effect of irrigation on the microbial population of a potato field.
(A) The 26 bacterial orders whose populations were determined to significantly differ across one or more sampling sites using voom with a false discovery rate of 0.05. Data are shown as a heatmap of the log2-fold change with respect to the overall average counts per million for a given order. Sample A1a was omitted from the analysis due to possible contamination leading to an atypical bacterial population (Figure 1—figure supplement 1). (B) Overall average population of each sample site showing the 10 most abundant bacterial orders across all sites. (C) The eight bacterial orders whose populations were determined to significantly differ between irrigated and nonirrigated sites, represented as counts per million reads. Error bars represent the standard deviation of triplicate data.
Figure 1—figure supplement 1.
Figure 1—figure supplement 1.. Heatmap of the 50 most abundant bacterial orders across all samples (unclassified reads were removed from this analysis).
The heatmap is scaled by z-score for each row, and samples (columns) and bacterial orders (rows) are clustered by Pearson correlation. The heatmap was generated using Pheatmap (https://CRAN.R-project.org/package=pheatmap) in R 3.5.1.
Figure 2.
Figure 2.. Comparison of phylogeny, S. scabies suppression (red color scales).
P. infestans suppression (green color scale), G. graminis pv. tritici (take-all) suppression (blue color scale), phenotypes (gray color scales), natural product biosynthetic gene clusters (filled circles = presence of a gene or gene cluster), and the accessory genome (separated from biosynthetic gene clusters [BGCs] by a dotted line). In the phylogenetic tree of Pseudomonas strains, blue strains were collected from irrigated plots while orange strains were collected from unirrigated plots. All other strains were collected from the pre-irrigation plots. Figure 2—figure supplement 3 shows the relationship between these strains and the Pseudomonas phylogenomic groups defined by Garrido-Sanz et al., 2016.
Figure 2—figure supplement 1.
Figure 2—figure supplement 1.. Representative images of Pseudomonas phenotypes.
(A) Motility; (B) UV siderophore secretion; (C) hydrogen cyanide (HCN) production; (D) protease production.
Figure 2—figure supplement 2.
Figure 2—figure supplement 2.. Representative images of on-plate suppressive activity of Pseudomonas isolates.
(A) Versus S. scabies; (B) versus Gaeumannomyces graminis pv. tritici (take-all); (C) versus P. infestans.
Figure 2—figure supplement 3.
Figure 2—figure supplement 3.. Maximum likelihood tree of full-length gyrB nucleotide sequences of Pseudomonas strains with representatives of the eight Pseudomonas phylogenomic groups defined by Garrido-Sanz et al., 2016.
Black names represent pre-planting isolates, blue names represent isolates from irrigated soil, and orange names indicate isolates from unirrigated soil. Bootstrap values are shown for each branch in orange text. Sequences were aligned with MUSCLE (Edgar, 2004) and the tree was inferred using RAxML (Stamatakis, 2014). The tree was visualized using iTOL (Letunic and Bork, 2016). An interactive version of the tree annotated with features shown in Figure 2 is available at: https://itol.embl.de/tree/902431818658671633339579.
Figure 3.
Figure 3.. Correlation of biosynthetic gene clusters (BGCs) and accessory genome loci with S. scabies inhibition.
(A) Heatmap showing the 10 genotypes and phenotypes that correlated most strongly (positively and negatively) with on-plate suppression of S. scabies. Stars represent the statistical significance of a correlation using a two-tailed Mann–Whitney test (*p<0.05, **p<0.01, ***p<0.001). (B) Distributions of S. scabies suppressive activity for top 10 positive correlations. Circles are stacked from no (0) to high (3) inhibition, where filled and empty circles represent strains with and without a given genotype/phenotype, respectively. The number of strains (total = 69) in each class is listed, and the area of a circle specifies the proportion of strains with given suppressive activity.
Figure 3—figure supplement 1.
Figure 3—figure supplement 1.. Heatmap showing Pearson correlation coefficients of phenotypes and genotypes across the sequenced Pseudomonas isolates.
For clarity, any phenotype or genotype that had fewer than 5 or greater than 65 representatives (total number of strains = 69) was removed from this analysis.
Figure 4.
Figure 4.. Mass spectral networking analysis of liquid chromatography–tandem mass spectrometry (LC-MS/MS) data from the Pseudomonas strains used in this study.
Node area is proportional to the number of distinct strains where MS/MS data were acquired for a given metabolite. Node color reflects the proportion of MS/MS scans for a given node that come from strains with a S. scabies inhibition score ≥1. Nodes are labeled with the corresponding parent masses and nodes that relate to lipopeptides are labeled (multiple networks arise from differential fragmentation of [M + H]+, [M + 2H]2+, and [M + Na]+ ions). Line thickness is proportional to the cosine similarity score calculated by Global Natural Product Social Molecular Networking (GNPS) (Aron et al., 2020). The table shows production of lipopeptides by strains containing lipopeptide biosynthetic gene clusters (BGCs). Color coding reflects level of S. scabies inhibition by each strain with same scale as Figure 2 (LLP: linear lipopeptide; all others are cyclic lipopeptides [CLPs]).
Figure 4—figure supplement 1.
Figure 4—figure supplement 1.. Liquid chromatography–tandem mass spectrometry (LC-MS/MS) spectra showing that some strains produce viscosin (identical retention time and MS/MS fragmentation to viscosin produced by P. fluorescens SBW25; green boxes) and some produce an isomer with a distinct retention time and MS/MS fragmentation pattern (yellow boxes).
Figure 4—figure supplement 2.
Figure 4—figure supplement 2.. Comparison of viscosin (A) and viscosin-like (B) biosynthetic gene clusters (BGCs).
Genes encoding regulatory proteins are green, transporter genes are blue, and nonribosomal peptide synthetases (NRPS) genes are yellow. The break in the BGC indicates that the BGC is found in two distinct genomic loci. Homology to the Pseudomonas fluorescens SBW25 viscosin BGC is shown in both panels (A) and (B). The NRPS organization is displayed, where C = condensation domain, A = adenylation domain, TE = thioesterase, and small gray circles are peptidyl carrier protein domains. Amino acids incorporated by each module are displayed, along with predicted condensation domain specificity. MS/MS data showing characteristic viscosin fragmentation are also shown.
Figure 4—figure supplement 3.
Figure 4—figure supplement 3.. Genetic and liquid chromatography–tandem mass spectrometry (LC-MS/MS) analysis of tensin-like compounds.
(A) Organization of the cyclic lipopeptide (CLP) nonribosomal peptide synthetase (NRPS) biosynthetic gene cluster (BGC) from Ps619. Gene and NRPS domain colors are the equivalent to Figure 4—figure supplement 2. Amino acids predicted to be incorporated by each module are displayed, along with predicted condensation domain specificity. (B) Predicted structure, masses, and key MS/MS fragments for tensin-like compounds. (C) Representative LC-MS spectra for another producer of a tensin-like molecule, where the major product [M + 2H]2+ = 705.43. Extracted ion chromatograms are shown for m/z values relating to different acyl chain lengths. Characteristic MS/MS fragments are highlighted in red. (D) LC-MS spectra of tensin-like compounds produced by Ps907, where the major product [M + 2H]2+ = 691.41. The presence of characteristic MS/MS fragments, as well as a smaller amount of [M + 2H]2+ = 705.43, is consistent with a shorter acyl chain (see B).
Figure 4—figure supplement 4.
Figure 4—figure supplement 4.. Characterization of an anikasin-like lipopeptide from strain Ps655.
(A) Gene cluster listing the homology to the Pseudomonas fluorescens HKI0770 anikasin biosynthetic gene cluster (BGC) (MiBIG BGC0001509). The nonribosomal peptide synthetase (NRPS) organization is displayed (color coding and nomenclature as in Figure 4—figure supplement 2) and amino acids incorporated by each module are displayed, along with predicted condensation domain specificity. (B) Structure of anikasin showing calculated masses for observed MS/MS fragmentation. (C) Liquid chromatography–tandem mass spectrometry (LC-MS) data showing production of an anikasin-like molecule by Ps655 (EIC, extracted ion chromatogram). Red MS/MS fragments relate to fragments shown in panel (B) and are equivalent to the tensin fragments shown in Figure 4—figure supplement 3. A variety of isomers of anikasin have been reported (Götze et al., 2017), such as arthrofactin and pholipeptin.
Figure 4—figure supplement 5.
Figure 4—figure supplement 5.. Characterization of a putisolvin II-like lipopeptide from strain Ps623.
(A) Gene cluster listing the homology to the Pseudomonas putida PCL1445 putisolvin biosynthetic gene cluster (BGC) (MiBIG BGC0000411). The nonribosomal peptide synthetase (NRPS) organization is displayed (color coding and nomenclature as in Figure 4—figure supplement 2) and amino acids incorporated by each module are displayed, along with predicted condensation domain specificity. (B) Structure of putisolvin II showing calculated masses for observed MS/MS fragmentation. (C) Liquid chromatography–tandem mass spectrometry (LC-MS) data showing production of a putisolvin II-like molecule by Ps623 (EIC, extracted ion chromatogram). Red MS/MS fragments relate to fragments shown in panel (B).
Figure 4—figure supplement 6.
Figure 4—figure supplement 6.. Characterization of a syringafactin-like lipopeptide from strain Ps627.
(A) Gene cluster listing the homology to the P. syringae DC3000 syringafactin biosynthetic gene cluster (BGC) (MiBIG BGC0000435). The nonribosomal peptide synthetase (NRPS) organization is displayed (color coding and nomenclature as in Figure 4—figure supplement 2) with an unexpected ‘split’ A domain. Further experiments are needed to determine whether this is real or a sequencing artifact. Amino acids incorporated by each module are displayed, along with predicted condensation domain specificity. (B) Structure of syringafactin A showing calculated masses for observed MS/MS fragmentation. (C) Liquid chromatography–tandem mass spectrometry (LC-MS) data showing production of a syringafactin-like molecule by Ps627 (EIC, extracted ion chromatogram). Red MS/MS fragments relate to calculated fragments shown in panel (B).
Figure 4—figure supplement 7.
Figure 4—figure supplement 7.. Characterization of a cichofactin-like lipopeptide from strain Ps689.
(A) Gene cluster listing the homology to the Pseudomonas cichorii cichofactin biosynthetic gene cluster (BGC) (MiBIG BGC0000323). The nonribosomal peptide synthetase (NRPS) organization is displayed (color coding and nomenclature as in Figure 4—figure supplement 2). Amino acids incorporated by each module are displayed, along with predicted condensation domain specificity. (B) Structure of cichofactins showing calculated and observed [M + 2H]2+ values. (C) Liquid chromatography–tandem mass spectrometry (LC-MS) data showing production of a cichofactin-like molecules by Ps689 (EIC, extracted ion chromatogram). Red MS/MS fragments relate to fragments reported for [cichofactin A + Na]+ in Pauwelyn et al., 2013.
Figure 5.
Figure 5.. The role of the Ps682 cyclic lipopeptide (CLP) biosynthetic gene cluster (BGC) in S. scabies suppression.
(A) BGC displaying identity/coverage scores in comparison to the viscosin BGC in P. fluorescens SBW25. Genes encoding regulatory proteins are green, transporter genes are blue, and nonribosomal peptide synthetase (NRPS) genes are yellow. The NRPS organization is shown, where C = condensation domain, A = adenylation domain, TE = thioesterase domain, and gray circles are peptidyl carrier protein domains. Amino acids incorporated by each module are displayed, along with predicted condensation domain specificity. (B) Liquid chromatography–mass spectrometry (LC-MS) analysis of viscosin I production in the WT strain and a mutant (Ps682 ∆visc) with an in-frame deletion of NRPS gene 04206 (EIC = extracted ion chromatogram). Nuclear magnetic resonance (NMR) and MS/MS data for viscosin I are shown in Figure 5—figure supplements 2–13. (C) Disk diffusion assay of viscosin I against S. scabies. Concentrations are indicated (µg/mL), alongside a methanol control. (D) On-plate S. scabies suppression activity of Ps682 alongside Ps682 ∆visc shown as cross-streaks using strains with and without the lux operon. Bioluminescence was detected using a NightOWL camera (Berthold Technologies).
Figure 5—figure supplement 1.
Figure 5—figure supplement 1.. Swarming motility of wild-type Ps682 and Ps682 ∆visc.
Figure 5—figure supplement 2.
Figure 5—figure supplement 2.. Detailed mass spectrometry (MS) analysis of viscosin-like molecule produced by Ps682.
(A) MS/MS spectrum with annotated peaks color coded (intensity zoomed ×4 for clarity). Red labels, b and y fragments; green labels, loss of water from b/y fragments; blue labels, a fragments. (B) Viscosin I accurate mass spectrum plus MS/MS fragment annotations. (C) Liquid chromatography–tandem mass spectrometry (LC-MS) comparison of Ps682 (viscosin I) versus Pseudomonas producers of WLIP and viscosin. EIC, extracted ion chromatogram.
Figure 5—figure supplement 3.
Figure 5—figure supplement 3.. Atom numbering for viscosin I nuclear magnetic resonance (NMR) annotation.
Figure 5—figure supplement 4.
Figure 5—figure supplement 4.. 1H nuclear magnetic resonance (NMR) spectrum of viscosin I (600 MHz, DMF-d7, 298 K).
(A) Full spectrum; (B) and (C) show expanded regions of the spectrum.
Figure 5—figure supplement 5.
Figure 5—figure supplement 5.. 13C nuclear magnetic resonance (NMR) spectrum (DEPT135) of viscosin I (600 MHz, DMF-d7, 298 K).
Figure 5—figure supplement 6.
Figure 5—figure supplement 6.. 2D COSY nuclear magnetic resonance (NMR) spectrum of viscosin I (600 MHz, DMF-d7, 298 K).
Figure 5—figure supplement 7.
Figure 5—figure supplement 7.. Expanded regions of 2D COSY nuclear magnetic resonance (NMR) spectrum of viscosin I (600 MHz, DMF-d7, 298 K).
Figure 5—figure supplement 8.
Figure 5—figure supplement 8.. 2D HSQC-EDITED nuclear magnetic resonance (NMR) spectrum of viscosin I (600 MHz, DMF-d7, 298 K).
Figure 5—figure supplement 9.
Figure 5—figure supplement 9.. Expansion of (A) α-C, (B) side chain, and (C) Me-group regions of 2D HSQC-EDITED nuclear magnetic resonance (NMR) spectrum of viscosin I (600 MHz, DMF-d7, 298 K).
Figure 5—figure supplement 10.
Figure 5—figure supplement 10.. 2D TOCSY nuclear magnetic resonance (NMR) spectrum of viscosin I (600 MHz, DMF-d7, 298 K).
Figure 5—figure supplement 11.
Figure 5—figure supplement 11.. 2D HMBC nuclear magnetic resonance (NMR) spectrum of viscosin I (600 MHz, DMF-d7, 298 K).
Figure 5—figure supplement 12.
Figure 5—figure supplement 12.. 2D HSQC-TOCSY nuclear magnetic resonance (NMR) spectrum of viscosin I (600 MHz, DMF-d7, 298 K).
Figure 5—figure supplement 13.
Figure 5—figure supplement 13.. High-field region of 2D HSQC-TOCSY nuclear magnetic resonance (NMR) spectrum of viscosin I (600 MHz, DMF-d7, 298 K).
Figure 5—figure supplement 14.
Figure 5—figure supplement 14.. Time course of viscosin I disk diffusion assays against S. scabies 87–22 on Instant Potato Medium (IPM).
Viscosin I concentrations (μg/mL) are indicated, along with a methanol control.
Figure 6.
Figure 6.. The role of the Ps619 cyclic lipopeptide (CLP) and hydrogen cyanide (HCN) gene clusters in S. scabies suppression.
(A) Predicted structure of the tensin-like molecule and liquid chromatography–tandem mass spectrometry (LC-MS) analysis of CLP production in wild-type (WT) Ps619 and a mutant (Ps619 ∆ten) with an in-frame deletion of nonribosomal peptide synthetase (NRPS) gene 02963 (see Figure 4—figure supplement 3 for biosynthetic gene cluster [BGC] information). (B) Cross-streak assays of Ps619 and associated mutants with S. scabies. See Figure 6—figure supplement 2A for assays with drier plates. (C) Cryo-scanning electron microscopy (Cryo-SEM) images of the interfacial region between the Ps619 strains and S. scabies. The order of images is identical to the cross-streaks in panel (B).
Figure 6—figure supplement 1.
Figure 6—figure supplement 1.. Pearson correlation coefficients for phenotypes across both sequenced and unsequenced isolates.
Isolates where one or more reliable phenotypes were not obtained (Supplementary file 1) were omitted from this correlation analysis.
Figure 6—figure supplement 2.
Figure 6—figure supplement 2.. Effect of Ps619 on S. scabies growth and development.
(A) Cross-streak assays (7 days post-inoculation) of Ps619 and associated mutants with S. scabies on drier conditions than in Figure 6B. S. scabies (Ss) is streaked vertically first and then Ps619 is streaked horizontally. (B) Split plates (6 days post-inoculation) of S. scabies grown alongside Ps619 WT and mutant strains. The characteristic gray spore pigment of S. scabies (seen in control plate) is not present when grown alongside wild-type or Δten strains.
Figure 6—figure supplement 3.
Figure 6—figure supplement 3.. Further cryo-scanning electron microscopy (cryo-SEM) images of the interfacial region between the Ps619 strains and S. scabies (Ss) showing that a well-defined boundary only exists with the Ps619 ∆ten∆hcn strain (bottom right).
Figure 7.
Figure 7.. Potato scab biocontrol assay.
The bar chart shows the percentage of diseased tubers following infection with S. scabies (‘Scab’) along with treatment by Ps619, Ps682, and associated mutants. Tubers were scored using a disease severity index from 1 to 6 according to the method of Andrade et al., 2019. Statistical analyses were calculated by taking into account the average disease index of each plant (n = 4). p-Values were calculated using Dunnett’s multiple comparison test, and asterisks indicate *p<0.05, **0.01 as compared to scab treatment only. Results of a repeat biocontrol experiment and further statistical statistics are shown in Figure 7—figure supplement 1.
Figure 7—figure supplement 1.
Figure 7—figure supplement 1.. Results from set 2 of the potato scab biocontrol assay (set 1 data shown in Figure 7) alongside statistical summaries of the two sets of experiments.
This assay represents a full repeat of the set 1 experiment, which was started at a different time with a different set of plants. The bar chart shows the percentage of diseased tubers following infection with S. scabies (‘Scab’) along with treatment by Ps619, Ps682, and associated mutants. Tubers were scored using a disease severity index from 1 to 6 according to the method of Andrade et al., 2019. Statistical analyses were calculated by using the average disease index of each plant (n = 3 or 4). p-Values were calculated using Dunnett’s multiple comparison test, and asterisks indicate *p<0.05, **0.01 as compared to scab treatment only (ns, not significant).
Figure 8.
Figure 8.. The effect of irrigation and environment (soil versus root) on the P. fluorescens population.
(A) Plots showing the proportion of strains exhibiting a particular phenotype from each environment (n = 48 for each condition). Hydrogen cyanide (HCN) production was scored on a scale of 0–2 based on a qualitative assessment of the color change in the Feigl–Anger assay. The size of each circle is proportional to the number of strains with a given phenotypic score. Statistical comparisons were carried out using two-tailed Mann–Whitney tests where ns (not significant) = p≥0.05, *p<0.05, ** p<0.01, ***p<0.001. (B) Pearson correlation scores for phenotypes from strains isolated from roots (n = 96) and soil (n = 96).
Appendix 1—figure 1.
Appendix 1—figure 1.. Comparison of characterized pyochelin-like biosynthetic gene cluster (BGCs) versus pyochelin-like BGCs identified in this work.
BGCs were retrieved from MIBiG (https://mibig.secondarymetabolites.org) (Kautsar et al., 2020) for pyochelin (BGC0000412), coelibactin (BGC0000324), and thiazostatin (BGC0001801). BGC homology was assessed using BiG-SCAPE (https://git.wageningenur.nl/medema-group/BiG-SCAPE/) (Navarro-Muñoz et al., 2020) in glocal mode with a cutoff of 0.75. Two figures show two distinct families.
Appendix 1—figure 2.
Appendix 1—figure 2.. Biosynthetic gene clusters (BGCs) that correlate with S. scabies inhibition.
(A) Putative Pep BGCs. (B) Hydrogen cyanide (HCN) BGC compared to the characterized P. aeruginosa PAO1 BGC (Pessi and Haas, 2000).
Appendix 1—figure 3.
Appendix 1—figure 3.. Examples of biosynthetic gene clusters (BGCs) not previously characterized in P. fluorescens.
(A) Fosfomycin-like BGC in strain Ps833. Comparison to the psf BGC in P. syringae PB-5123 is shown, where color coding represents homologous genes (identity and coverage values relate to encoded proteins). Gene numbers colored in red have been experimentally characterized and encode enzymes that catalyze key biosynthetic steps (Kim et al., 2012; Olivares et al., 2017). (B) Aminoglycoside-like BGC in strain Ps639. Comparison to the par BGC in S. rimosus is shown, where color coding represents homologous genes (identity and coverage values relate to encoded proteins). Gene numbers colored in red are predicted to be required for the biosynthesis of the minimal aminoglycoside, neamine (Kudo and Eguchi, 2009).
Appendix 1—figure 4.
Appendix 1—figure 4.. Different pyrroloquinoline quinone (PQQ) biosynthetic gene clusters (BGCs) identified in this study.
Comparison to the pqq BGC in P. fluorescens Pf0-1 is shown, where color coding represents homologous genes and % identity/coverage indicate how similar the encoded proteins are to the Pf0-1 PQQ proteins. *Gene not annotated but pqqA homologue identified by tblastn analysis.
Appendix 2—figure 1.
Appendix 2—figure 1.. Genotypes and phenotypes that correlate with the suppression of different plant pathogens.
(A) Heatmap of Pearson correlation coefficients of pathogen inhibition versus genotypes and phenotypes (see Figure 3—figure supplement 1 for full correlations; the same color scale is used). (B) On-plate inhibition of G. graminis growth by wild-type (WT) and mutant Ps619 strains. (C) On-plate inhibition of P. infestans growth by WT and mutant Ps619 strains. (D) WT and mutant Ps682 activity towards P. infestans and G. graminis.

References

    1. Alsohim AS, Taylor TB, Barrett GA, Gallie J, Zhang XX, Altamirano-Junqueira AE, Johnson LJ, Rainey PB, Jackson RW. The biosurfactant viscosin produced by Pseudomonas fluorescens SBW25 aids spreading motility and plant growth promotion. Environmental Microbiology. 2014;16:2267–2281. doi: 10.1111/1462-2920.12469. - DOI - PubMed
    1. Andrade M, Niederheitmann M, de Paula Ribeiro SRR, Oliveira LC, Pozza EA, Pinto C. Development and validation of a standard area diagram to assess common scab in potato tubers. European Journal of Plant Pathology. 2019;154:739–750. doi: 10.1007/s10658-019-01697-z. - DOI
    1. Aron AT, Gentry EC, McPhail KL, Nothias LF, Nothias-Esposito M, Bouslimani A, Petras D, Gauglitz JM, Sikora N, Vargas F, van der Hooft JJJ, Ernst M, Kang KB, Aceves CM, Caraballo-Rodríguez AM, Koester I, Weldon KC, Bertrand S, Roullier C, Sun K, Tehan RM, Boya P CA, Christian MH, Gutiérrez M, Ulloa AM, Tejeda Mora JA, Mojica-Flores R, Lakey-Beitia J, Vásquez-Chaves V, Zhang Y, Calderón AI, Tayler N, Keyzers RA, Tugizimana F, Ndlovu N, Aksenov AA, Jarmusch AK, Schmid R, Truman AW, Bandeira N, Wang M, Dorrestein PC. Reproducible molecular networking of untargeted mass spectrometry data using GNPS. Nature Protocols. 2020;15:1954–1991. doi: 10.1038/s41596-020-0317-5. - DOI - PubMed
    1. Arseneault T, Goyer C, Filion M. Phenazine production by Pseudomonas sp. LBUM223 contributes to the biological control of potato common scab. Phytopathology. 2013;103:995–1000. doi: 10.1094/PHYTO-01-13-0022-R. - DOI - PubMed
    1. Arseneault T, Goyer C, Filion M. Pseudomonas fluorescens LBUM223 increases potato yield and reduces common scab symptoms in the field. Phytopathology. 2015;105:1311–1317. doi: 10.1094/PHYTO-12-14-0358-R. - DOI - PubMed

Publication types

MeSH terms

Supplementary concepts