. 2022 Jan 27;38(4):1059-1066.
doi: 10.1093/bioinformatics/btab783.

Idéfix: identifying accidental sample mix-ups in biobanks using polygenic scores

Affiliations

Idéfix: identifying accidental sample mix-ups in biobanks using polygenic scores

Robert Warmerdam et al. Bioinformatics. .

Abstract

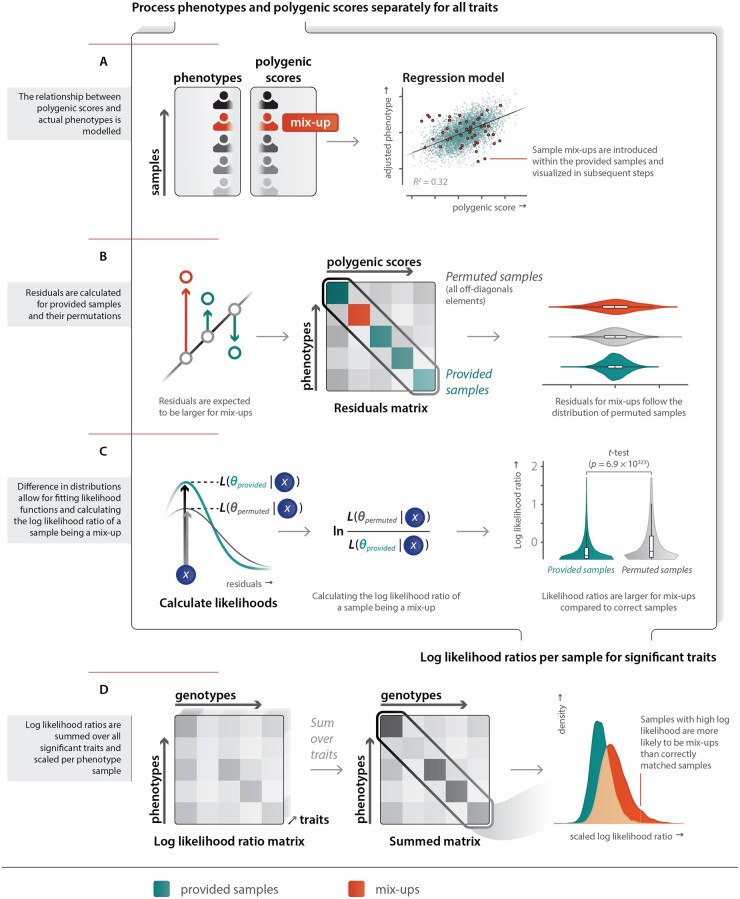
Motivation: Identifying sample mix-ups in biobanks is essential to allow the repurposing of genetic data for clinical pharmacogenetics. Pharmacogenetic advice based on the genetic information of another individual is potentially harmful. Existing methods for identifying mix-ups are limited to datasets in which additional omics data (e.g. gene expression) is available. Cohorts lacking such data can only use sex, which can reveal only half of the mix-ups. Here, we describe Idéfix, a method for the identification of accidental sample mix-ups in biobanks using polygenic scores.

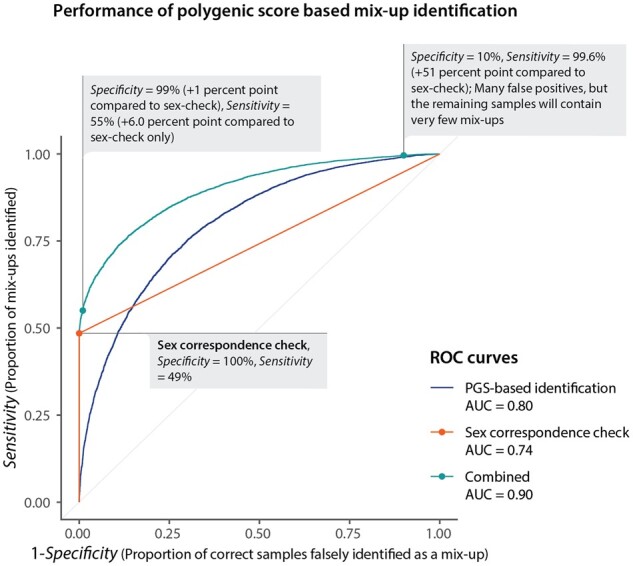
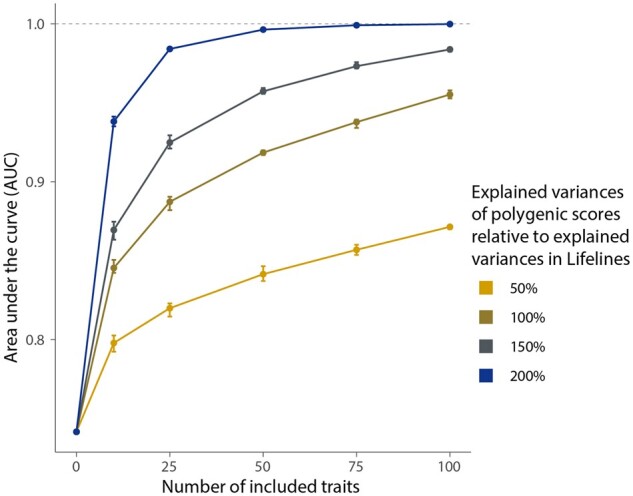
Results: In the Lifelines population-based biobank, we calculated polygenic scores (PGSs) for 25 traits for 32 786 participants. We then applied Idéfix to compare the actual phenotypes to PGSs, and to use the relative discordance that is expected for mix-ups, compared to correct samples. In a simulation, using induced mix-ups, Idéfix reaches an AUC of 0.90 using 25 polygenic scores and sex. This is a substantial improvement over using only sex, which has an AUC of 0.75. Subsequent simulations present Idéfix's potential in varying datasets with more powerful PGSs. This suggests its performance will likely improve when more highly powered GWASs for commonly measured traits will become available. Idéfix can be used to identify a set of high-quality participants for whom it is very unlikely that they reflect sample mix-ups, and for these participants we can use genetic data for clinical purposes, such as pharmacogenetic profiles. For instance, in Lifelines, we can select 34.4% of participants, reducing the sample mix-up rate from 0.15% to 0.01%.

Availabilityand implementation: Idéfix is freely available at https://github.com/molgenis/systemsgenetics/wiki/Idefix. The individual-level data that support the findings were obtained from the Lifelines biobank under project application number ov16_0365. Data is made available upon reasonable request submitted to the LifeLines Research office (research@lifelines.nl, https://www.lifelines.nl/researcher/how-to-apply/apply-here).

Supplementary information: Supplementary data are available at Bioinformatics online.


Figures

Fig. 1.
Fig. 1.
Method overview that indicates how PGSs and measured phenotypes are used to identify mix-ups. The steps A, B and C are performed separately for all traits. The scatterplot in A, and the distributions visualized in B, C and D are generated using a subset of 5120 samples from the Lifelines dataset of which 1% was introduced as a fake sample mix-up (shown in red). (A) The relationship between the input variables is modeled together in a linear model for a continuous trait. This is shown on the right. Introduced fake mix-ups are shown in red. (B) Residuals are calculated using the previously fitted model for both the provided sample mappings (main diagonal of the plotted matrix) and the permuted samples (off diagonal in the plotted matrix). The violin plots on the right indicate that permuted samples (grey) and mix-ups (red) are similarly distributed and differ from the residuals for the provided sample mappings (green). (C) (left) For continuous traits, Gaussian functions are fitted to the permuted (grey) and provided sample mappings (green) to calculate the likelihood of a residual fitting better in the correct or mix-up residual distributions. (middle) Dividing the likelihoods and log-transforming the results in log likelihood ratios of a sample being a mix-up (LLRs). (right) A t-test is used to test if there is a significant difference between LLRs for permuted and provided sample mappings. (D) The matrices on the left and middle indicate summing LLRs over significant traits, and that this aids the predictive power of LLRs. The densities on the right indicate the predictive power of LLRs scaled per row of the LLR matrix
Fig. 2.
Fig. 2.
Performance of polygenic score-based mix-up identification. Performance of the polygenic score-based mix-up predictor (blue), the sex concordance check (sex correspondence check, orange) and a combined predictor (green) as illustrated by receiver operating characteristics (ROC). The x-axis indicates the proportion of correct samples that are falsely identified as a mix-up, named the false discovery rate (FDR), which corresponds to 1-specificity. The y-axis represents the proportion of mix-ups that are identified as mix-ups, named the true positive rate (TPR) or the sensitivity. Coordinates of one of the curves correspond to the specificity and sensitivity for a particular threshold of the predictor. Due to male–female imbalance in the dataset, the proportion of mix-ups identified as shown for the sex correspondence check deviates from the expected value of 0.5. Because of this deviation, the AUC is 0.74 as opposed to the expected AUC of 0.75 given an equal number of males and females
Fig. 3.
Fig. 3.
The increase in performance of Idéfix with an increase in the number of traits and an increase in power of PGSs. The figure shows that an AUC for 25 traits including the sex-check ranges from 0.82 to 0.98 when the explained variance of PGSs is varied from 50% up to 200%, relative to the actual explained variance of the PGSs in Lifelines. The points represent the mean for each simulated dataset over five iterations. Error bars represent the total range for the five iterations

References

    1. Buyske S. et al. (2009) When a case is not a case: effects of phenotype misclassification on power and sample size requirements for the transmission disequilibrium test with affected child trios. Hum. Hered., 67, 287–292. - PubMed
    1. Cai B. et al. (2017) Matching phenotypes to whole genomes: lessons learned from four iterations of the personal genome project community challenges. Hum. Mutat., 38, 1266–1276. - PMC - PubMed
    1. Canela-Xandri O. et al. (2018) An atlas of genetic associations in UK Biobank. Nat. Genet., 50, 1593–1599. - PMC - PubMed
    1. Chang C.C. et al. (2015) Second-generation PLINK: rising to the challenge of larger and richer datasets. GigaScience, 4, 7. - PMC - PubMed
    1. Chun,S. et al. (2020) Non-parametric Polygenic Risk Prediction via Partitioned GWAS Summary Statistics. American Journal of Human Genetics, 107, 46–59. 10.1016/j.ajhg.2020.05.004 32470373 - DOI - PMC - PubMed

Publication types