. 2021 Jan-Dec;13(1):1988390.
doi: 10.1080/19490976.2021.1988390.

Yersinia pseudotuberculosis YopE prevents uptake by M cells and instigates M cell extrusion in human ileal enteroid-derived monolayers

Affiliations

Yersinia pseudotuberculosis YopE prevents uptake by M cells and instigates M cell extrusion in human ileal enteroid-derived monolayers

Alyssa C Fasciano et al. Gut Microbes. 2021 Jan-Dec.

Abstract

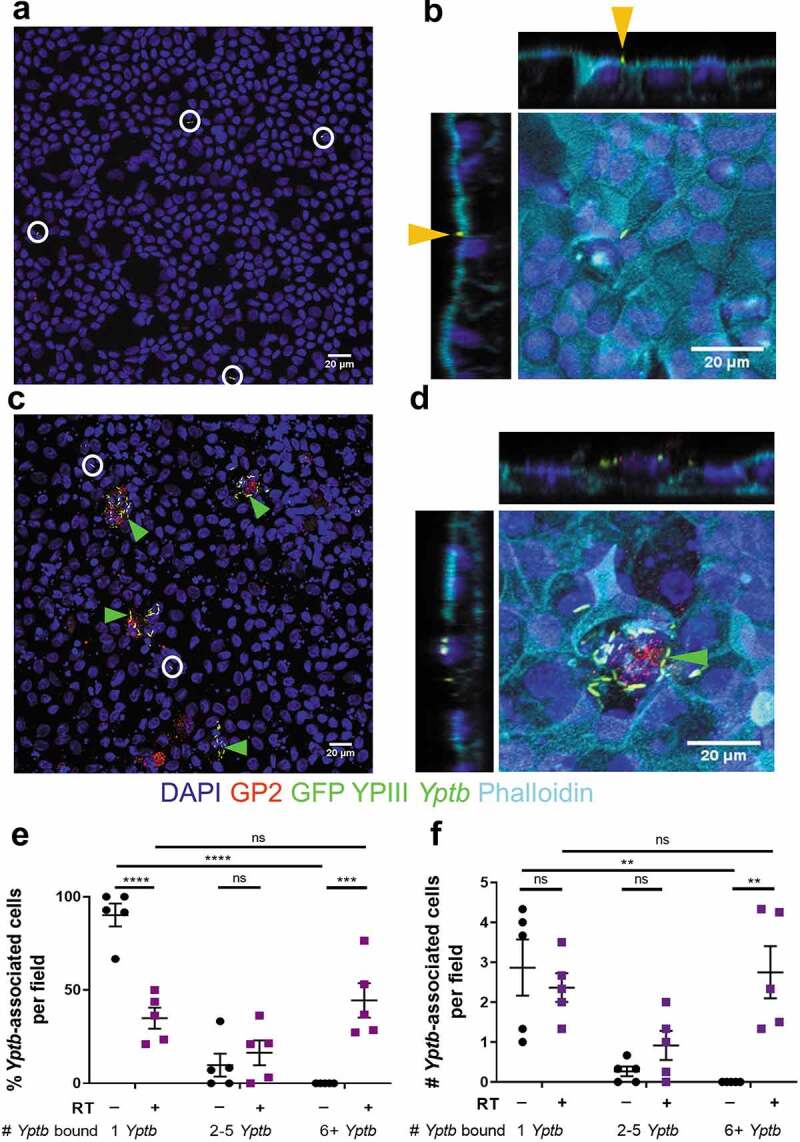
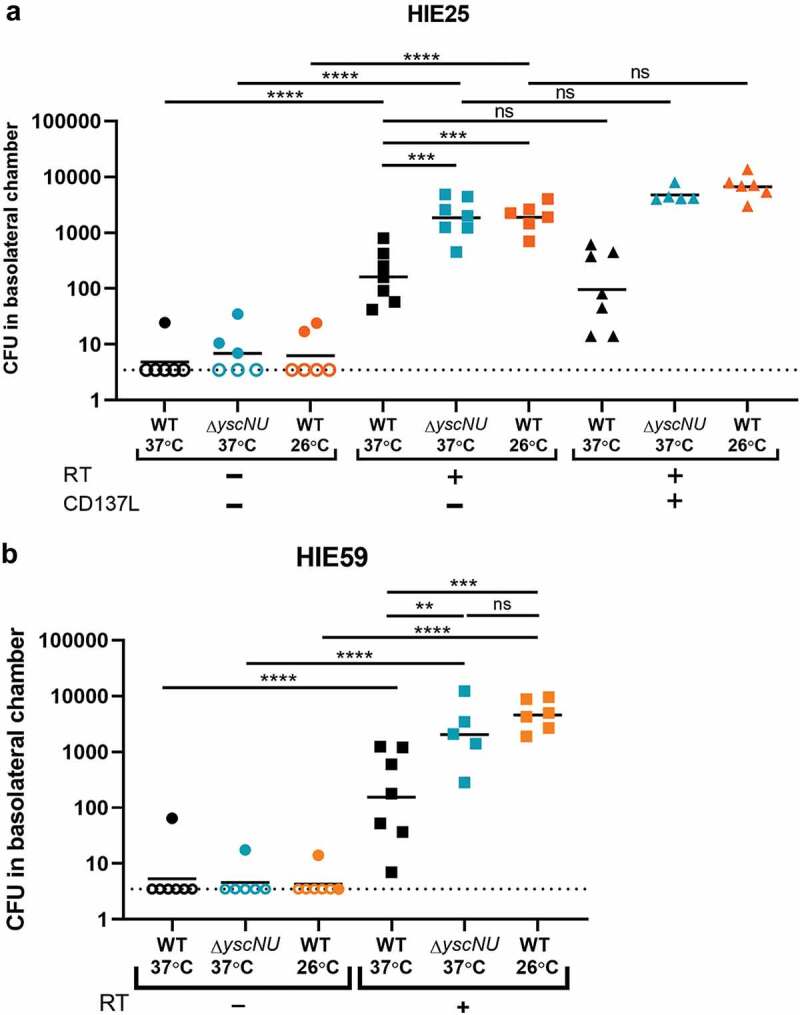
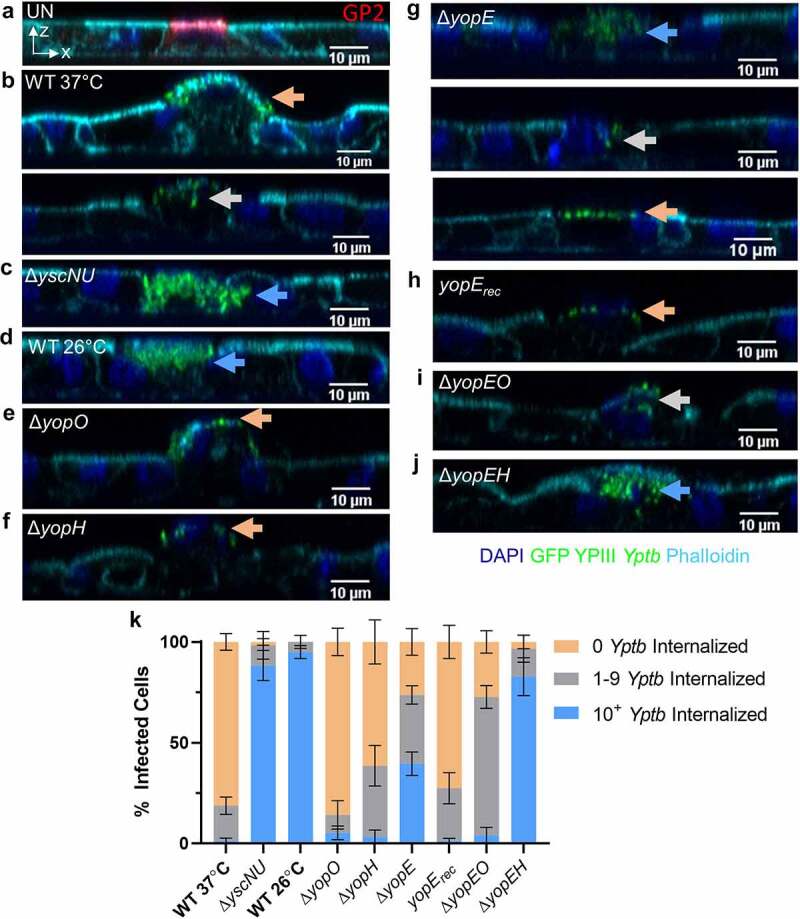
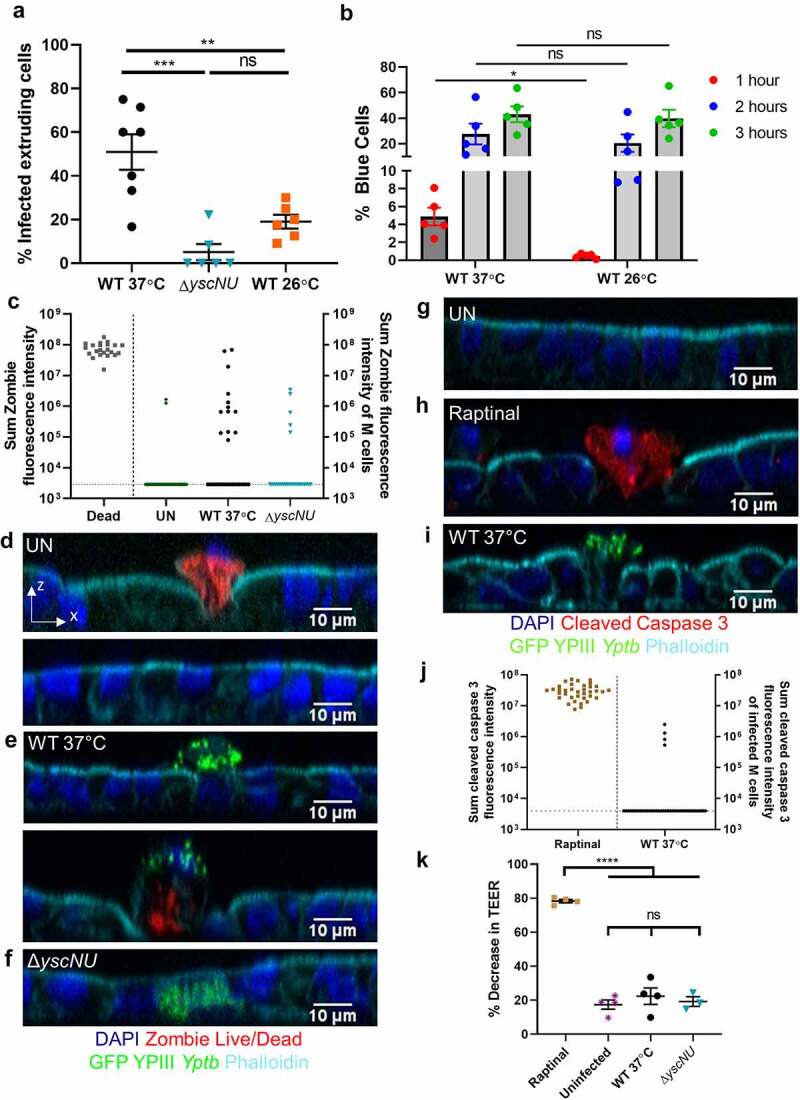
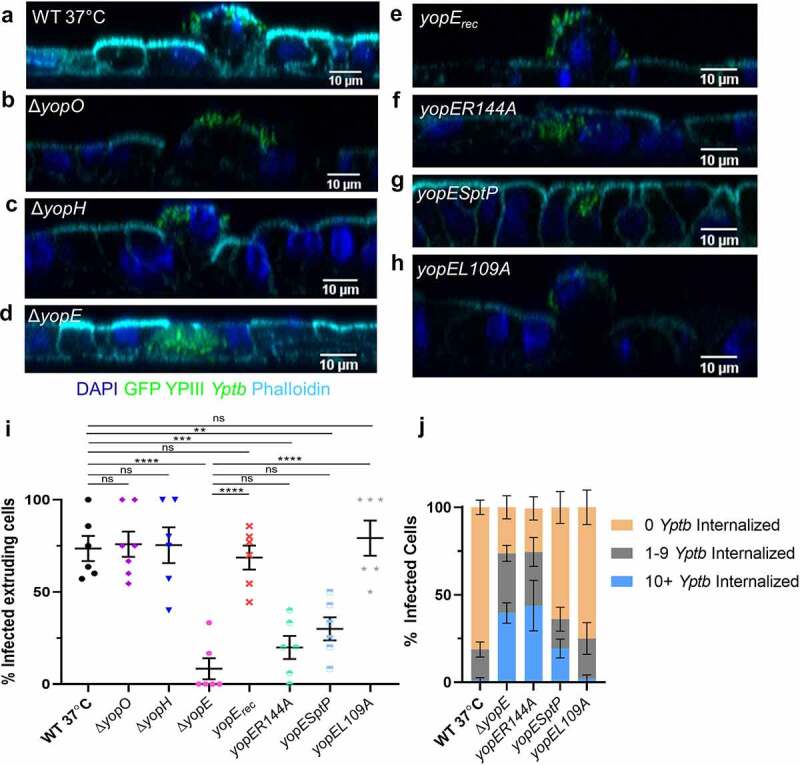
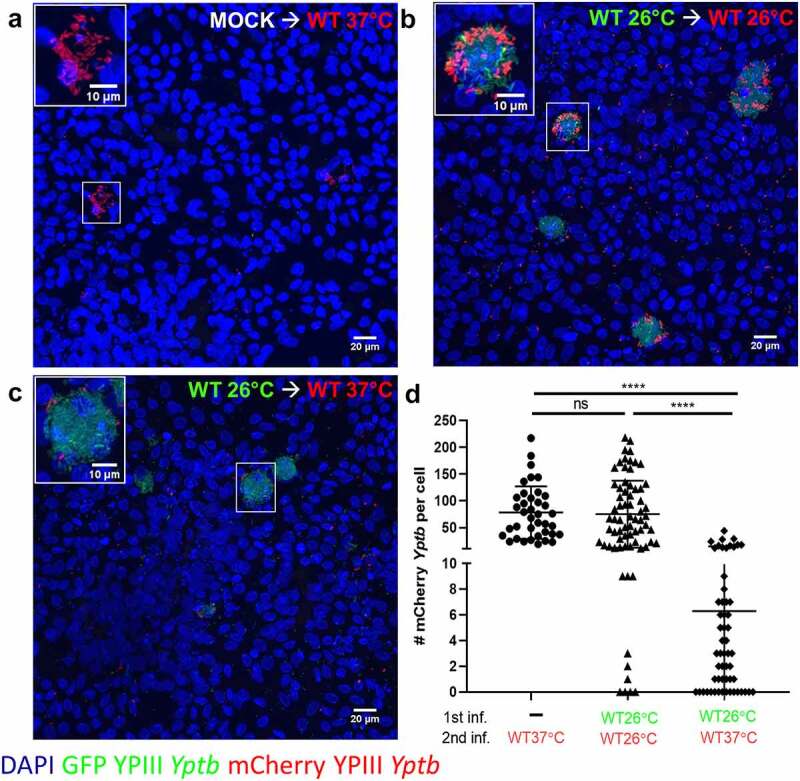
Many pathogens use M cells to access the underlying Peyer's patches and spread to systemic sites via the lymph as demonstrated by ligated loop murine intestinal models. However, the study of interactions between M cells and microbial pathogens has stalled due to the lack of cell culture systems. To overcome this obstacle, we use human ileal enteroid-derived monolayers containing five intestinal cell types including M cells to study the interactions between the enteric pathogen, Yersinia pseudotuberculosis (Yptb), and M cells. The Yptb type three secretion system (T3SS) effector Yops inhibit host defenses including phagocytosis and are critical for colonization of the intestine and Peyer's patches. Therefore, it is not understood how Yptb traverses through M cells to breach the epithelium. By growing Yptb under two physiological conditions that mimic the early infectious stage (low T3SS-expression) or host-adapted stage (high T3SS-expression), we found that large numbers of Yptb specifically associated with M cells, recapitulating murine studies. Transcytosis through M cells was significantly higher by Yptb expressing low levels of T3SS, because YopE and YopH prevented Yptb uptake. YopE also caused M cells to extrude from the epithelium without inducing cell-death or disrupting monolayer integrity. Sequential infection with early infectious stage Yptb reduced host-adapted Yptb association with M cells. These data underscore the strength of enteroids as a model by discovering that Yops impede M cell function, indicating that early infectious stage Yptb more effectively penetrates M cells while the host may defend against M cell penetration of host-adapted Yptb.

Keywords: M cell; Yersinia pseudotuberculosis; YopE; YopH; cell extrusion; human ileal enteroid; organoid; polarized epithelial; transcytosis; type three secretion system.


Conflict of interest statement

The authors declare no competing interests.

Figures

Figure 1.
Figure 1.
WT Yptb binds to enteroid-derived M cells in large numbers. HIE25 ileal monolayers were differentiated under (a-b) RT- or (c-d) RT+ conditions (200 ng/ml RANKL and 50 ng/ml TNFα). Monolayers were infected for 5 hours with 5 × 106 CFU WT YPIII Yptb expressing GFP (green) and stained with anti-GP2 antibody (M cells-red), DAPI (nuclei-blue), and phalloidin (F-actin-cyan). XY planes are maximum intensity projections. White circles/Orange arrows denote a single bacterium. Green arrows denote multiple Yptb. (b, d) Orthogonal XZ and YZ planes are shown. (e) The percentage of Yptb-associated cells per field was plotted according to the number of Yptb (1, 2–5, or 6+) bound to a cell. Each field is 1/320 of a Transwell. (f) The number of Yptb-associated cells per field was plotted according to the number of Yptb (1, 2–5, or 6+) bound to a cell. (e-f) Data were pooled from 3+ independent experiments with 2–4 fields analyzed per Transwell and averaged. Each symbol represents the average from one Transwell. Bars indicate mean and SEM. Statistical significance was determined using a two-way ANOVA with Tukey’s post hoc multiple comparison test
Figure 2.
Figure 2.
Yptb binds to M cells using invasin. (a-b) Differentiated uninfected HIE25 ileal monolayers (a) RT- or (b) RT+ were stained for apical β1 integrin (red) and DAPI (nuclei-blue). (c) XZ plane of RT+ monolayer shows β1 integrin+ M cell and neighboring non-M cells stained with phalloidin (F-actin-cyan). (d) Fluorescence intensity of F-actin was measured for each M cell and corresponding adjacent non-M cells and divided by cell area. Each point represents an M cell or the average of the corresponding neighboring non-M cells. Bars indicate mean and SD. Data were pooled from 3 images from 3 independent experiments. (e-i) Differentiated HIE25 RT+ monolayers were infected for 5 hours with 5 × 106 CFU (e) WT, (f) ΔyadA, (g) Δinv, or (h) Δinv/yadA YPIII Yptb expressing GFP (green) and stained with anti-β1 integrin antibody (red) and DAPI (nuclei-blue). Magnified insets of an M cell are shown in upper right corner. XY planes are maximum intensity projections. (i) The percentage of Yptb-associated cells per field was plotted according to the number of Yptb (1, 2–5, or 6+) bound to a cell. (j) The number of Yptb-associated cells per field was plotted according to the number of Yptb (1, 2–5, or 6+) bound to a cell. (i-j) Data were pooled from 3+ independent experiments with 2–4 fields analyzed per Transwell and averaged. Each symbol represents the average from one Transwell. Bars indicate mean and SEM. Statistical significance was determined using a two-way ANOVA with Tukey’s post hoc multiple comparison test, with comparisons between columns within each row
Figure 3.
Figure 3.
Yptb breaches the epithelium in the presence of M cells. (a) Differentiated HIE25 ileal monolayers were RT-, RT+, or RT+ with 100 ng/mL CD137L. Monolayers were infected for 3 hours with 5 × 106 CFU of WT 37°C, ΔyscNU 37°C, or WT 26°C, all expressing GFP, and basolateral media was plated for CFU. Data were pooled from 3+ independent experiments. (b) Differentiated HIE59 ileal monolayers (RT- or RT+) were infected as in (A). Data were pooled from 3+ independent experiments. (a-b) Each point represents one Transwell. Bars indicate geometric mean. Dotted line indicates limit of detection. Open shapes indicate CFU values below limit of detection. Statistics were performed on the log-transformed values with a two-way ANOVA and Tukey’s post hoc multiple comparison tests
Figure 4.
Figure 4.
YopE and YopH contribute to inhibition of Yptb internalization by M cells. (a-j) Differentiated HIE25 RT+ ileal monolayers were (a) uninfected or infected for 5 hours with 5 × 106 CFU of (b) WT 37°C, (c) ΔyscNU, (d) WT 26°C, (e) ΔyopO, (f) ΔyopH, (g) ΔyopE, (h) ΔyopE + yopErec, (i) ΔyopEO, and (j) ΔyopEH YPIII Yptb expressing GFP (green). Monolayers were stained with DAPI (nuclei-blue) and phalloidin (F-actin-cyan). (A) was stained with anti-GP2 antibody (M cells-red). Orthogonal XZ planes were analyzed for the presence of Yptb on an M cell surface (0 Yptb internalized-Orange arrows), partially internalized in an M cell (1–9 Yptb internalized-gray arrows), or fully internalized in an M cell (10+ Yptb internalized-blue arrows). (k) Number of Yptb internalized in each M cell was determined and the percentage of cells with the specified number of internalized Yptb per field was plotted. Error bars indicate SEM. Data were pooled from 3+ independent experiments with 2–4 fields analyzed per Transwell and averaged. Statistics were performed using a two-way ANOVA and Tukey’s post hoc multiple comparison tests and are shown in Table S1
Figure 5.
Figure 5.
Yptb T3SS causes M cell extrusion independent of cell death. (a) Differentiated HIE25 RT+ ileal monolayers were infected for 5 hours with 5 × 106 CFU of WT 37°C, ΔyscNU, or WT 26°C YPIII Yptb expressing GFP. The percentage of extruding infected M cells per field was plotted. Each point represents one Transwell. Bars indicate mean and SEM. Data were pooled from 3+ independent experiments with 2–4 fields analyzed per Transwell and averaged. Statistics were performed with a one-way ANOVA and Tukey’s post hoc multiple comparison tests. (b) HEp-2 cells were infected for 1 h, 2 h, or 3 h with WT YPIII Yptb expressing YopETEM grown at 37°C or 26°C and were analyzed for % blue cells (TEM-positive). Each point represents an independent experiment. Statistics were performed with a two-way ANOVA on paired data and Sidak’s post hoc multiple comparison tests. (c-f) Differentiated HIE25 RT+ ileal monolayers were (d) uninfected or infected for 5 hours with 5 × 106 CFU (e) WT 37°C, or (f) ΔyscNU YPIII Yptb expressing GFP (green) and stained with Zombie Live/Dead stain (red), DAPI (nuclei-blue), and phalloidin (F-actin-cyan). Orthogonal XZ planes are shown. (c) Sum fluorescence intensity of Zombie. Each point represents a dead extruding cell or an M cell that was uninfected (GP2+) or infected with WT 37°C or ΔyscNU YPIII Yptb expressing GFP. 37 uninfected, 32 WT 37°C-infected, and 27 ΔyscNU-infected M cells were analyzed. Horizontal line indicates limit of detection. Data were pooled from 3 independent experiments. (g-i) Differentiated HIE25 RT+ ileal monolayers were (g) uninfected, (h) treated with 13 µM raptinal, or (i) infected for 5 hours with 5 × 106 CFU WT 37°C YPIII Yptb expressing GFP (green) and stained for cleaved caspase 3 (red), DAPI (nuclei-blue), and phalloidin (F-actin-cyan). (j) Sum fluorescence intensity of cleaved caspase 3. Each point represents either a raptinal-induced apoptotic epithelial cell or a WT 37°C-infected M cell. 40 WT 37°C-infected M cells were analyzed. Horizontal line indicates limit of detection. (k) TEER was measured before and after infection and plotted as % decrease. Statistics were performed with a one-way ANOVA and Tukey’s post hoc multiple comparison tests. (j-k) Data were pooled from 3–4 independent experiments
Figure 6.
Figure 6.
YopE causes M cell extrusion. (a-h) Differentiated HIE25 RT+ ileal monolayers were infected for 5 hours with 5 × 106 CFU of (a) WT 37°C, (b) ΔyopO, (c) ΔyopH, (d) ΔyopE, (e) ΔyopE+yopErec, (f) ΔyopE+yopER144A, (g) ΔyopE+YopE1-100SptP166-293 or (h) ΔyopE+yopEL109A YPIII Yptb expressing GFP (green). Monolayers were stained with DAPI (nuclei-blue) and phalloidin (F-actin-cyan). Orthogonal XZ planes were analyzed for M cell extrusion. (i) The percentage of extruding infected M cells per field was plotted. Each point represents one Transwell. Bars indicate mean and SEM. Statistics were performed with a one-way ANOVA and Tukey’s post hoc multiple comparison tests. (j) The number of Yptb internalized in each M cell was determined and the percentage of cells with specified number of internalized Yptb per field was plotted. Error bars indicate SEM. The data for WT 37°C and ΔyopE are the same as in Figure 4 k. Statistics were performed using a two-way ANOVA and Tukey’s post hoc multiple comparison tests and are shown in Table S4. (i-j) Data were pooled from 3+ independent experiments with 2–4 fields analyzed per Transwell and averaged
Figure 7.
Figure 7.
M cells infected with WT 26°C have reduced ability to be reinfected by WT 37°C. (a-d) Differentiated HIE25 RT+ ileal monolayers were (a) mock infected with noninfectious media, washed, and infected for 2.5 hours with 5 × 106 CFU of WT 37°C expressing mCherry (red), or (b) infected for 2.5 hours with 5 × 106 CFU of WT 26°C expressing GFP (green), washed, and infected for 2.5 hours with 5 × 106 CFU of WT 26°C expressing mCherry (red), or (c) infected for 2.5 hours with 5 × 106 CFU of WT 26°C expressing GFP (green), washed, and infected for 2.5 hours with 5 × 106 CFU of WT 37°C expressing mCherry (red). Monolayers were stained with DAPI (nuclei-blue). XY planes are maximum intensity projections. Magnified insets of an M cell are shown in upper left corner. (d) The number of mCherry Yptb per cell were counted using Volocity software. Each point represents an infected M cell. Bars indicate mean and SD. Data were pooled from 3 independent experiments with 3 fields analyzed per Transwell and averaged. Statistics were performed using a one-way ANOVA and Tukey’s post hoc multiple comparison tests

References

    1. Mabbott NA, Donaldson DS, Ohno H, Williams IR, Mahajan A.. Microfold (M) cells: important immunosurveillance posts in the intestinal epithelium. Mucosal Immunol. Jul 2013;6(4):666–22. doi:10.1038/mi.2013.30. - DOI - PMC - PubMed
    1. Clark MA, Hirst BH, Jepson MA. M-cell surface beta1 integrin expression and invasin-mediated targeting of yersinia pseudotuberculosis to mouse peyer’s patch M cells. Infect Immun. Mar 1998;66(3):1237–1243. doi:10.1128/IAI.66.3.1237-1243.1998. - DOI - PMC - PubMed
    1. Jensen VB, Harty JT, Jones BD. Interactions of the invasive pathogens salmonella typhimurium, listeria monocytogenes, and shigella flexneri with M cells and murine peyer’s patches. Infect Immun. Aug 1998;66(8):3758–3766. doi:10.1128/IAI.66.8.3758-3766.1998. - DOI - PMC - PubMed
    1. Dillon A, Lo DD. M cells: intelligent engineering of mucosal immune surveillance. Front Immunol. 2019;10:1499. doi:10.3389/fimmu.2019.01499. - DOI - PMC - PubMed
    1. Owen RL. Uptake and transport of intestinal macromolecules and microorganisms by M cells in peyer’s patches–a personal and historical perspective. Semin Immunol. Jun 1999;11(3):157–163. doi:10.1006/smim.1999.0171. - DOI - PubMed

Publication types

MeSH terms

LinkOut - more resources