. 2021 Dec;12(1):2946-2956.
doi: 10.1080/21505594.2021.2006960.

Emergent SARS-CoV-2 variants: comparative replication dynamics and high sensitivity to thapsigargin

Affiliations

Emergent SARS-CoV-2 variants: comparative replication dynamics and high sensitivity to thapsigargin

Sarah Al-Beltagi et al. Virulence. 2021 Dec.

Abstract

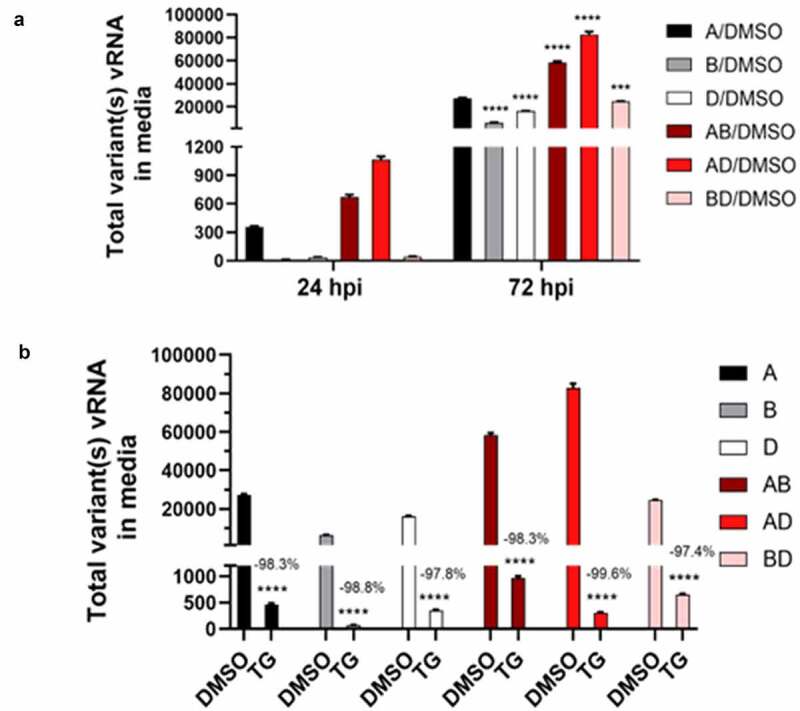
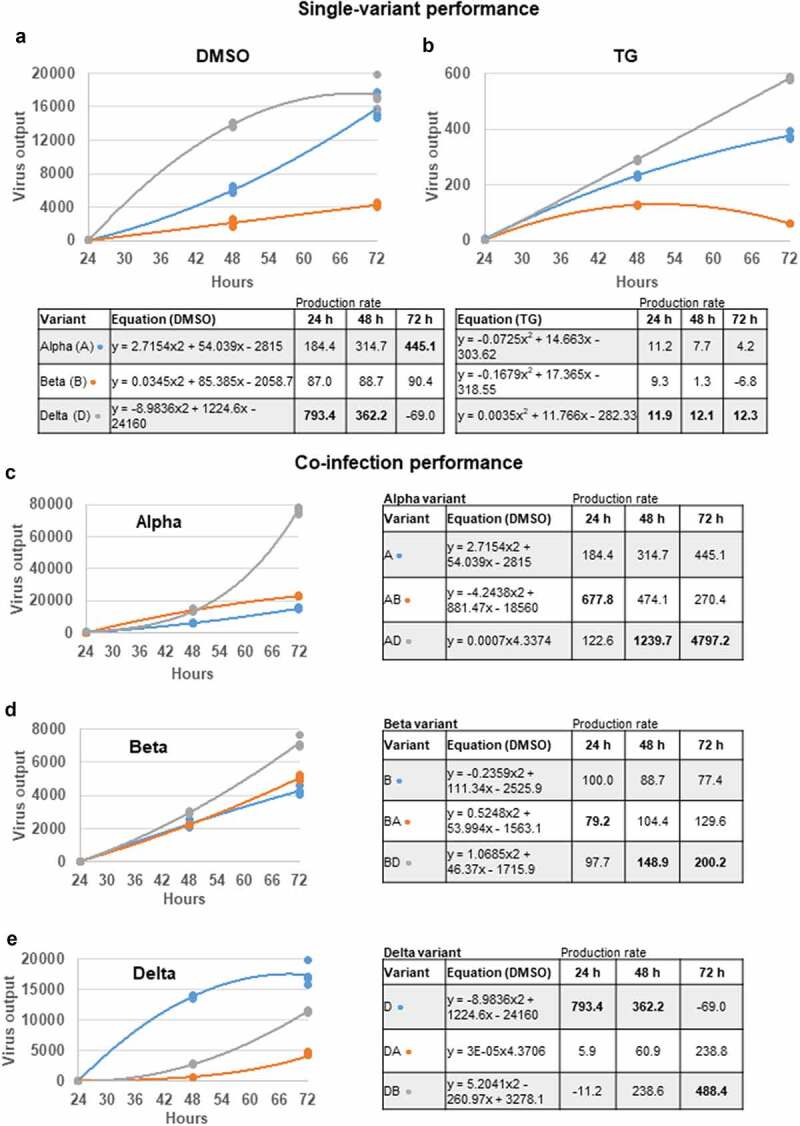
The struggle to control the COVID-19 pandemic is made challenging by the emergence of virulent SARS-CoV-2 variants. To gain insight into their replication dynamics, emergent Alpha (A), Beta (B) and Delta (D) SARS-CoV-2 variants were assessed for their infection performance in single variant- and co-infections. The effectiveness of thapsigargin (TG), a recently discovered broad-spectrum antiviral, against these variants was also examined. Of the 3 viruses, the D variant exhibited the highest replication rate and was most able to spread to in-contact cells; its replication rate at 24 h post-infection (hpi) based on progeny viral RNA production was over 4 times that of variant A and 9 times more than the B variant. In co-infections, the D variant boosted the replication of its co-infected partners at the expense of its own initial performance. Furthermore, co-infection with AD or AB combination conferred replication synergy where total progeny (RNA) output was greater than the sum of corresponding single-variant infections. All variants were highly sensitive to TG inhibition. A single pre-infection priming dose of TG effectively blocked all single-variant infections and every combination (AB, AD, BD variants) of co-infection at greater than 95% (relative to controls) at 72 hpi. Likewise, TG was effective in inhibiting each variant in active preexisting infection. In conclusion, against the current backdrop of the dominant D variant that could be further complicated by co-infection synergy with new variants, the growing list of viruses susceptible to TG, a promising host-centric antiviral, now includes a spectrum of contemporary SARS-CoV-2 viruses.

Keywords: Alpha; Beta; Delta; SARS-CoV-2; antiviral; co-infection; emergent variants; replication synergy; syncytia; thapsigargin.


Conflict of interest statement

No potential conflict of interest was reported by the author(s).

Figures

Figure 1.
Figure 1.
Replication synergy in co-infection of SARS-CoV-2 variants and high antiviral potency of TG against all variants. Confluent cells were primed with 0.5 µM TG or DMSO control for 30 min, washed twice with PBS, and infected with A variant, B variant, and D variant at 0.1 MOI in single virus infections (A, B and D) and in co-infections (AB, AD, and BD) for 1.5 h, washed twice with PBS and incubated in infection media. Notably, co-infected cells received the same amount of each virus as used in single virus infection. At 24 (panel a) and 72 hpi (panel a and b), total viral RNA from media was subjected to one-step reverse transcription qPCR, using primer set (1, 2) specific to all 3 variants, to quantify viral spike glycoprotein RNA by relative Ct method. Synergy in progeny production was evident in AB and AD co-infections where total virus RNA detected was greater than the sum of corresponding single-virus infection RNA evident at 24 and 72 hpi (panel a). Indicated significance relative to corresponding A/DMSO control based on 2-way ANOVA with Tukey’s multiple comparisons. Replication of all single virus- and co-infections was effectively blocked for at least 3 days by single pre-infection priming of TG. In AD co-infection, the most prolific infection group, combined viral RNA from TG-primed cells fell by 99.6% relative to corresponding DMSO control (panel b). Indicated significance relative to corresponding DMSO control based on 2-way ANOVA with Sidak’s multiple comparisons. Data shown are representative of three independent experiments and performed in quadruplicates
Figure 2.
Figure 2.
Replication comparisons of each variant in single virus- and co-infections. Confluent Calu-3 cells were primed with 0.5 µM TG or DMSO control for 30 min, washed twice with PBS, and infected with A variant, B variant, and D variant at 0.1 MOI in single variant infections (A, B and D) and in co-infections (AB, AD, and BD) for 1.5 h, washed twice with PBS and incubated in infection media. Co-infected cells received the same amount of each virus as in single variant infection. At 24, 48 and 72 hpi, viral RNA from media was subjected to one-step reverse transcription qPCR with variant-specific primers that can discriminate between variants in co-infected samples to detect relative spike glycoprotein gene expression. All single variant- and co-infections were blocked for at least 3 days by single pre-infection priming of TG (panels a to c). Production of A variant vRNA in AB and AD co-infections at 72 hpi was clearly enhanced (relative to single-virus A variant infection) (panel a). Production of B variant vRNA in BA and BD co-infections at 72 hpi was also enhanced (panel b). However, production of D variant vRNA in DA and DB co-infections at 72 hpi was attenuated relative to single-variant D variant infection; reduction of the D variant vRNA in DA was more than 2 times that in DB co-infection (panel c). Unless otherwise indicated significance relative to corresponding DMSO control based on 2-way ANOVA with Tukey’s multiple comparisons; % reduction is relative to corresponding DMSO group. Data shown are representative of three independent experiments and performed in quadruplicates
Figure 3.
Figure 3.
Comparative vRNA production of emergent SARS-CoV-2 variants. Confluent Calu-3 cells were primed with 0.5 µM TG or DMSO control for 30 min, washed twice with PBS, and separately infected with A variant, B variant, and D variant at 0.1 MOI in for 1.5 h, washed twice with PBS and incubated in infection media. At 24, 48 and 72 hpi, viral RNA from media was subjected to one-step reverse transcription qPCR with variant-specific primer sets to detect relative spike glycoprotein RNA of each variant. Increase of virus output of each variant was determined between the periods of 24 to 48 hpi, and 24 to 72 hpi. Relative rates of progeny virus production of variants are such that D > A > B (panel a). Relative increase in virus output under TG inhibition (panel b) followed the same pattern as DMSO controls but was drastically reduced. Indicated significance of D is relative to B and A variants of each corresponding interval period based on 2-way ANOVA with Tukey’s multiple comparisons. Data shown are representative of three independent experiments and performed in quadruplicates
Figure 4.
Figure 4.
Replication rates of A, B and D variants in single variant- and co-infections. Data points, from earlier viral supernatant results of spike glycoprotein gene expression in single virus- and co-infections at 24, 48 and 72 hpi (Figure 2), were used to generate indicated growth curves and equations to determine the rate of viral RNA production (gradient) at a given time point. The D variant in single-variant infection, until saturation at 72 hpi, had the highest rate of viral RNA production relative to A and B variants in DMSO control (panel a) and TG-primed (panel b) Calu-3 cells. In co-infections, the D variant boosted the production rate of A and B variants (panel c and d) but at the expense of its initial performance (panel e). Negative values in production rate are likely due to virus saturation from limited cell number and even virus breakdown in media (panel a), or low initial virus growth (panel e). Data shown are representative of three independent experiments
Figure 5.
Figure 5.
Single-Delta variant infection exhibited the highest ability of cell-to-cell spread in 18 hpi focus forming assays (FFAs). Confluent Calu-3 cells were primed with 0.5 µM TG or DMSO control for 30 min, washed with PBS and infected with single variants, or combined variants in co-infections. Co-infected cells received the same amount of each virus (0.1 MOI) as in single variant infection. At 72 hpi, spun supernatants were harvested for FFAs on Vero E6 cells which were infected for 18 h followed by immunodetection of viral spike protein-positive cells to determine number of infected cells per unit volume of infecting supernatant (panel a). Despite the single Delta variant group had less starting seed virus than most other groups in the 72 hpi supernatants, after 18 h of culture in Vero E6 cells, the Delta variant produced the most number of virus positive cells per unit volume, in both DMSO and TG-primed series, indicating that it had the most rapid cell-to-cell virus spread. Indicated % reduction is relative to corresponding DMSO control (panel a). Indicated significance is relative to corresponding D variant based on 2-way ANOVA with Sidak’s multiple comparisons. Percentage of infected cells arranged in clusters of 2 or more cells indicated that the D variant was most able to form infected clusters, closely followed by mixed variants from BD co-infected (non-synergistic) cells (panel b). Indicated significance is relative to corresponding D variant based on 2-way ANOVA with Tukey’s multiple comparisons. Data shown are representative of three independent experiments. Representative FFA photomicrographs (derived from supernatants of TG-primed Calu-3 cells) show the D variant formed the largest number of clusters with 5 or more infected cells out of the three variants (panel c). Bar = 150 µM
Figure 6.
Figure 6.
TG was effective in inhibiting emergent SARS-CoV-2 variants in pre-infected Calu-3 cells. Confluent cells were separately infected with SARS-CoV-2 variants at about 0.2 MOI for 2 h followed by three washes with PBS and incubated in fresh infection media. At 24 hpi, cultured media were removed and kept for re-seeding back to the same wells. Infected cells were then primed with 0.5 µM TG or DMSO control for 30 min, washed twice with PBS and the retained media were put back to the corresponding wells. At 48 and 72 hpi (i.e. at 24 h and 48 h post-priming with TG/DMSO respectively), viral RNA was extracted from spun supernatants for one-step reverse transcription qPCR to detect relative abundance of viral RNA that codes for spike glycoprotein (using primers 1 and 2). Notably, TG was able to inhibit preexisting active infection to great effect with a single 30 min exposure dose. Indicated significance relative to corresponding DMSO control based on 2-way ANOVA with Tukey’s multiple comparisons. Indicated % refers to reduction in viral detection relative to corresponding DMSO control
Figure 7.
Figure 7.
TG reduced vRNA synthesis and progeny production of Beta variant of SARS-CoV-2 in Calu-3 cells. Confluent cells were primed with 0.5 µM TG or DMSO control for 30 min, washed twice with PBS and infected with the B variant at 0.05 MOI in infection media for 3 h followed by three washes with PBS and incubated in fresh infection media. At indicated hpi, total cellular RNA was extracted (panel a); progeny virus in media was subjected to focus forming assay (FFA) (panel b) and viral RNA extraction (panel c). Total RNA was converted to cDNA for qPCR of SARS-CoV-2, normalized to 18s rRNA (panel a). FFA was based on the quantification of virus-positive Vero E6 cells at 18 hpi by immunochemical detection of viral spike glycoprotein (error bars = SEM; ns = not significant between time points) (panel b). Viral RNA from media was subjected to one-step reverse transcription qPCR to detect relative copy number of SARS-CoV-2, based on relative Ct method (panel c). Notably, despite increasing viral RNA accumulation in media of infected cells with time (panel c), viral gene expression (panel a) and infectious progeny virus (panel b) were in relative decline by 72 hpi. Indicated significance relative to corresponding DMSO control based on 2-way ANOVA with Sidak’s multiple comparisons. Indicated % refers to reduction in viral detection relative to corresponding DMSO control

References

    1. Planas D, Veyer D, Baidaliuk A, et al. Reduced sensitivity of SARS-CoV-2 variant Delta to antibody neutralization. Nature. 2021;596(7871):276–280. - PubMed
    1. Khateeb J, Li Y, Zhang H.. Emerging SARS-CoV-2 variants of concern and potential intervention approaches. Crit Care. 2021;25(1):244. - PMC - PubMed
    1. Scudellari M. How the coronavirus infects cells — and why Delta is so dangerous. Nature. 2021;595(7869):640–644. - PubMed
    1. Konno Y, Kimura I, Uriu K, et al. SARS-CoV-2 ORF3b is a potent interferon antagonist whose activity is increased by a naturally occurring elongation variant. Cell Rep. 2020;32(12):108185. - PMC - PubMed
    1. Thorne LG, Bouhaddou M, Reuschl AK, et al. Evolution of enhanced innate immune evasion by the SARS-CoV-2 B.1.1.7 UK variant. bioRxiv. 2021. DOI:10.1101/2021.06.06.446826 - DOI

Publication types

Supplementary concepts