. 2021 Jan-Dec;13(1):1993582.
doi: 10.1080/19490976.2021.1993582.

Inulin-grown Faecalibacterium prausnitzii cross-feeds fructose to the human intestinal epithelium

Affiliations

Inulin-grown Faecalibacterium prausnitzii cross-feeds fructose to the human intestinal epithelium

Raphael R Fagundes et al. Gut Microbes. 2021 Jan-Dec.

Abstract

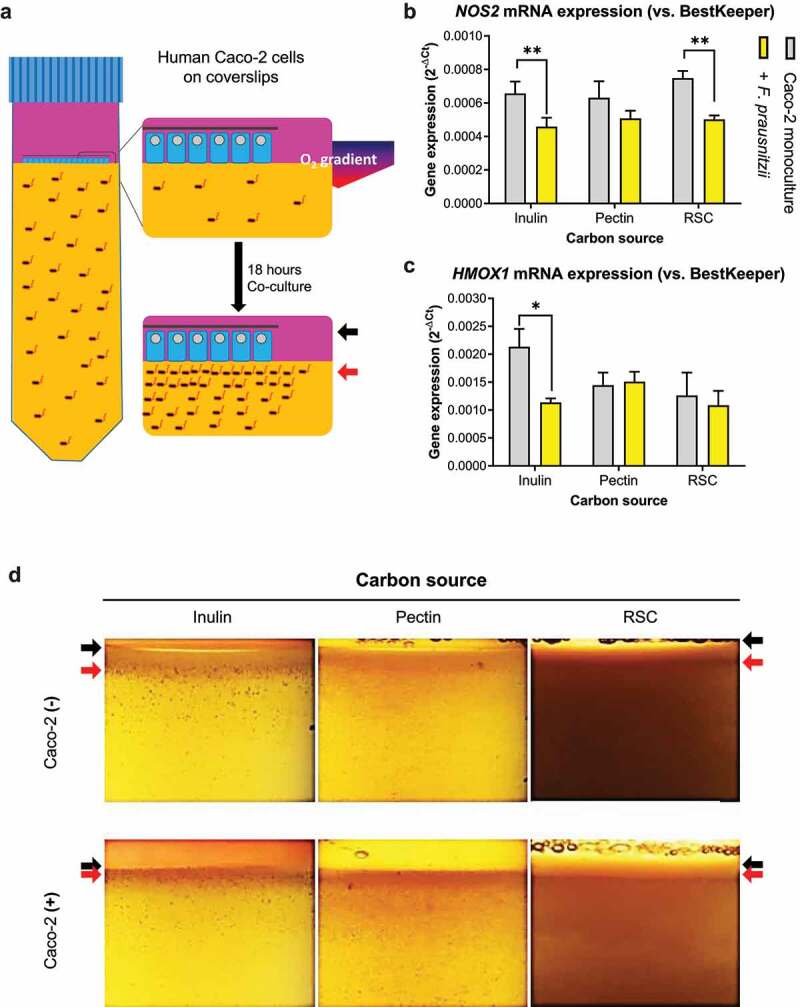
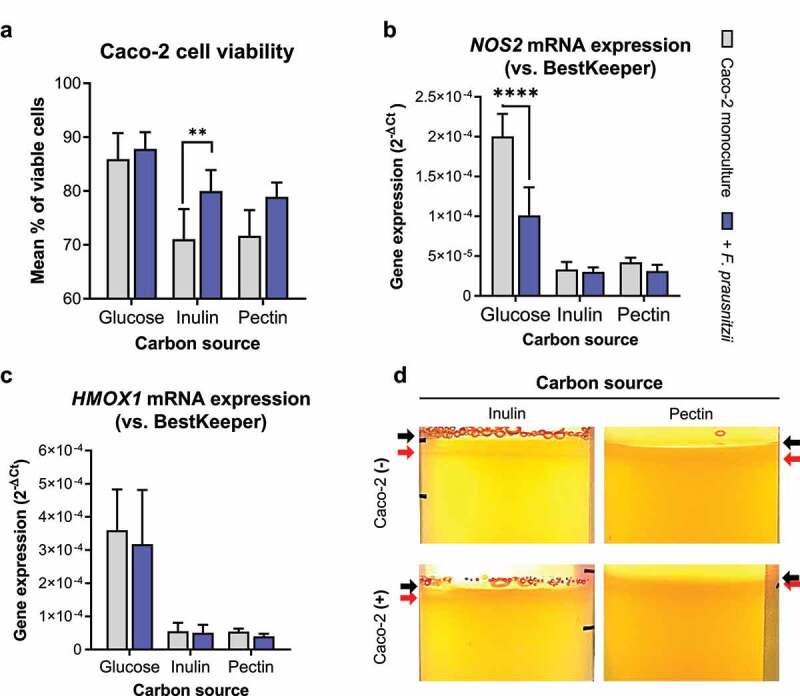
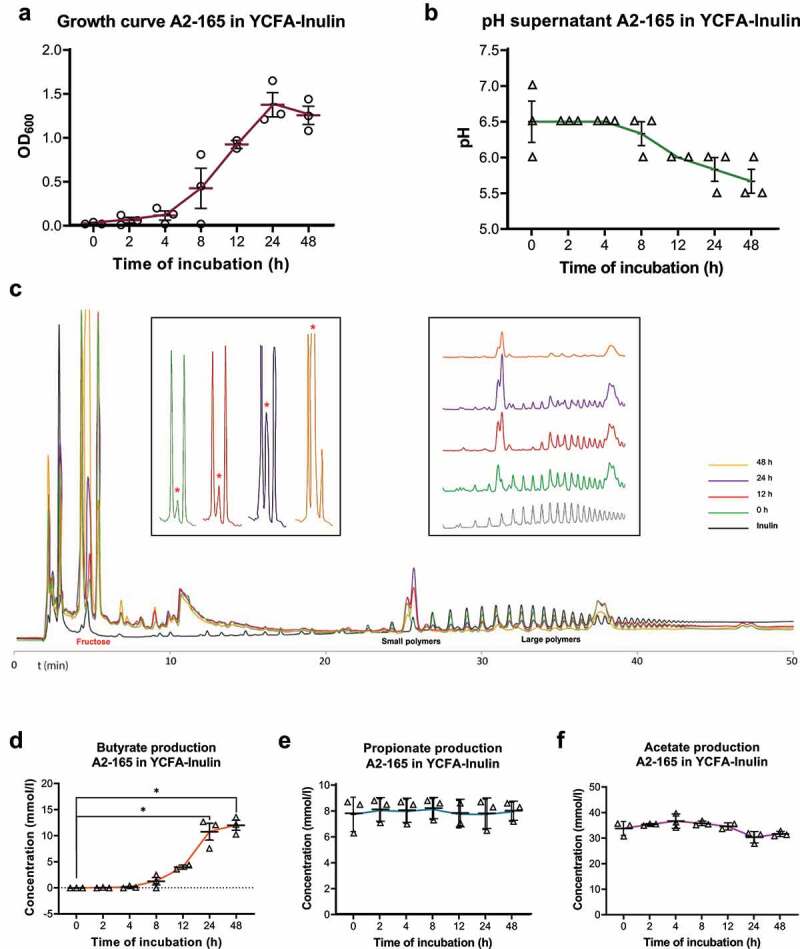
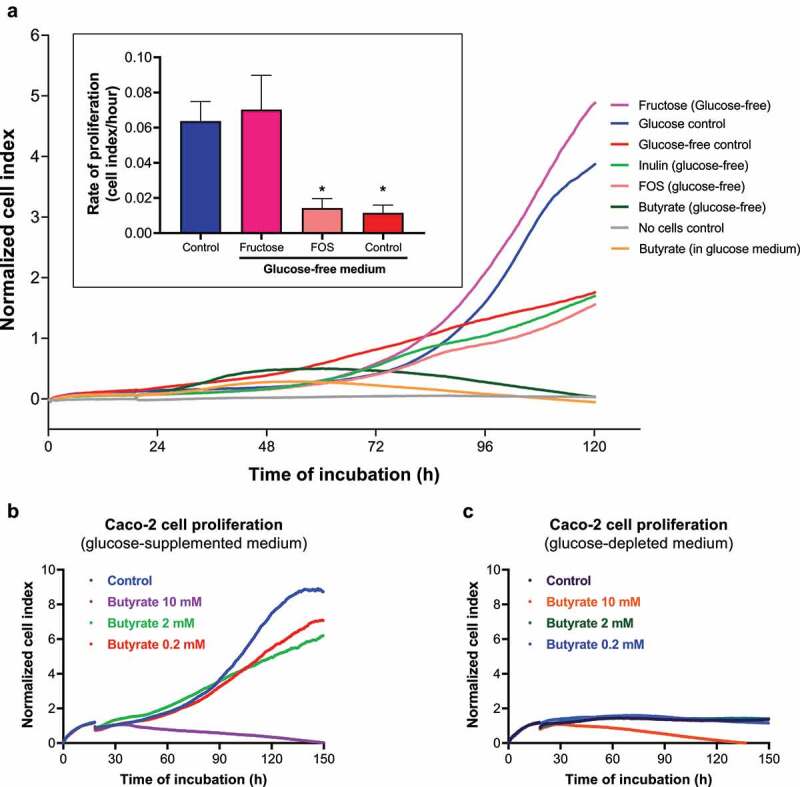
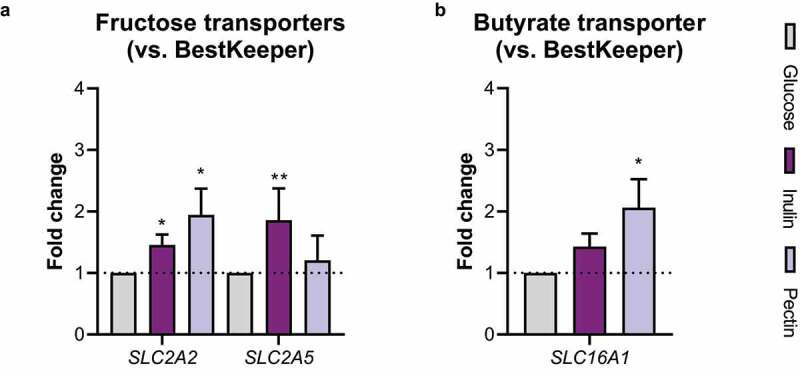
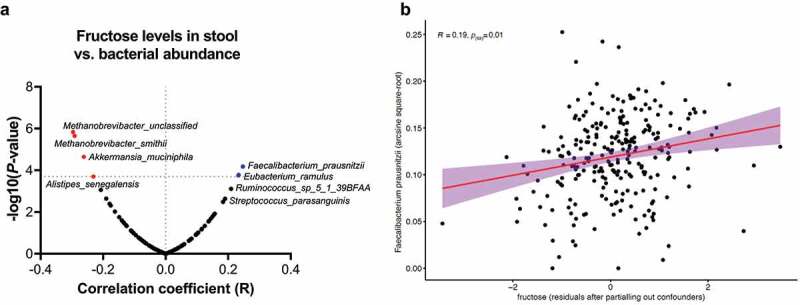
Many chronic diseases are associated with decreased abundance of the gut commensal Faecalibacterium prausnitzii. This strict anaerobe can grow on dietary fibers, e.g., prebiotics, and produce high levels of butyrate, often associated to epithelial metabolism and health. However, little is known about other F. prausnitzii metabolites that may affect the colonic epithelium. Here, we analyzed prebiotic cross-feeding between F. prausnitzii and intestinal epithelial (Caco-2) cells in a "Human-oxygen Bacteria-anaerobic" coculture system. Inulin-grown F. prausnitzii enhanced Caco-2 viability and suppressed inflammation- and oxidative stress-marker expression. Inulin-grown F. prausnitzii produced excess butyrate and fructose, but only fructose efficiently promoted Caco-2 growth. Finally, fecal microbial taxonomy analysis (16S sequencing) from healthy volunteers (n = 255) showed the strongest positive correlation for F. prausnitzii abundance and stool fructose levels. We show that fructose, produced and accumulated in a fiber-rich colonic environment, supports colonic epithelium growth, while butyrate does not.

Keywords: Faecalibacterium; Gut bacteria; dysbiosis; fructose; intestinal epithelium; inulin.


Conflict of interest statement

RKW acted as consultant for Takeda and received unrestricted research grants from Takeda. RKW received unrestricted research grants from Johnson & Johnson Pharmaceuticals, Tramedico and Ferring, and received speaker fees from AbbVie, MSD, Olympus and AstraZeneca. GD received research grant from Royal DSM and speaker’s fees from Janssen Pharmaceuticals, Pfizer and Abbvie. All other authors have no conflicts of interest to declare.

Figures

Figure 1.
Figure 1.
Metabolism of prebiotics by F. prausnitzii decreases inflammatory markers in Caco-2 cells. (a) Schematic representation of the HoxBan system, showing the oxic-anoxic interphase created between the Caco-2 monolayer (in human compartment, pink colored) and bacterial compartment (yellow color, representing the YCFA medium). The zoom schematically shows rim formation after 18-hour co-culture, where black arrows indicate the coverslip and red arrows indicate bacterial rim localization. (b-c) Effect of different prebiotic carbon sources on F. prausnitzii-regulated expression of NOS2 (inflammation marker, B) and HMOX1 (oxidative stress marker, C) in Caco-2 cells. Especially inulin-grown F. prausnitzii suppresses NOS2 and HMOX1 expression. (d) Prebiotic-grown F. prausnitzii in the absence and presence of Caco-2 cells. In the absence of Caco-2 cells (top panels), F. prausnitzii growth is enhanced (red arrow) in the upper part of the bacterial compartment forming a rim below the oxic-anoxic interphase (black arrow). In the presence of Caco-2 cells (bottom panels), F. prausnitzii growth is further enhanced (red arrow) and colonies appear closer to the oxic-anoxic interphase where the Caco-2 cells reside (black arrow). All experiments were performed with two biological replicates, each with an N = 3. *P < .05; **P < .01
Figure 2.
Figure 2.
F. prausnitzii grown on inulin improves Caco-2 cell viability when cocultured in the complete absence of glucose. (a) Caco-2 cell viability after 18 h coculture without (gray bars) or with (blue bars) F. prausnitzii in the HoxBan system containing glucose, inulin or pectin as sole carbon and energy source. (b, c) Corresponding mRNA levels of NOS2 (b) and HMOX1 (c) in the F. prausnitzii-Caco-2 coculture shown in A. Basal levels of NOS2 and HMOX1 are reduced in Caco-2-F. prausnitzii cocultures on inulin and pectin when compared to glucose, with no significant additional effect of the presence of F. prausnitzii. (d) In the complete absence of glucose, inulin- or pectin-grown F. prausnitzii forms a growth rim in the upper part of the bacterial compartment (red arrows), which is closer to the coverslip (black arrows) containing Caco-2 cells (bottom panels) compared to empty coverslips (top panels). All experiments were performed with two biological replicates, each with an N = 3 (inulin) and 2 (pectin). **P < .01; ****P < .0001
Figure 3.
Figure 3.
F. prausnitzii produces excess fructose and butyrate from inulin. F. prausnitzii was grown in bacterial broth containing inulin as sole sugar source and analyzed for (a) bacterial growth, (b) medium acidification, (c) inulin metabolism and fructose production, as well as the production of the short-chain fatty acids (SCFAs) butyrate (d), propionate (e) and acetate (f). Time-dependent growth of F. prausnitzii is associated with medium acidification, decrease in inulin (large polymers in C) and increase in fructose (asterisks in inset in C) and butyrate (D). Note that fructose levels increase particularly when F. prausnitzii is in the stationary growth phase (24–48 h), while butyrate levels increase most during the exponential growth phase (12–24 h). Propionate and acetate are endogenous components of the bacterial broth (at 8 and 30 mM, respectively) and their concentrations do not significantly change during F. prausnitzii growth on inulin. All experiments were performed with two biological replicates, each with an N = 3. *P < .05
Figure 4.
Figure 4.
Caco-2 cells grow on fructose, but not on butyrate or inulin. (a) Caco-2 cells were cultured in a real-time cell analyzer (RTCA, xCELLigence) to monitor cell growth on different carbon/energy sources, e.g., glucose (as positive control, dark blue line), fructose (pink line), butyrate (dark green), inulin (light green) or fructose-oligosaccharide (FOS, rose line) and compared to cell cultured in the absence of a carbon and energy source (bright red line). The inset in A shows the maximum growth rate (in Δcell index/h) of Caco-2 cells on glucose (blue bar), fructose (purple bar) and FOS (rose bar) when compared to the no added carbon source (red bar). Caco-2 cells grow at a similar pace on glucose and fructose. In contrast, butyrate causes only an initial small increase in cell index (green line between 24–48 h), after which the cell index goes down, suggesting cell death. In fact, butyrate blocks growth of Caco-2 on glucose (Orange line). Butyrate decreases Caco-2 cell proliferation in a dose-dependent manner both in (b) glucose-supplemented and (c) glucose-depleted media. All experiments were performed with two biological replicates, each with an N = 3 (glucose and inulin) and 2 (pectin). *P < .05
Figure 5.
Figure 5.
Inulin-grown F. prausnitzii increases expression of fructose transporters in Caco-2 cells. Caco-2 cells were cocultured with F. prausnitzii in the HoxBan system containing either glucose, inulin or pectin as sole carbon and energy source and analyzed for gene expression of A) the fructose transporters SLC2A2 and SLC2A5 (encoding GLUT2 and GLUT5 respectively) and B) the butyrate transporter SLC16A1 (encoding MCT1). Inulin-grown F. prausnitzii significantly induced gene expression of both fructose transporters. All experiments were performed with two biological replicates, each with an N = 3. *P < .05; **P < .01
Figure 6.
Figure 6.
Fecal fructose levels positively correlate with F. prausnitzii abundance. (a) Volcano plot showing bacterial species whose relative abundance correlates significantly with fecal fructose levels in a population cohort (n = 255). Transformed F. prausnitzii levels most strongly correlate positively with fecal fructose levels (R = 0.19, p(fdr) = 0.01; B), while A. muciniphila is amongst species that show a significant negative correlation with fecal fructose

References

    1. Ananthakrishnan AN. Epidemiology and risk factors for IBD. Nat Rev Gastroenterol Hepatol. Internet] 2015. [cited 2016 Nov 3]; 12:205–18. Available from(4)http://www.nature.com/doifinder/10.1038/nrgastro.2015.34 - DOI - PubMed
    1. Eckburg PB. Diversity of the human intestinal microbial flora. Science. Internet] 2005. [cited 2018 Apr 23]; 308(5728):1635–1638. Available from http://www.sciencemag.org/cgi/doi/10.1126/science.1110591 - DOI - PMC - PubMed
    1. Lozupone CA, Stombaugh JI, Gordon JI, Jansson JK, Knight R. Diversity, stability and resilience of the human gut microbiota. Nature. 2012;489(7415):220–230. Internet] Available from. doi: 10.1038/nature11550. - DOI - PMC - PubMed
    1. Schippa S, Conte M. Dysbiotic events in gut microbiota: impact on human health. Nutrients. 2014;6(12):5786–5805. Internet] Available from. doi: 10.3390/nu6125786. - DOI - PMC - PubMed
    1. Kostic AD, Xavier RJ, Gevers D. The microbiome in inflammatory bowel disease: current status and the future ahead. Gastroenterology. 2014;146(6):1489–1499. Internet] Available from. doi: 10.1053/j.gastro.2014.02.009. - DOI - PMC - PubMed

Publication types

MeSH terms

LinkOut - more resources