. 2022 Feb 1;132(3):e147191.
doi: 10.1172/JCI147191.

KLF2 regulates neutrophil activation and thrombosis in cardiac hypertrophy and heart failure progression

Affiliations

KLF2 regulates neutrophil activation and thrombosis in cardiac hypertrophy and heart failure progression

Xinmiao Tang et al. J Clin Invest. .

Abstract

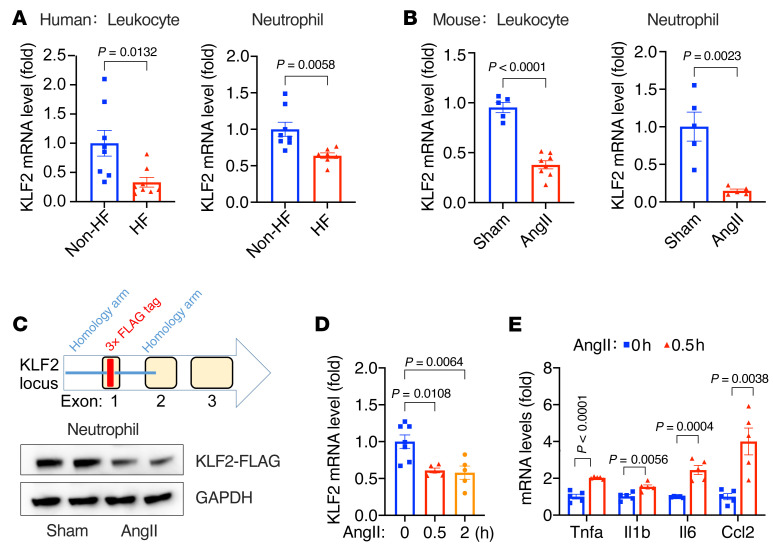
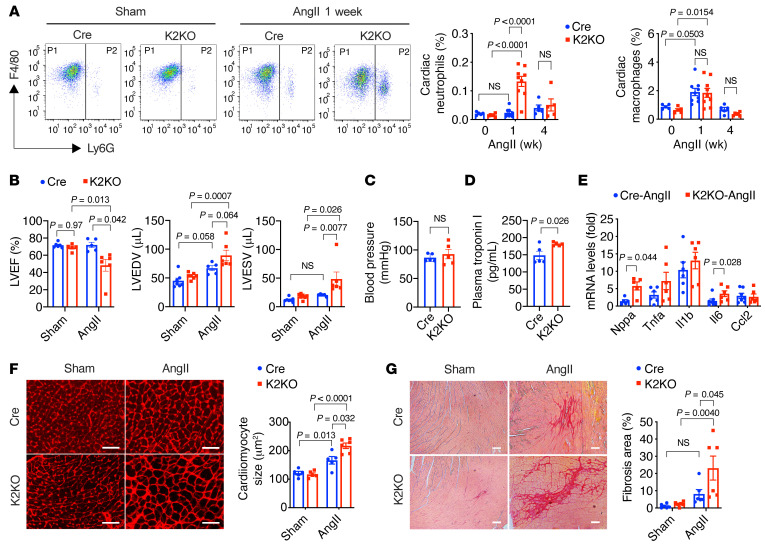
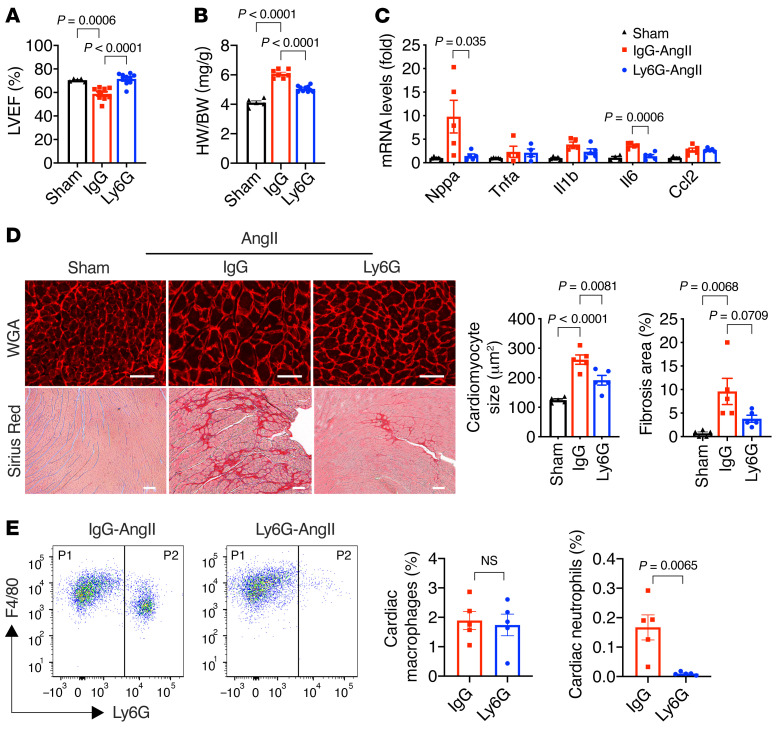
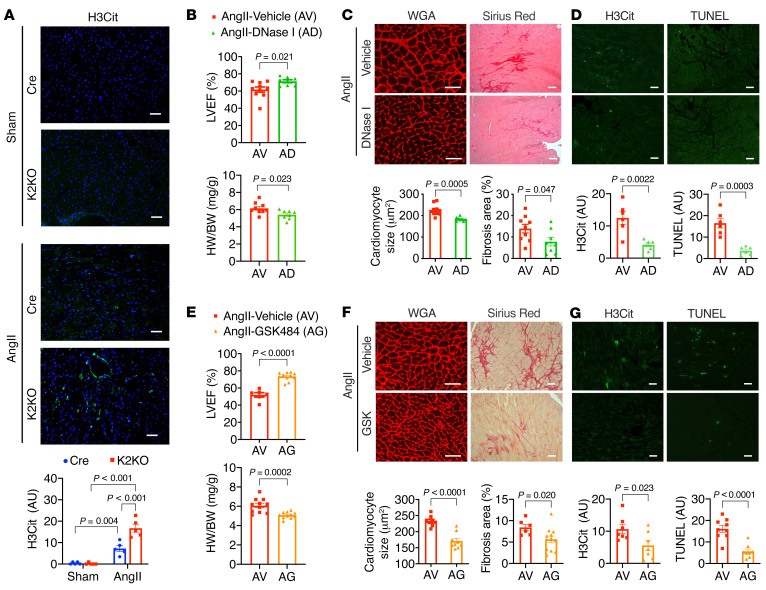
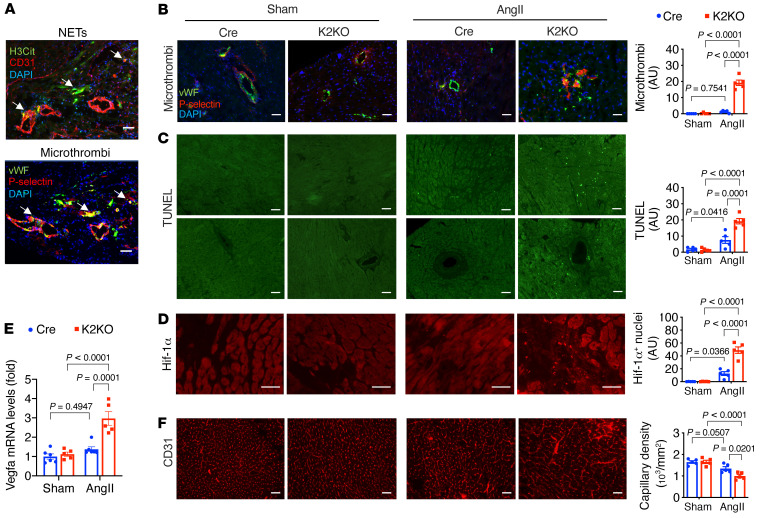
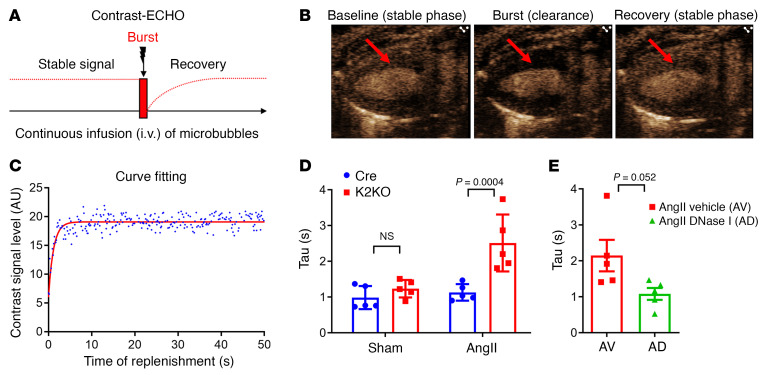
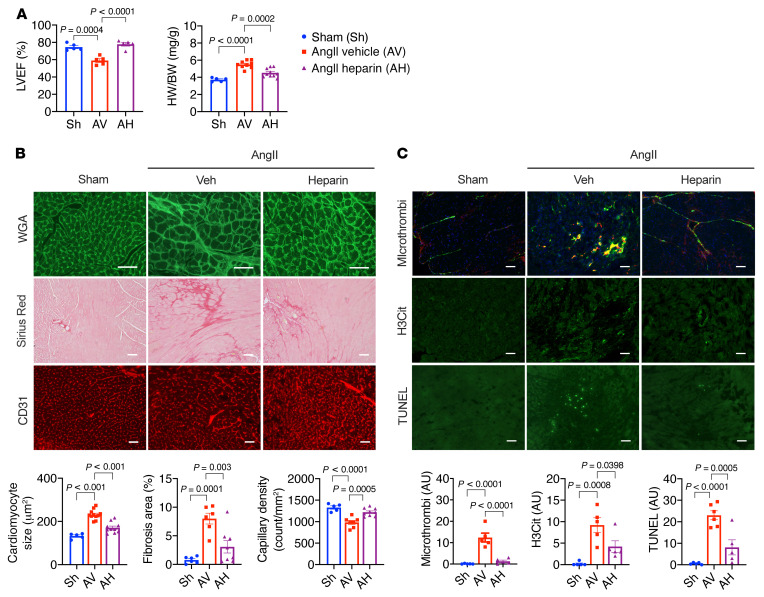
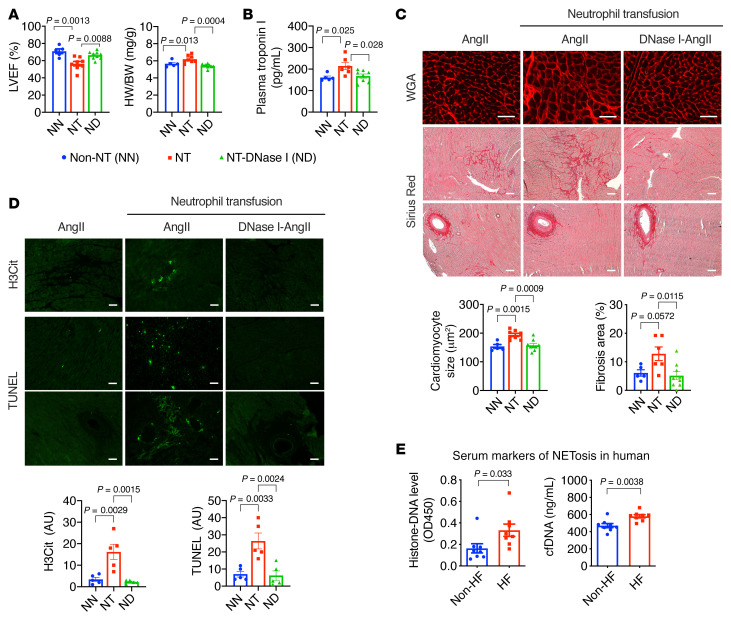
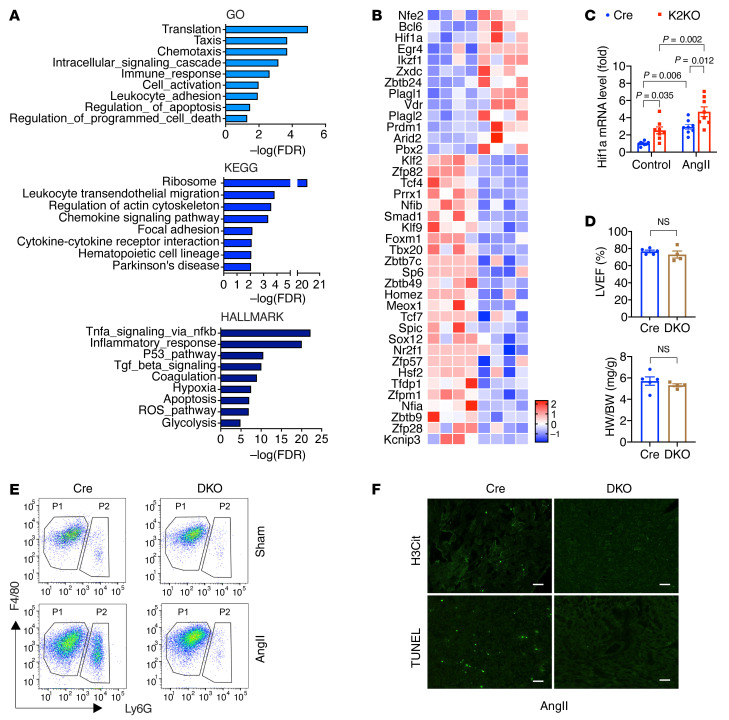
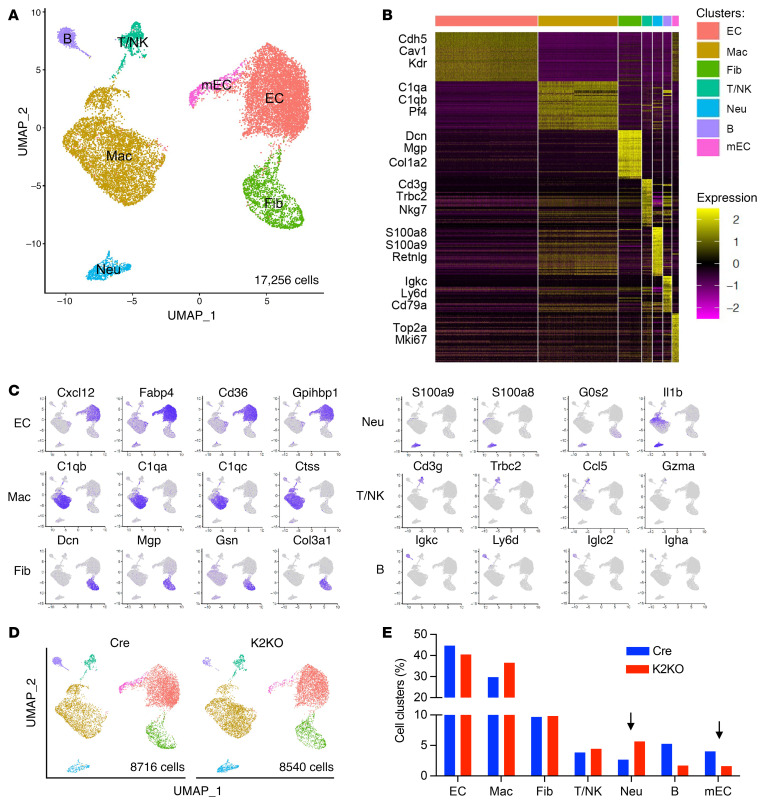
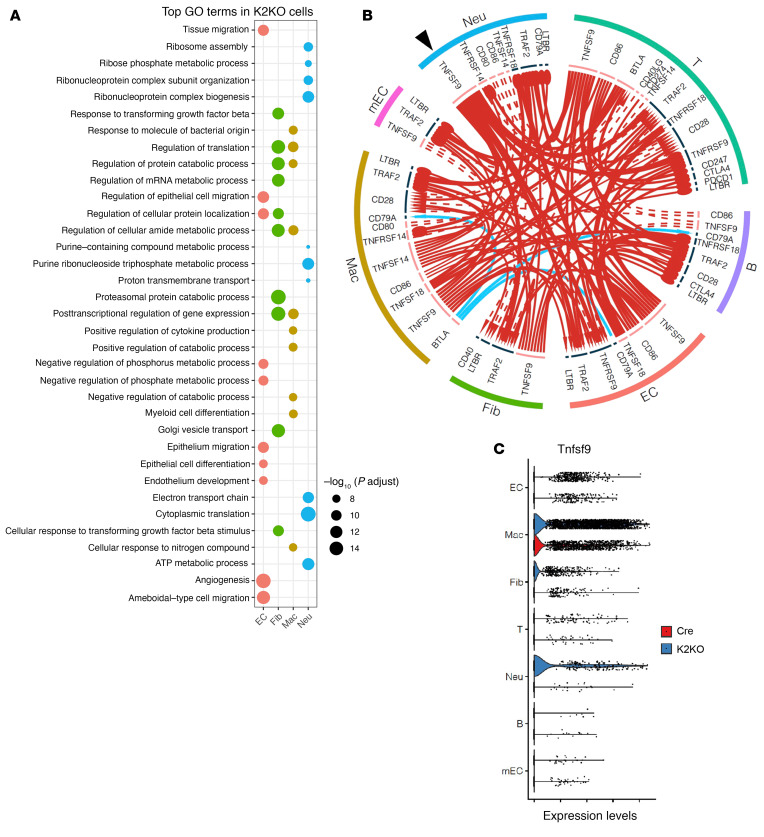
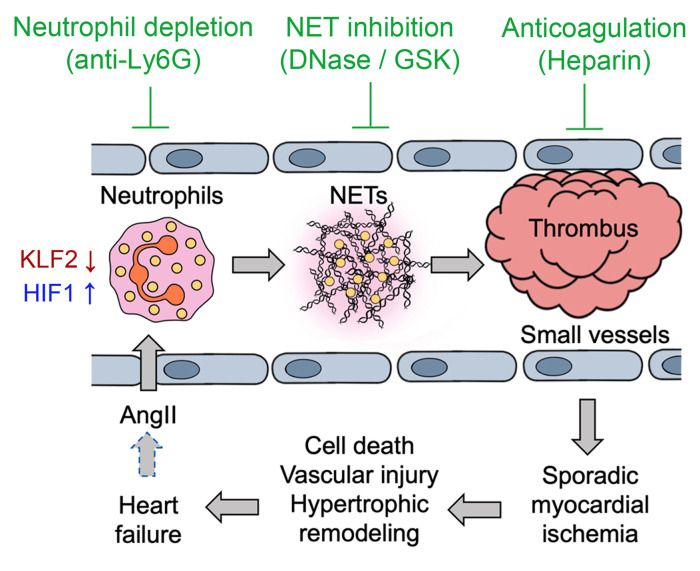
It is widely recognized that inflammation plays a critical role in cardiac hypertrophy and heart failure. However, clinical trials targeting cytokines have shown equivocal effects, indicating the need for a deeper understanding of the precise role of inflammation and inflammatory cells in heart failure. Leukocytes from human subjects and a rodent model of heart failure were characterized by a marked reduction in expression of Klf2 mRNA. Using a mouse model of angiotensin II-induced nonischemic cardiac dysfunction, we showed that neutrophils played an essential role in the pathogenesis and progression of heart failure. Mechanistically, chronic angiotensin II infusion activated a neutrophil KLF2/NETosis pathway that triggered sporadic thrombosis in small myocardial vessels, leading to myocardial hypoxia, cell death, and hypertrophy. Conversely, targeting neutrophils, neutrophil extracellular traps (NETs), or thrombosis ameliorated these pathological changes and preserved cardiac dysfunction. KLF2 regulated neutrophil activation in response to angiotensin II at the molecular level, partly through crosstalk with HIF1 signaling. Taken together, our data implicate neutrophil-mediated immunothrombotic dysregulation as a critical pathogenic mechanism leading to cardiac hypertrophy and heart failure. This neutrophil KLF2-NETosis-thrombosis mechanism underlying chronic heart failure can be exploited for therapeutic gain by therapies targeting neutrophils, NETosis, or thrombosis.

Keywords: Cardiology; Cardiovascular disease; Inflammation; Neutrophils; Transcription.


Conflict of interest statement

Conflict of interest: The authors have declared that no conflict of interest exists.

Figures

Figure 1
Figure 1. Heart failure is associated with reduced KLF2 expression in circulating leukocytes and neutrophils.
(A) Klf2 mRNA expression in human peripheral blood leukocytes (n = 8) and neutrophils (n = 7–8). HF, patients with heart failure (n = 15); non-HF, age-matched patients without heart failure (n = 16). (B) Klf2 mRNA expression in peripheral blood leukocytes and neutrophils from WT mice with AngII (1.0 μg/kg/min) or PBS (sham) infusion (n = 5–8). (C) KLF2-tag mice were generated using the CRISPR/Cas9 method. Protein levels of 3×FLAG-KLF2 in blood neutrophils were detected by M2 anti-FLAG antibody (Sigma-Aldrich, F3165). Each lane represents 1 animal. (D and E) Mouse bone marrow–derived neutrophils treated with AngII (100 nmol/L) in vitro (n = 5–7). P values are from 2-tailed, unpaired Student’s t test (A, B, and E) or 1-way ANOVA with Tukey’s post hoc test (D).
Figure 2
Figure 2. Myeloid KLF2 deficiency enhances AngII-induced cardiac hypertrophy.
(A) FACS analysis of myeloid cells in the myocardium (n = 5–9). P1, CD45+CD11b+F4/80+Ly6G macrophages; P2, CD45+CD11b+Ly6G+ neutrophils. (B) Echocardiography assessments of mouse left ventricular (LV) functions after 4-week infusion (n = 5–6). LVEF, left ventricular ejection fraction; LVEDV, LV volume at end of diastole; LVESV, LV volume at end of systole. (C) Mean blood pressure measured from the right common carotid artery by invasive hemodynamics (n = 5). (D) Plasma levels of cardiac troponin (cTnT) after 1 week of AngII infusion (n = 5). (E) Expression of hypertrophy and inflammation genes in the heart (n = 6–7). (F) Cardiomyocyte cross-sectional area analysis by Alexa Fluor 594–conjugated wheat germ agglutinin (WGA) staining (n = 5–6). (G) Myocardial fibrosis analysis by Picrosirius red staining (n = 6). P values are from 2-way ANOVA with Tukey’s post hoc test (A, B, F, and G) or 2-tailed, unpaired Student’s t test (CE). NS, not significant (P > 0.5). Scale bars: 25 μm.
Figure 3
Figure 3. KLF2-deficient neutrophils are critical for AngII-induced cardiac hypertrophy.
(A) Cardiac function (n = 5–10). (B) Heart weight (HW) normalized to body weight (BW) (n = 5–7). (C) Myocardial gene expression (n = 4–5). (D) Cardiac hypertrophy (WGA staining) and fibrosis (Picrosirius red staining) after 4-week AngII infusion in K2KO mice (n = 5). AngII-treated mice were treated with anti-Ly6G antibody (Ly6G) or IgG control antibody (IgG). LVEF, left ventricular ejection fraction. Scale bars: 25 μm. (E) FACS analysis of macrophages and neutrophils in K2KO hearts after 1-week AngII infusion and antibody treatments with anti-IgG or anti-Ly6G (n = 5). P values are from 1-way ANOVA with Tukey’s post hoc test (AD) or 2-tailed, unpaired Student’s t test (E). NS, not significant.
Figure 4
Figure 4. Neutrophil extracellular traps (NETs) as a critical mediator of cardiac responses to AngII.
(A) Immunostaining of citrullinated histone H3 (H3Cit) from Cre and K2KO hearts (n = 5). (BD) DNase I administration (n = 6–10) and (EG) GSK-484 administration (n = 6–11) in AngII-infused K2KO mice. (B and E) LV function and heart weight. (C and F) Cardiac hypertrophy (WGA staining) and fibrosis (Picrosirius red staining). (D and G) Intracardiac NET formation (H3Cit immunofluorescence) and cell death (TUNEL immunofluorescence). AngII infusion: 1 week (A, D, and G) or 4 weeks (B, C, E, and F). P values are from 2-way ANOVA with Tukey’s correction (A) or 2-tailed, unpaired Student’s t test (BF). Scale bars: 25 μm.
Figure 5
Figure 5. AngII-induced NET formation triggers microthrombosis and myocardial injury.
(A and B) Immunostaining of H3Cit, vWF, P-selectin, and CD31. (C) TUNEL staining to assess cell death. Upper: Intramuscular regions. Lower: Perivascular regions. (D) Immunostaining of HIF1α protein. HIF1α-positive nuclei were counted. (E) Myocardial expression of Vegfa mRNA. (F) Myocardial capillary density assessed by CD31 immunostaining. AngII infusion: 1 week (AD) or 4 weeks (E and F). P values are from 2-way ANOVA with Tukey’s correction (BF). Representative images from 5 to 6 mice in each group. Scale bars: 25 μm.
Figure 6
Figure 6. AngII infusion impairs microcirculation in the K2KO myocardium.
(A) The experimental design of contrast-ECHO showing 3 phases of the contrast signal: basal stable level, clearance by a burst of high-energy ultrasound beam, and recovery. The rate of contrast signal recovery is correlated with the microcirculatory blood flow rate. (B) Representative contrast-ECHO images showing baseline, burst, and complete recovery phases. Arrows indicate LV wall. (C) Representative data analysis showing cure fitting of a 1-phase exponential decay curve. The recovery rate (blood flow rate) can be estimated by time constant (Tau) of the curve. A higher Tau value indicates slower blood flow. (D) Contrast-ECHO data from Cre and K2KO mice before and after 4-week AngII infusion (n = 5). P(interaction) = 0.0143 by 2-way ANOVA. P value shown is from Tukey’s post hoc test. NS, not significant. (E) The effect of DNase I administration on myocardial microcirculation assessed by contrast-ECHO (n = 5). P value from 2-tailed, unpaired Student’s t test.
Figure 7
Figure 7. Heparin administration ameliorates AngII-induced cardiac dysfunction in K2KO hearts.
(A) Cardiac function and hypertrophy (n = 5–10). (B) Myocardial hypertrophy (WGA–Alexa Fluor 488 staining), fibrosis (Picrosirius red staining), and capillary density (CD31 immunofluorescence). n = 5–11. (C) Intracardiac microthrombosis (vWF/P-selectin immunofluorescence), NET formation (H3Cit immunofluorescence), and cell death (TUNEL immunofluorescence). Infusion: 4 weeks (A and B) or 1 week (C). P values are from 1-way ANOVA with Tukey’s post hoc test. Representative images from an individual animal (n = 5–11 in each group). Scale bars: 25 μm.
Figure 8
Figure 8. Neutrophilia by adoptive neutrophil transfusion accelerates AngII-induced cardiac hypertrophy.
(A) LV function and hypertrophy. Non-NT, no neutrophil transfusion; NT, neutrophil transfusion; NT-DN, neutrophil transfusion plus DNase I treatment. All groups received a 4-week AngII infusion (n = 5–9). (B) Plasma cardiac troponin I (cTnT) levels after 1-week AngII infusion (n = 5–8). (C) Myocardial hypertrophy (WGA staining) and fibrosis (Picrosirius red staining). (D) Intracardiac NETs (H3Cit) and cell death (TUNEL). (E) Histone-associated DNA fragments and cell-free DNA (cfDNA) in the plasma of HF patients and non-HF controls (n = 8). P values are from 1-way ANOVA with Tukey’s correction (AD) or 2-tailed, unpaired Student’s t test (E). Representative images from an individual animal (n = 5–9 in each group). Scale bars: 25 μm.
Figure 9
Figure 9. Transcriptomic studies identify KLF2 as a nodal regulator in neutrophils.
(A and B) Pathway enrichment analysis and heatmap of all transcription factors in neutrophil DEGs (Cre-AngII vs. K2KO-AngII). RNA-Seq studies included 4 animals in each group. (C) Hif1a expression in neutrophils (n = 6). Treatment: AngII (100 nmol/L) for 0.5 hours in vitro. P values are from 2-way ANOVA with Tukey’s correction. (DF) Lyz2-Cre (Cre) vs. Lyz2-Cre-KLF2-HIF1α double-knockout (DKO) mice (n = 4–5). (D) Cardiac function and hypertrophy. NS indicates not significant by 2-tailed, unpaired Student’s t test. (E) FACS analysis of cardiac myeloid cells. (F) Intracardiac NET formation (H3Cit) and cell death (TUNEL). Scale bars: 25 μm. Representative FACS and immunofluorescence images from an individual animal (n = 5). AngII infusion: 4 weeks (D) or 1 week (E and F).
Figure 10
Figure 10. Single-cell RNA-Seq study identifies the major non-cardiomyocyte cell types that regulate cardiac dysfunction.
(A) UMAP and unsupervised clustering analysis using Seurat pipeline identified 7 distinct cell populations from a total of 17,256 cells. EC, endothelial cell; Mac, macrophage; Fib, fibroblast; T/NK, T cell and NK cell; Neu, neutrophil; B, B cell; mEC, mitotic endothelial cell. (B) Heatmap of top 50 marker genes for each cluster. Selected cell-type-specific markers labeled. (C) Feature plots depicting gene expression on UMAP. (D) UMAP of 8716 Cre cells and 8540 K2KO cells showing 7 cell populations. (E) Percentage of each cell cluster in Cre and K2KO groups. Differences in neutrophils and mitotic endothelial cells are noted. Cells isolated from 3 mice in each group were pooled before FACS isolation. Two pooled samples (Cre vs. K2KO) were single-cell captured and sequenced.
Figure 11
Figure 11. Neutrophils orchestrate myocardial inflammation and adaptation to AngII stress.
(A) Gene ontology (GO) analyses with K2KO DEGs from 4 major cell types: neutrophils, macrophages, endothelial cells, and fibroblasts; showing top 10 biological process (BP) GO terms according to adjusted P values (p.adjust). (B) Cell-cell interactome analysis of all significant 7 cell types based on the ligand-receptor communication. Arrows: red = upregulated, blue = downregulated; arrowhead = receptor level changed, circle head = receptor level NOT changed; solid line = ligand level changed, dotted line = ligand level NOT changed; line thickness and head size represent relative fold change values. (C) Tnfsf9 mRNA expression levels in all significant 7 cell types are shown as violin plot.
Figure 12
Figure 12. Working model.
AngII-induced NETosis results in microthrombosis and sporadic ischemia in the myocardium, promoting cardiac hypertrophy. In HF patients, hyperphysiological AngII levels due to a heightened renin-angiotensin system may propel this vicious cycle (dashed arrow). This model suggests novel therapeutic approaches for HF by targeting neutrophils, NETs, or thrombosis.

Comment in

References

    1. Mann DL. Inflammatory mediators and the failing heart: past, present, and the foreseeable future. Circ Res. 2002;91(11):988–998. doi: 10.1161/01.RES.0000043825.01705.1B. - DOI - PubMed
    1. Kamo T, et al. Cardiac nonmyocytes in the hub of cardiac hypertrophy. Circ Res. 2015;117(1):89–98. doi: 10.1161/CIRCRESAHA.117.305349. - DOI - PubMed
    1. Kroop IG, Shackman NH. Level of C-reactive protein as a measure of acute myocardial infarction. Proc Soc Exp Biol Med. 1954;86(1):95–97. doi: 10.3181/00379727-86-21019. - DOI - PubMed
    1. Pye M, et al. Study of serum C-reactive protein concentration in cardiac failure. Br Heart J. 1990;63(4):228–230. doi: 10.1136/hrt.63.4.228. - DOI - PMC - PubMed
    1. Anand IS, et al. C-reactive protein in heart failure: prognostic value and the effect of valsartan. Circulation. 2005;112(10):1428–1434. doi: 10.1161/CIRCULATIONAHA.104.508465. - DOI - PubMed

Publication types

Substances