. 2022 Jan 24;32(2):289-303.e6.
doi: 10.1016/j.cub.2021.10.063. Epub 2021 Nov 17.

Interspecies transcriptomics identify genes that underlie disproportionate foot growth in jerboas

Affiliations

Interspecies transcriptomics identify genes that underlie disproportionate foot growth in jerboas

Aditya Saxena et al. Curr Biol. .

Abstract

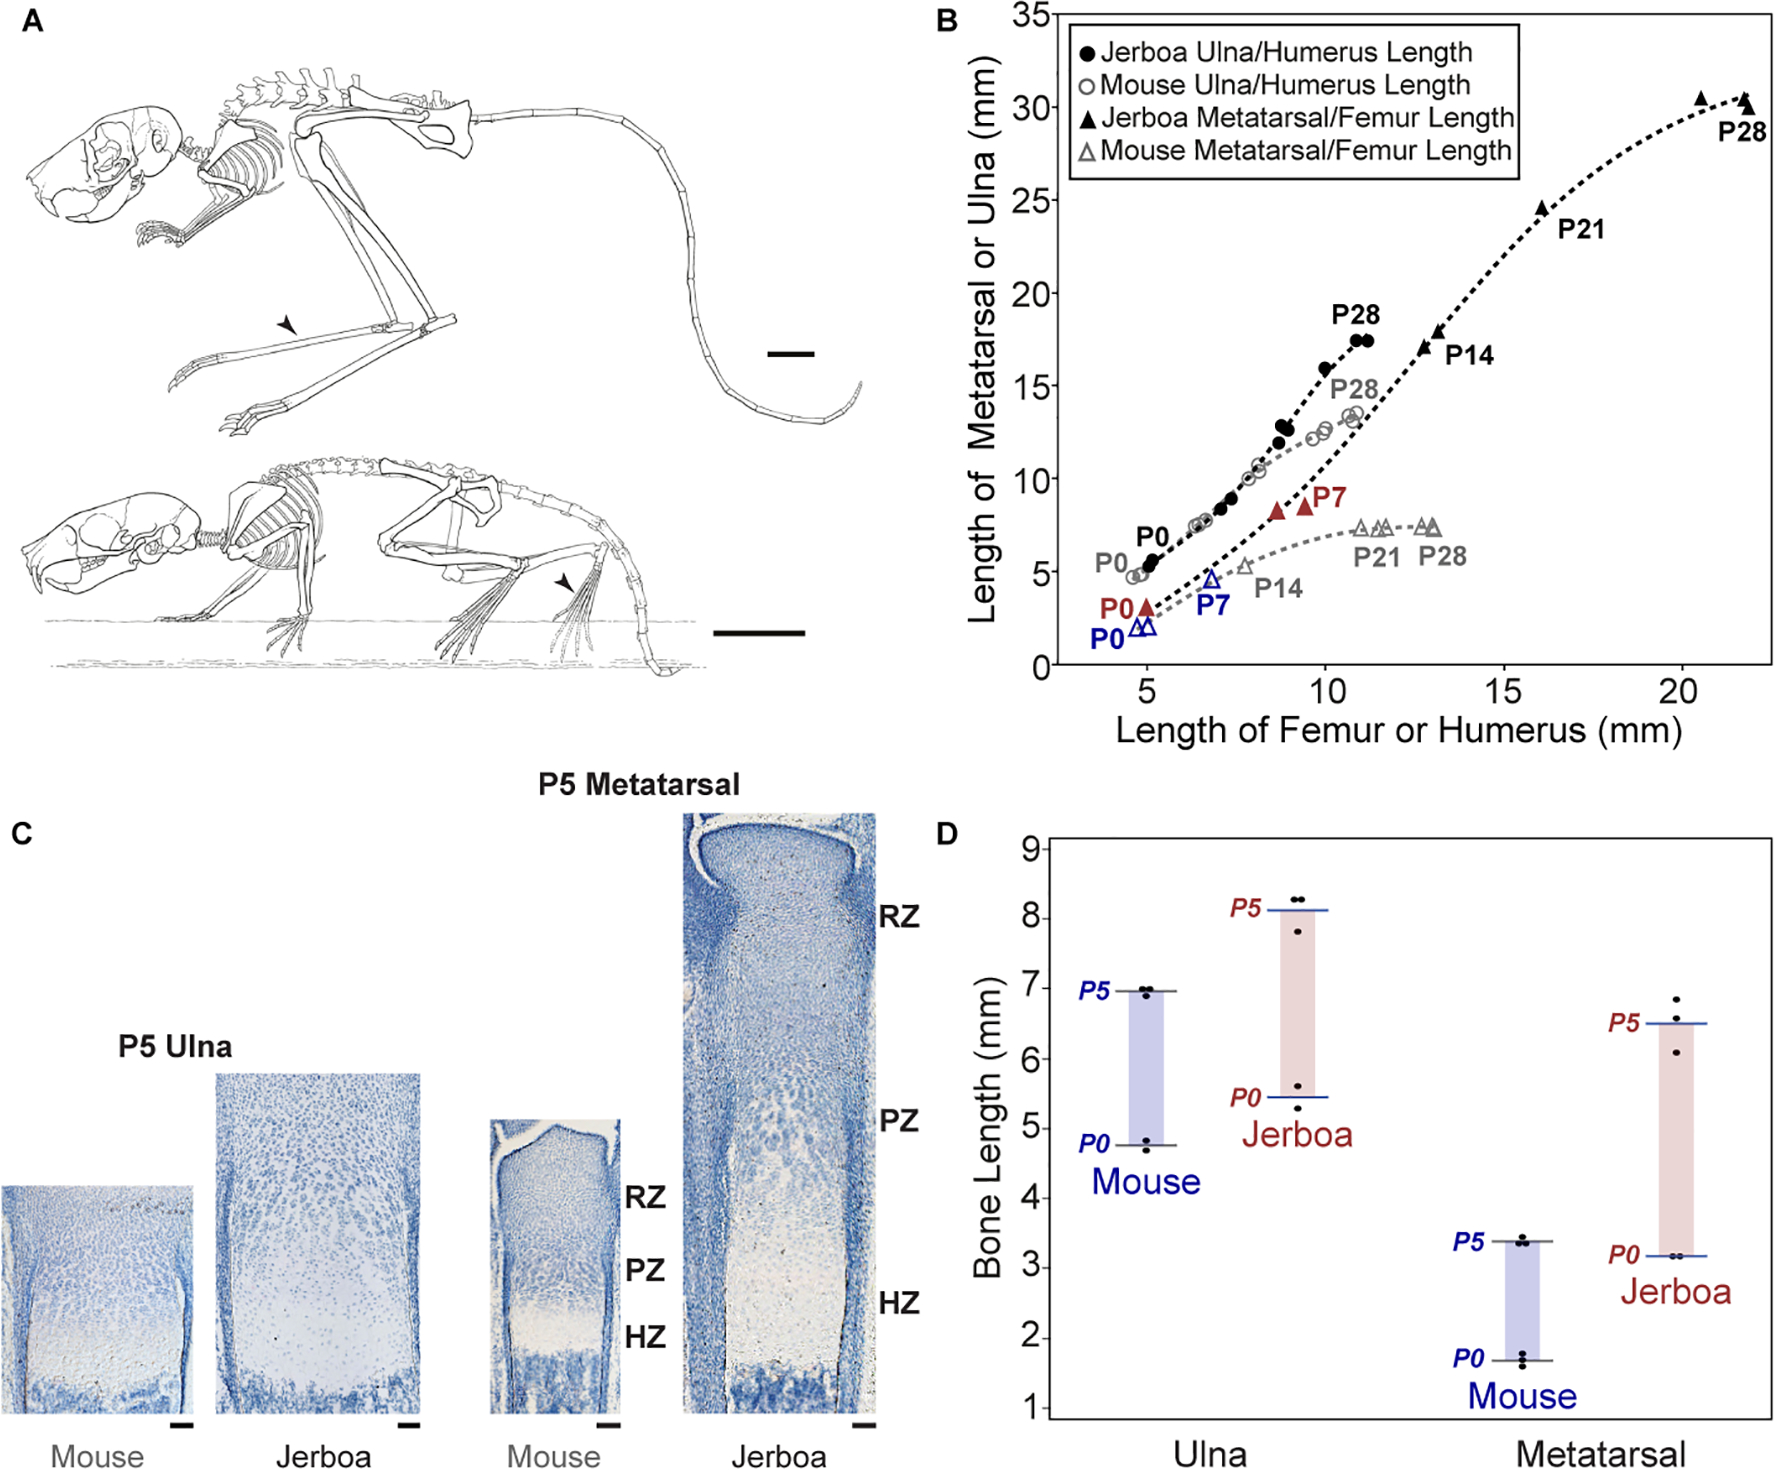
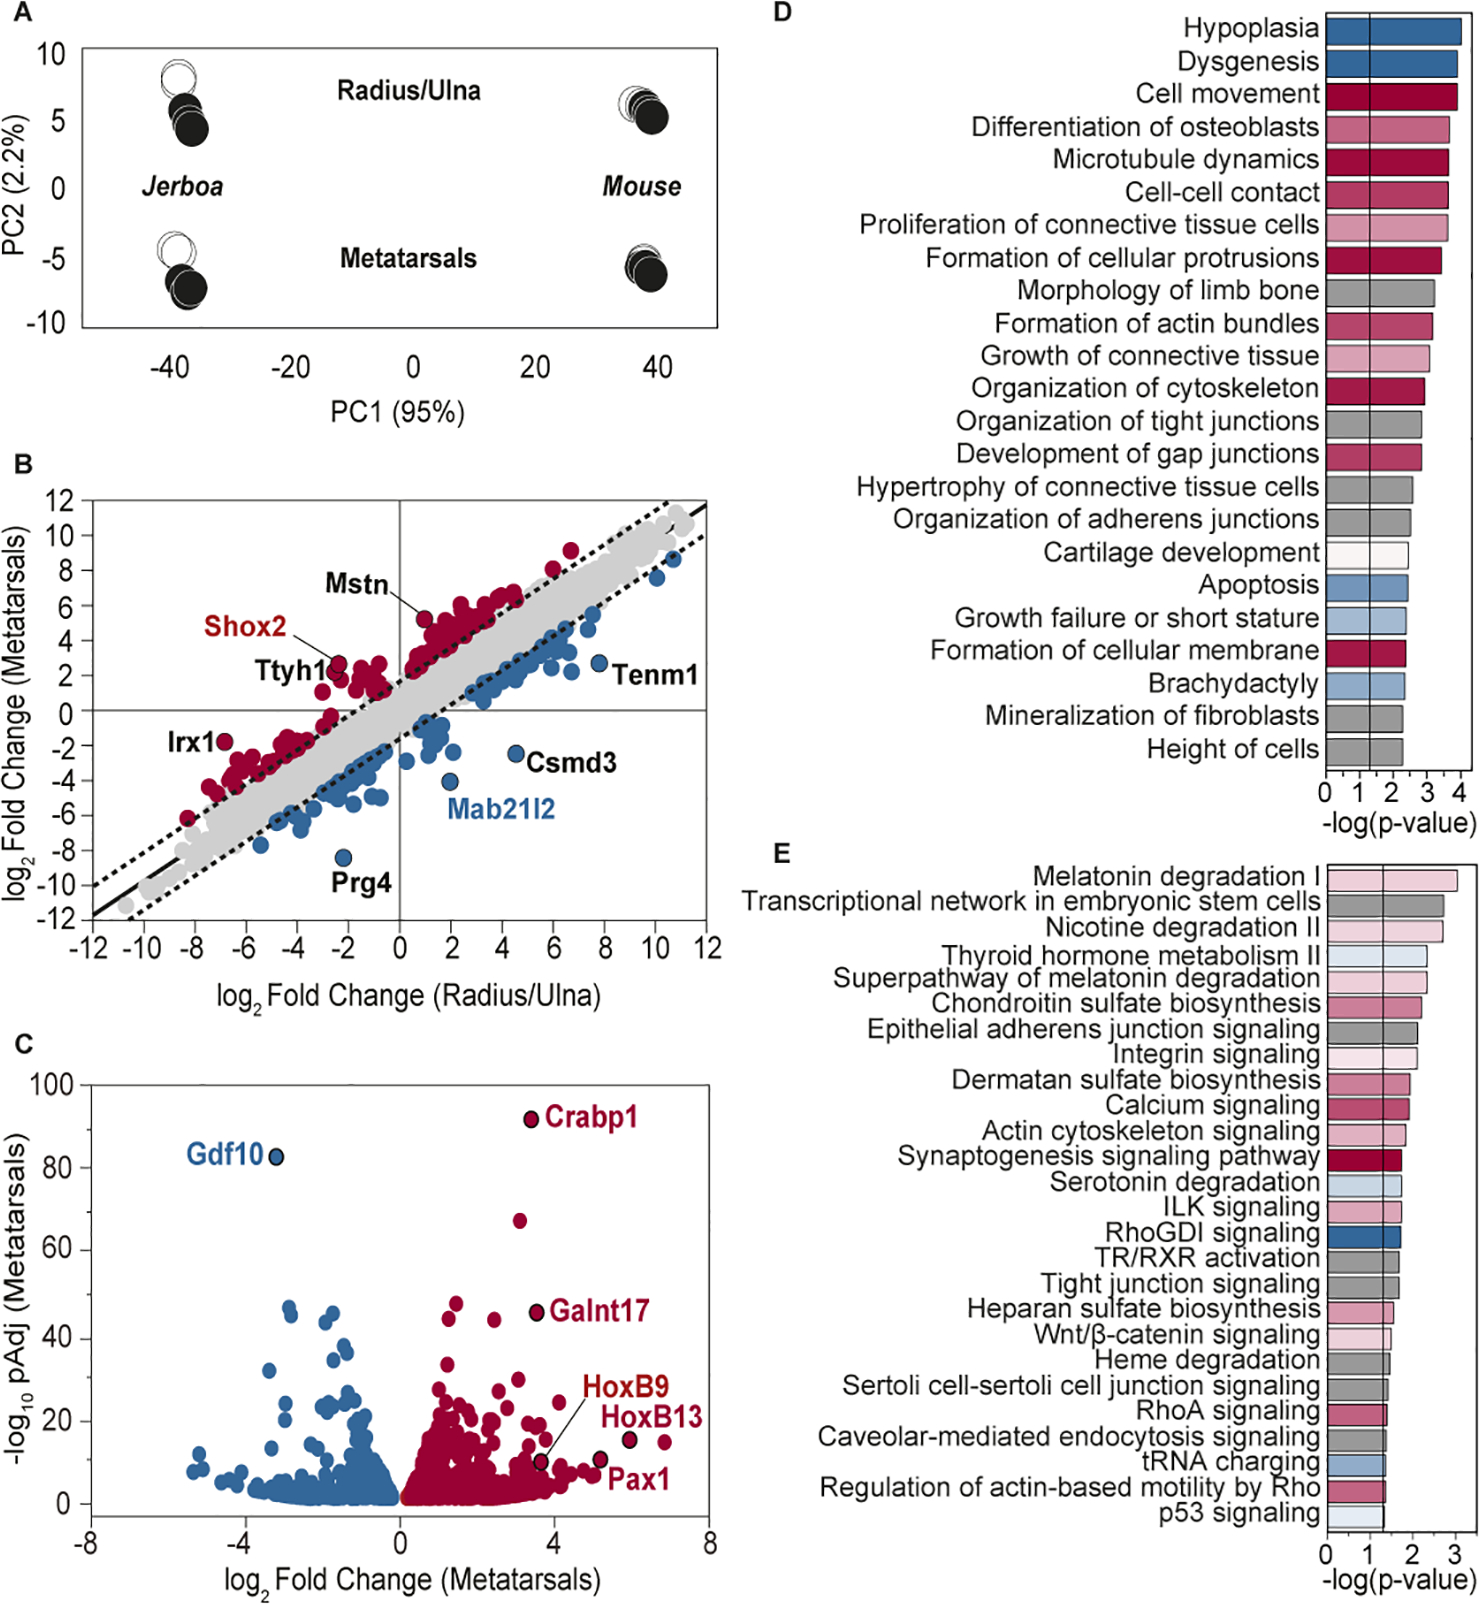
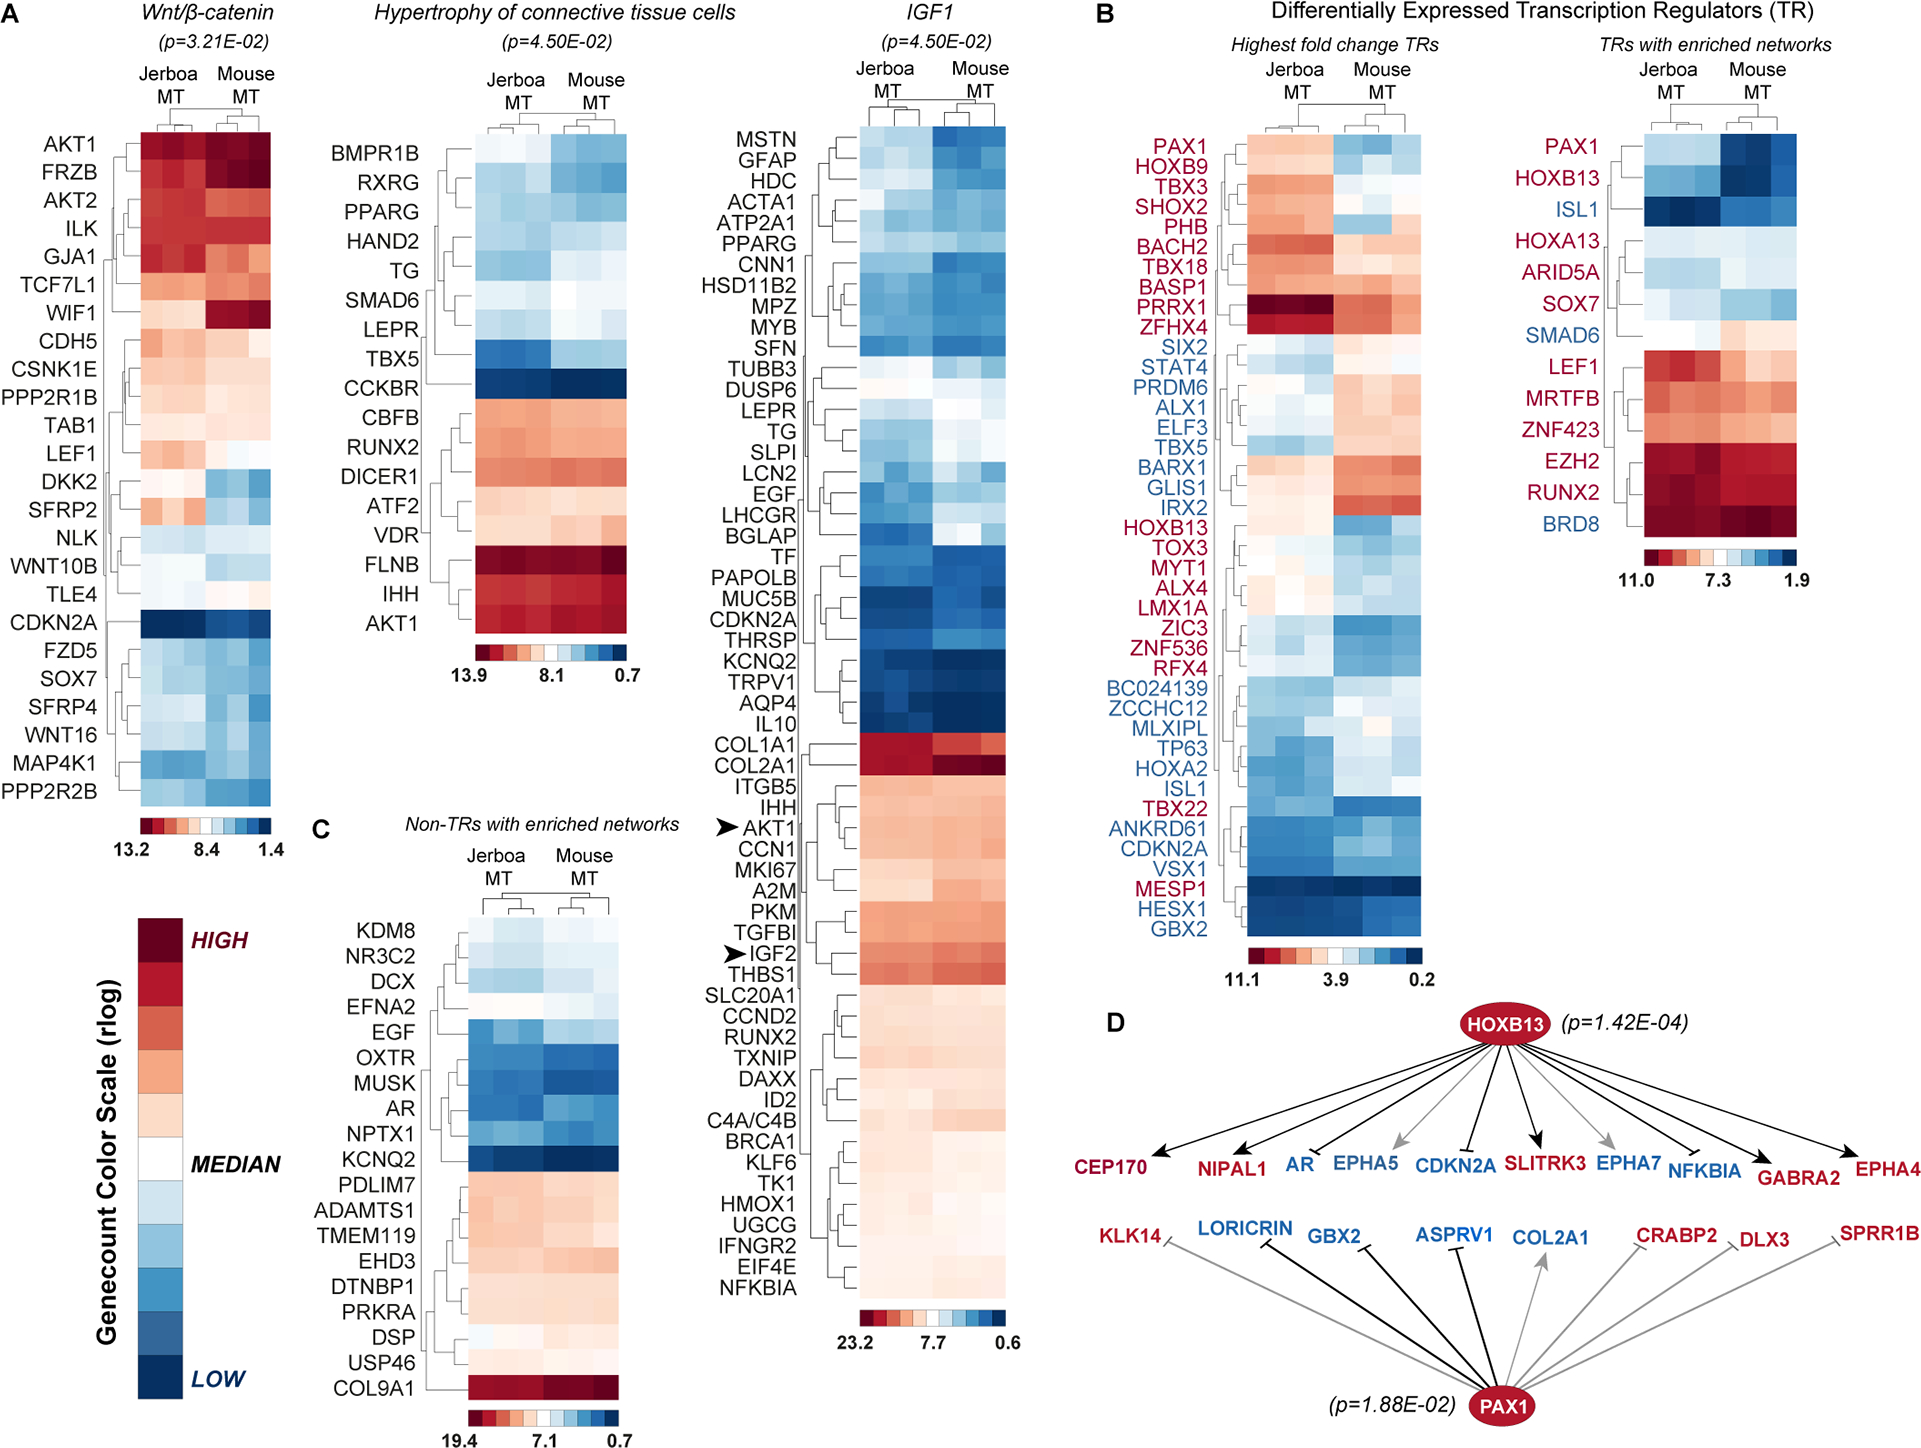
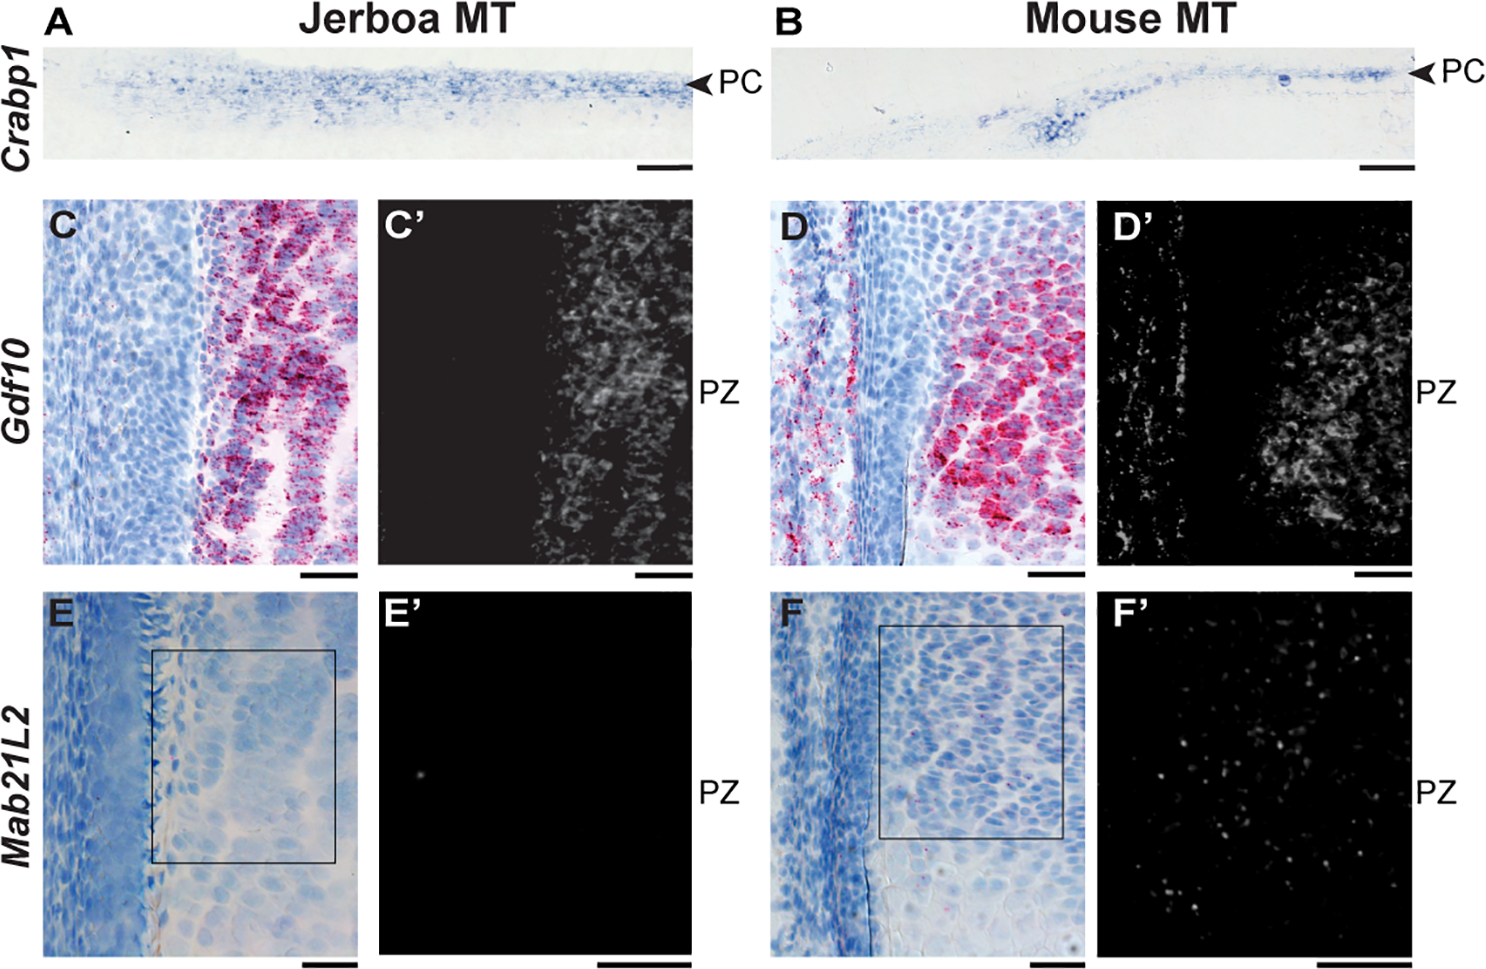
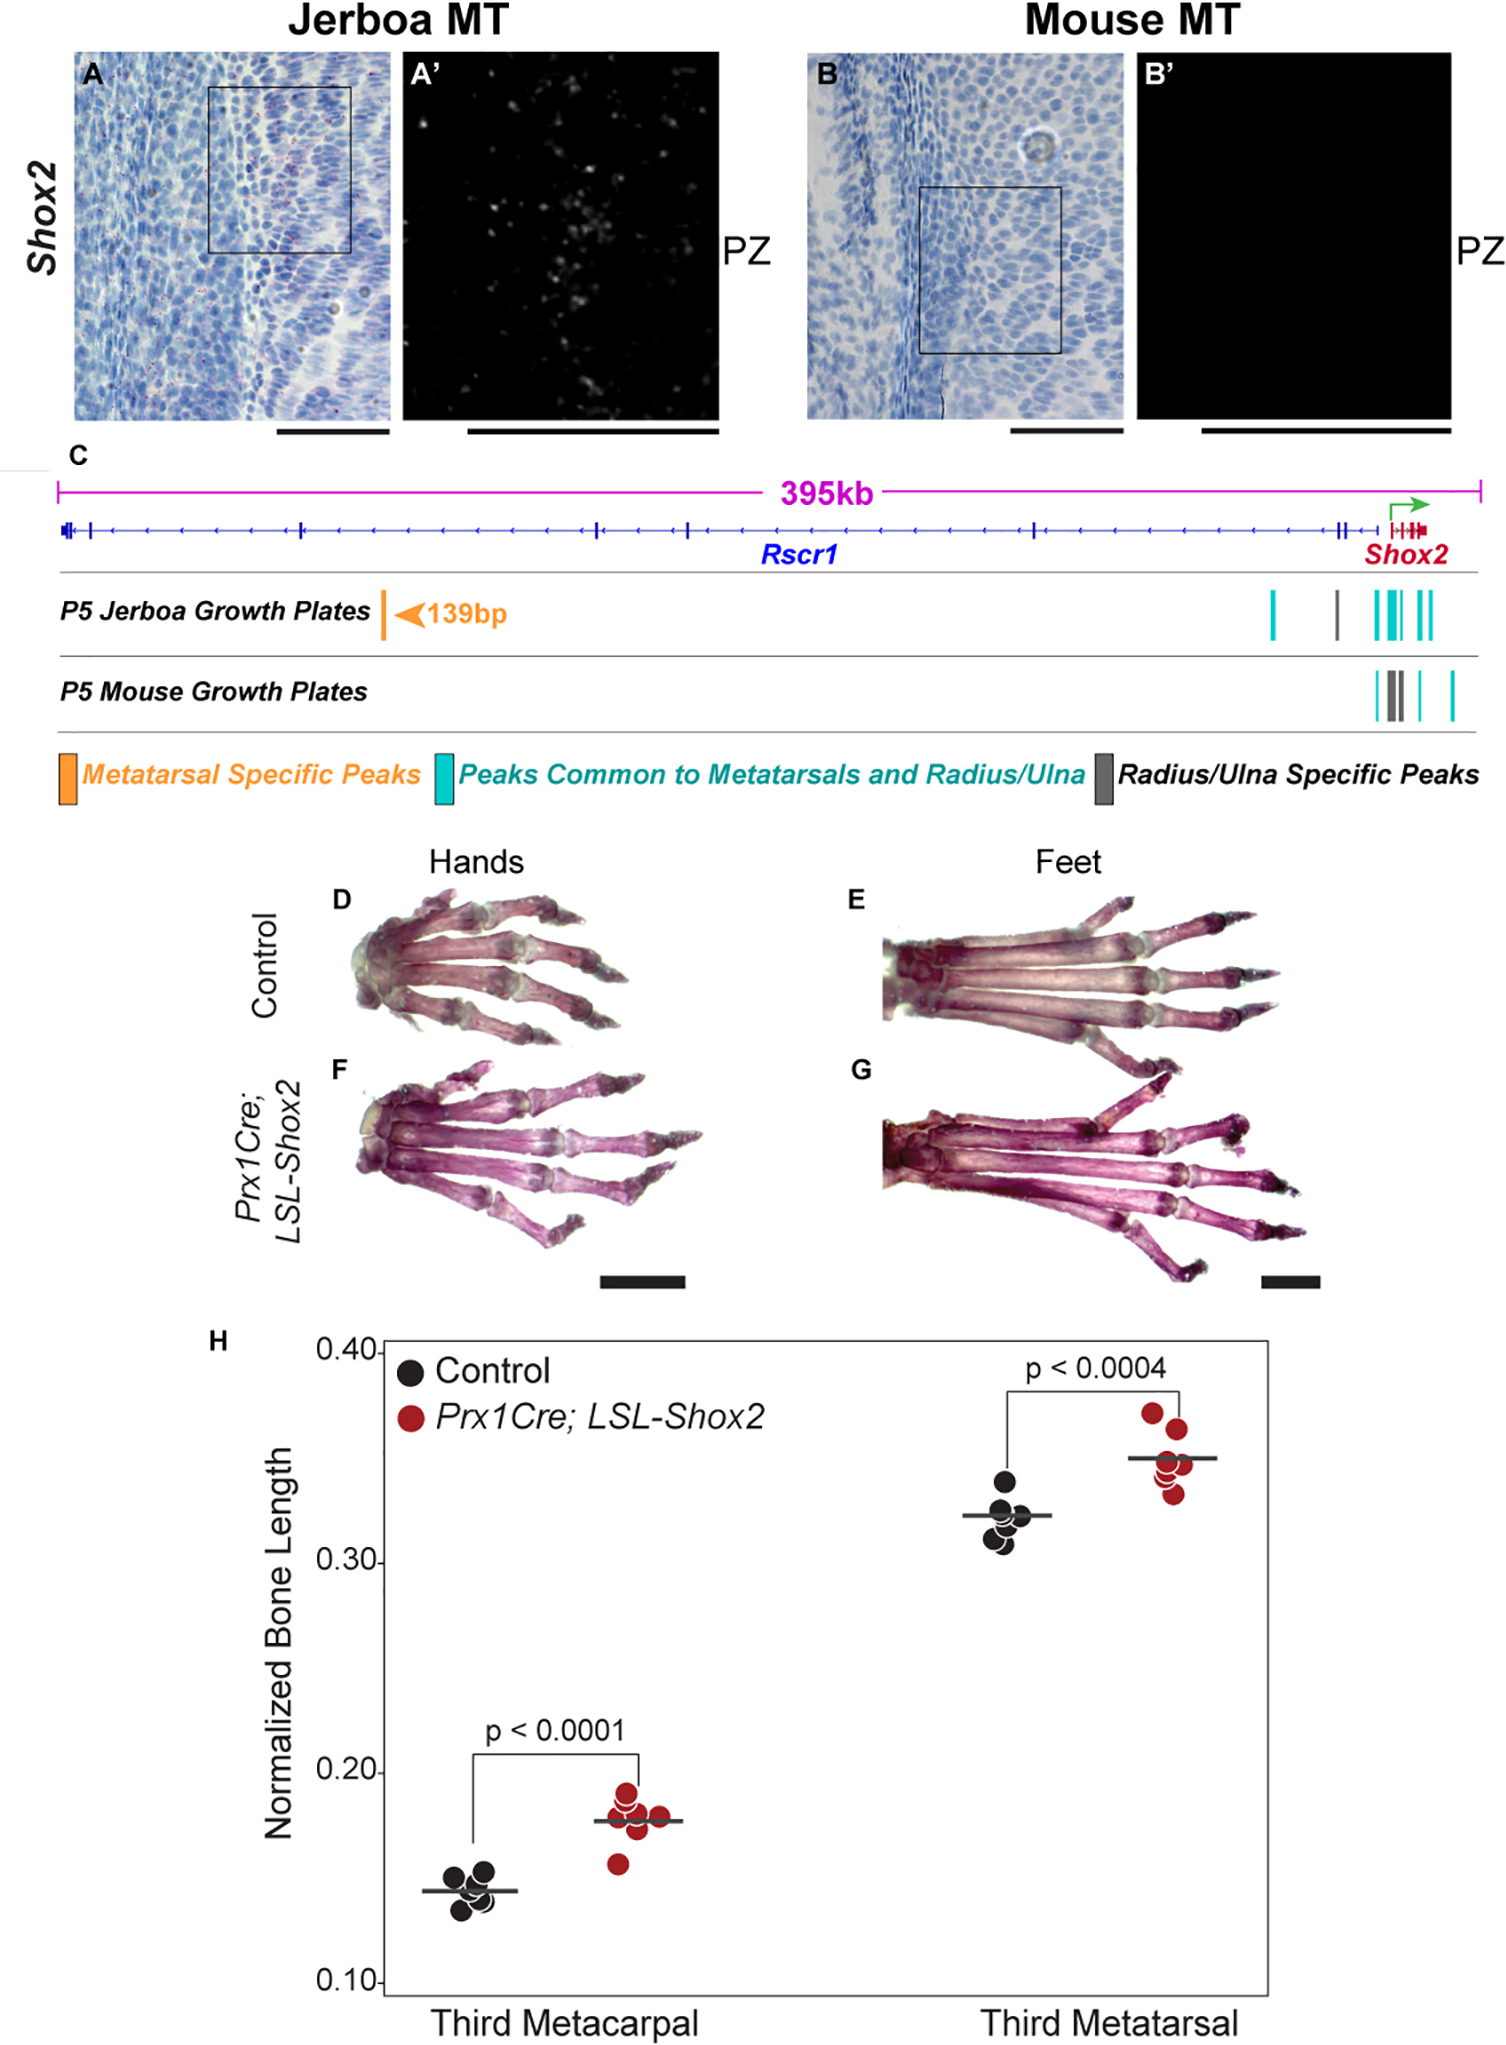
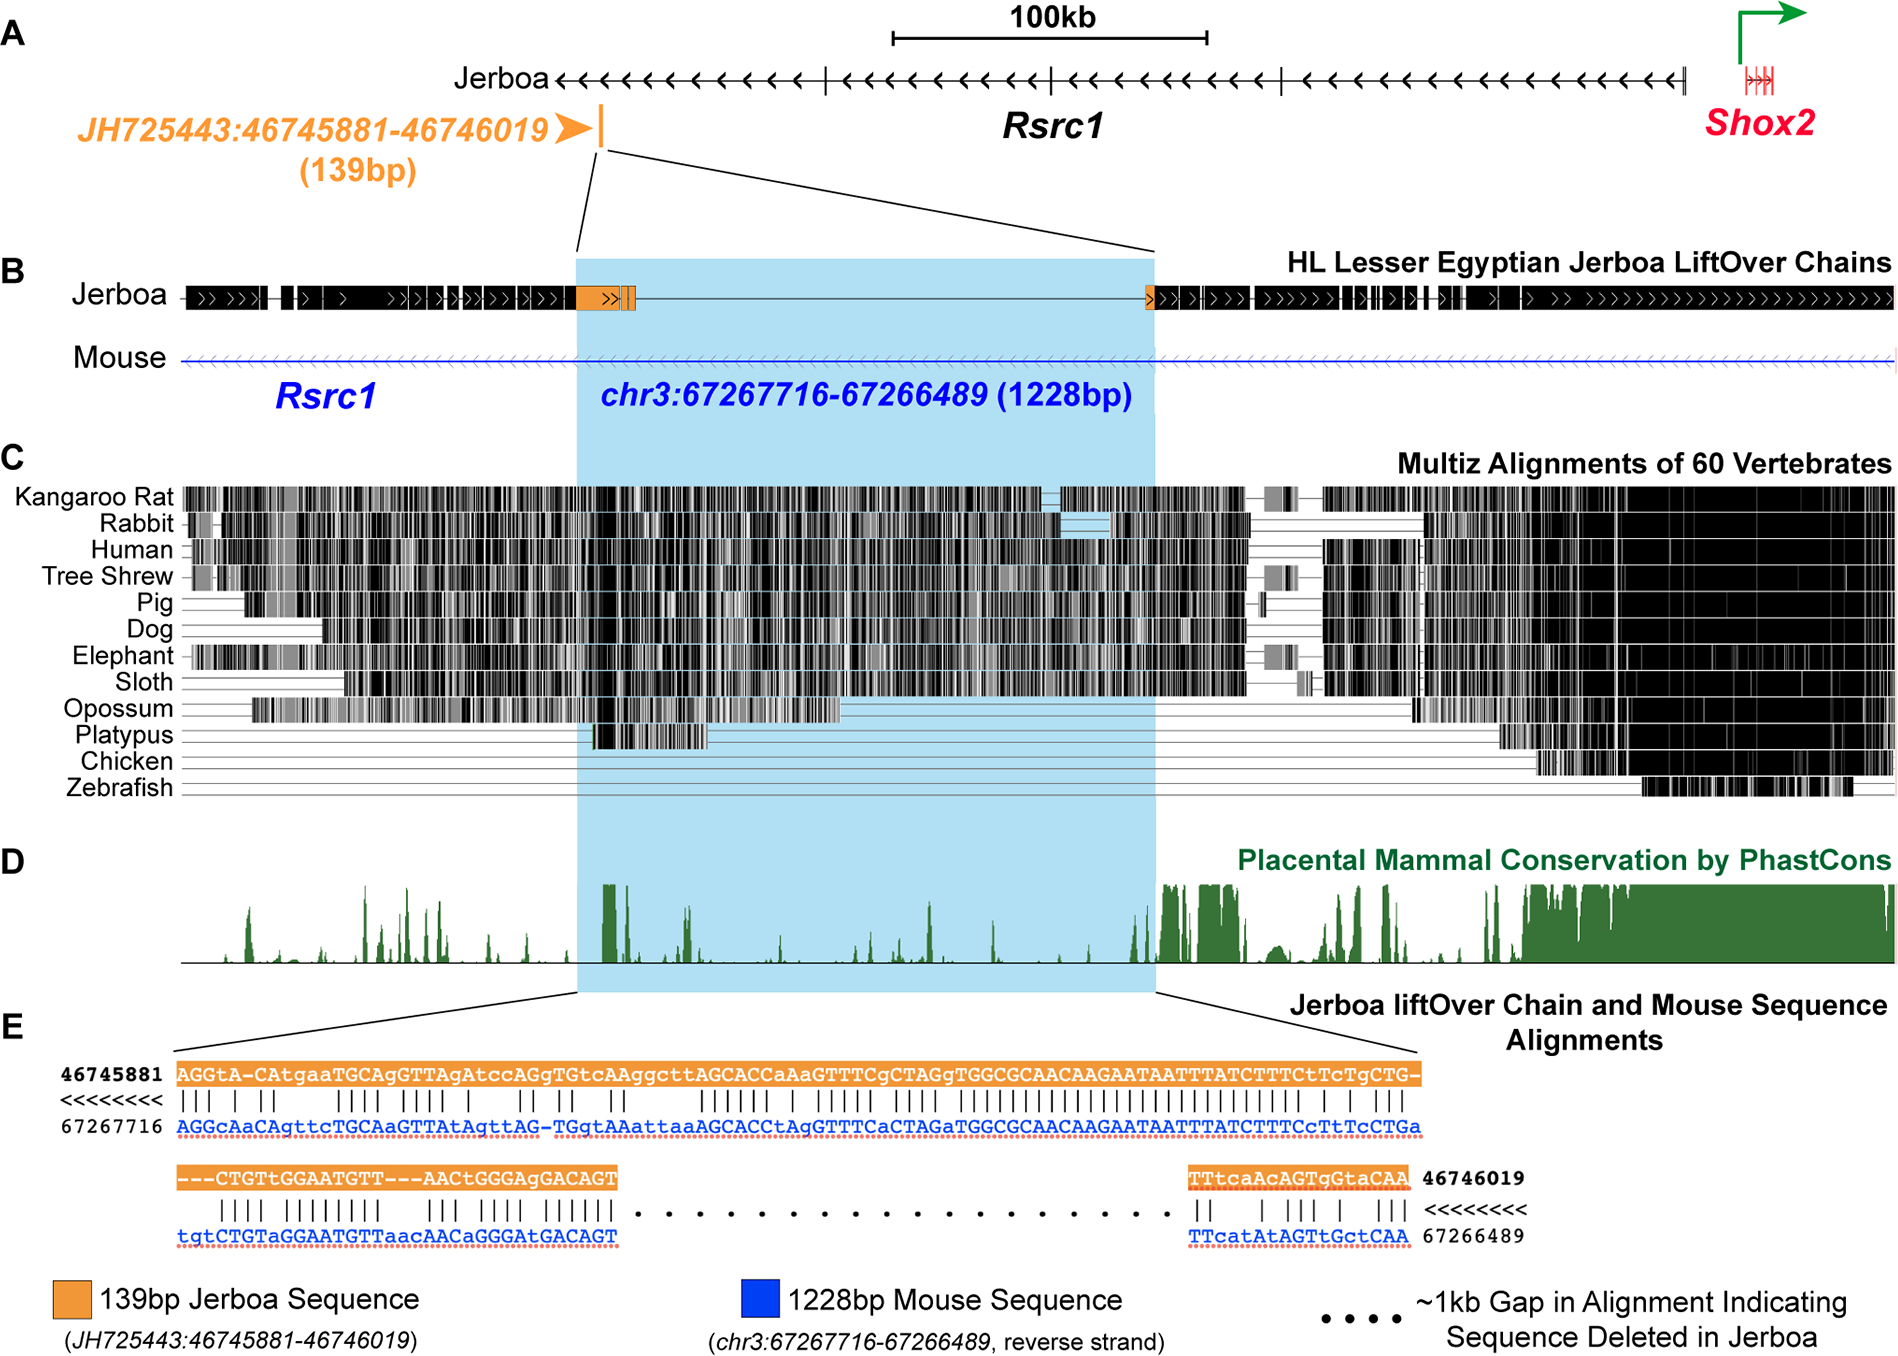
Despite the great diversity of vertebrate limb proportion and our deep understanding of the genetic mechanisms that drive skeletal elongation, little is known about how individual bones reach different lengths in any species. Here, we directly compare the transcriptomes of homologous growth cartilages of the mouse (Mus musculus) and bipedal jerboa (Jaculus jaculus), the latter of which has "mouse-like" arms but extremely long metatarsals of the feet. Intersecting gene-expression differences in metatarsals and forearms of the two species revealed that about 10% of orthologous genes are associated with the disproportionately rapid elongation of neonatal jerboa feet. These include genes and enriched pathways not previously associated with endochondral elongation as well as those that might diversify skeletal proportion in addition to their known requirements for bone growth throughout the skeleton. We also identified transcription regulators that might act as "nodes" for sweeping differences in genome expression between species. Among these, Shox2, which is necessary for proximal limb elongation, has gained expression in jerboa metatarsals where it has not been detected in other vertebrates. We show that Shox2 is sufficient to increase mouse distal limb length, and a nearby putative cis-regulatory region is preferentially accessible in jerboa metatarsals. In addition to mechanisms that might directly promote growth, we found evidence that jerboa foot elongation may occur in part by de-repressing latent growth potential. The genes and pathways that we identified here provide a framework to understand the modular genetic control of skeletal growth and the remarkable malleability of vertebrate limb proportion.

Keywords: evolution of development; limb development; skeletal growth; skeletal proportion.


Conflict of interest statement

Declaration of interests The authors declare no competing interests.

Figures

Figure 1 |
Figure 1 |. Jerboa metatarsals elongate disproportionately faster than mouse during neonatal development.
(A) Postural reconstructions of adult jerboa and mouse skeletons adapted from Moore, et al. 2015 (arrowheads point to metatarsals, scalebars = 10 mm) (B) Postnatal (P0 to P28) growth trajectory of metatarsal or ulna (y-axis) relative to femur or humerus (x-axis), respectively. P0 and P7 hindlimb measurements are emphasized in blue for mouse and in red for jerboa (C) Histological sections of P5 distal ulna and metatarsal growth cartilages of mouse and jerboa. Resting (RZ), proliferative (PZ), and hypertrophic (HZ) zones in mouse and jerboa metatarsal are indicated to the right of each growth cartilage (scalebars = 100 μm). (D) Colored bars highlight increase in ulna and metatarsal whole bone lengths from P0 (n=3 mouse and 2 jerboas) to P5 (n=3 each). Individual (dots) and average (line) measurements are shown for each element at P0 and P5. The third (middle) jerboa metatarsal elongates at a rate 2.1-times faster than mouse while the ulna grows 1.2-times faster than mouse.
Figure 2 |
Figure 2 |. Gene expression profiling identifies 10% of orthologous genes that are associated with disproportionate jerboa metatarsal elongation.
(A) Principal component analysis (PCA) shows that PC1 (species) explains 95% of the variance and PC2 (tissue-type) explains 2.2% of the variance (n=5 each). Black circles denote the three samples used in primary analyses. (B) 8,734 genes are differentially expressed in jerboa compared to mouse both in metatarsals (MT, y-axis) and in radius/ulna (RU, x-axis). Of these, 8,493 are equivalently differentially expressed between species in the MT and RU (grey points) and lie within the 99% confidence interval (dashed line) of the linear fit (solid black line, slope=0.977). 241 genes outside of the confidence interval are non-equivalently differentially expressed in the MT and RU. Eight genes with least-correlated expression differences in MT and RU are labeled. (C) 1,514 genes are significantly differentially expressed between jerboa and mouse MT and not RU. Genes that are expressed higher in jerboa than in mouse MT are denoted red and those that are lower are denoted blue in (B) and (C). (D) A selection of cellular functions, organismal and tissue developmental processes, and developmental disorders of interest to cartilage biology and enriched (padj<0.05) among all 1,755 genes that are associated with disproportionate jerboa MT elongation. (E) Canonical signaling pathways that are significantly enriched among these genes. In (D) and (E), activation of a function or a pathway is indicated in red and inhibition in blue. Grey bars indicate unknown activation status. Bar colour intensity indicates confidence of predicted activation status (z-score). Black vertical lines in (D) and (E) indicate p-value threshold (<0.05). Numerical values for selected annotations in (D) and for all enriched canonical pathways (E) are in Table S6. See also Figure S1 and S2 and Table S1–S4.
Figure 3 |
Figure 3 |. Identification of hypertrophy pathways and transcription networks associated with disproportionate jerboa metatarsal elongation.
(A-C) Regularized log-transformed gene count heatmaps for genes that are disproportionately differentially expressed between jerboa (n=3) and mouse (n=3) MTs. Red, white, and blue colors indicate high, median, and low r-log genecount values, respectively. Color scales that indicate the genecount range within each heatmap are shown with internally assigned color values. (A) Genes in the enriched Wnt/β-catenin signaling network, those enriched within a hypertrophy of connective tissue network, and genes enriched in the IGF-1 signaling network (p-values <0.05). (B) The 40 transcription regulators that are most differentially expressed in MT of the two species. Thirteen differentially expressed transcription regulators that are each in networks with putative target genes that are enriched in our dataset. (C) Differentially expressed non-transcriptional regulators with putative networks enriched in our dataset. (D) Downstream networks of HoxB13 and Pax1 transcription regulators. Grey lines indicate that the direction of gene expression change is the opposite of what has been demonstrated in other contexts. Red and blue gene names in (B,D) indicate genes with higher or lower expression, respectively, in jerboa metatarsals compared to mouse. See also Table S6 and S7.
Figure 4 |
Figure 4 |. Spatial pattern of Crabp1, Gdf10, and Mab21L2 expression in jerboa and mouse metatarsal growth cartilages.
Expression patterns in distal growth cartilages of P5 jerboa (left) and mouse (right). (A-B) Crabp1 colorimetric (blue) in situ hybridization in perichondrium (PC), (C-H) RNAScope colorimetric and (C’-H’) fluorescence detection of (C-D) Gdf10, and (E-F) Mab21L2 in proliferative zones (PZ). (C-F), Hematoxylin-stained nuclei (blue) and Fast Red in situ signal (red). Fluorescent Fast Red in situ signal is shown in (C’-F’). Scale bars, A-B = 100 μm, C-F = 50 μm. See also Figures S3–S5.
Figure 5 |
Figure 5 |. Derived Shox2 expression in jerboa metatarsals may have contributed to increased distal limb elongation.
(A-B) Shox2 is expressed in the proliferative zone (PZ) of jerboa metatarsals (MT) where it is not present in mouse. (C) Open chromatin regions in P5 jerboa and mouse growth cartilage near the Shox2 transcription start site (TSS, green arrow). A 139 bp region of open chromatin, preferentially accessible in jerboa metatarsals (orange), lies ~285 kb upstream of the Shox2 TSS in an Rsrc1 intron at a position orthologous to mouse chr3:67266489–67267716. (D,F) Metacarpal and (E,G) metatarsal lengths are increased in Prx1Cre;LSL-Shox2 (Shox2-overexpressing) mice at eight weeks of age compared to control littermates. In (H), measurements are normalized to the skull length of each individual, which was not affected by Shox2-overexpression (Figure S6D). p-values are derived from a paired t-test between matched-sex littermates (n=5 females and 2 males of each genotype). Shox2-overexpressing metacarpals are 23.6% and metatarsals are 9.1% longer than controls. Scale bars, (A-B) = 50 μm, (D-G) = 2 mm. See also Figure S6.
Figure 6 |
Figure 6 |. Jerboa Rsrc1 metatarsal ‘unique’ peak shows deletion of a genomic region that is retained across placental mammals.
(A) The 139 bp Rsrc1 open chromatin peak that is preferentially accessible in jerboa metatarsals partially maps to a longer 1228 bp orthologous region in mouse Rsrc1 intron (B, blue highlight). Jerboa LiftOver chains show ~1 kb gap in this alignment to the mouse Rsrc1 intron. (c) This gap indicates deletion of sequence in the jerboa genome that is broadly present in an alignment of placental mammals with overall low sequence conservation (D). (E) Alignment of the 139 bp jerboa sequence to the 1228 bp mouse sequence. Dotted line indicates a 1089 bp mouse sequence without orthology in the jerboa genome. Sanger sequencing of a larger region that spans the 139 bp jerboa metatarsal peak confirms the presumed deletion at this site (JH725443:46745881:46746019). Multiple sequence alignment and conservation for this region in C-D were extracted from UCSC genome browser. See also Figure S7.

Similar articles

Cited by

References

    1. Kronenberg HM (2003). Developmental regulation of the growth plate. Nature 423, 332–336. - PubMed
    1. Kozhemyakina E, Lassar AB, and Zelzer E (2015). A pathway to bone: signaling molecules and transcription factors involved in chondrocyte development and maturation. Development 142, 817–831. - PMC - PubMed
    1. Krakow D, and Rimoin DL (2010). The skeletal dysplasias. Genet. Med 12, 327–341. - PubMed
    1. Christians JK, Bingham VK, Oliver FK, Heath TT, and Keightley PD (2003). Characterization of a QTL affecting skeletal size in mice. Mamm. Genome 14, 175–183. - PubMed
    1. Parker HG, VonHoldt BM, Quignon P, Margulies EH, Shao S, Mosher DS, Spady TC, Elkahloun A, Cargill M, Jones PG, et al. (2009). An Expressed Fgf4 Retrogene Is Associated with Breed-Defining Chondrodysplasia in Domestic Dogs. Science 325, 995–998. - PMC - PubMed

Publication types

Substances