. 2021 Dec:156:111622.
doi: 10.1016/j.exger.2021.111622. Epub 2021 Nov 15.

Explaining inter-lab variance in C. elegans N2 lifespan: Making a case for standardized reporting to enhance reproducibility

Affiliations

Explaining inter-lab variance in C. elegans N2 lifespan: Making a case for standardized reporting to enhance reproducibility

Nicholas D Urban et al. Exp Gerontol. 2021 Dec.

Abstract

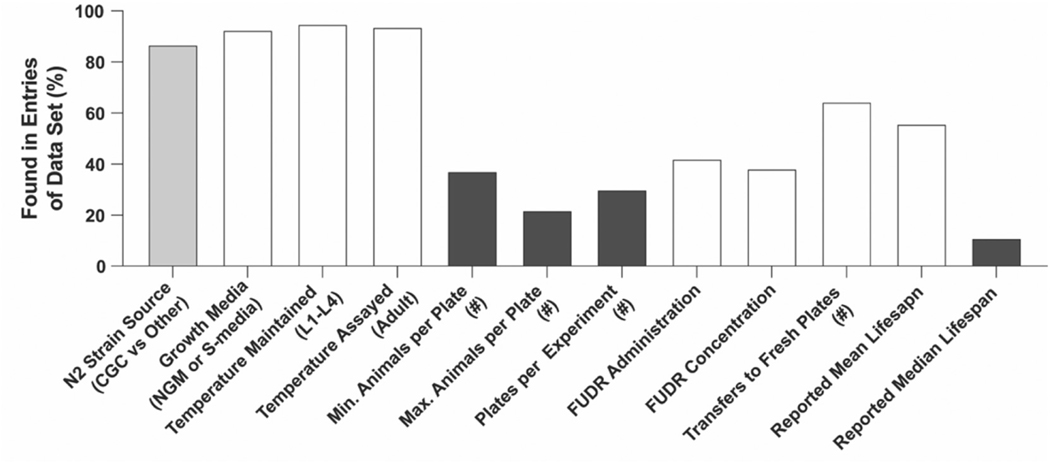
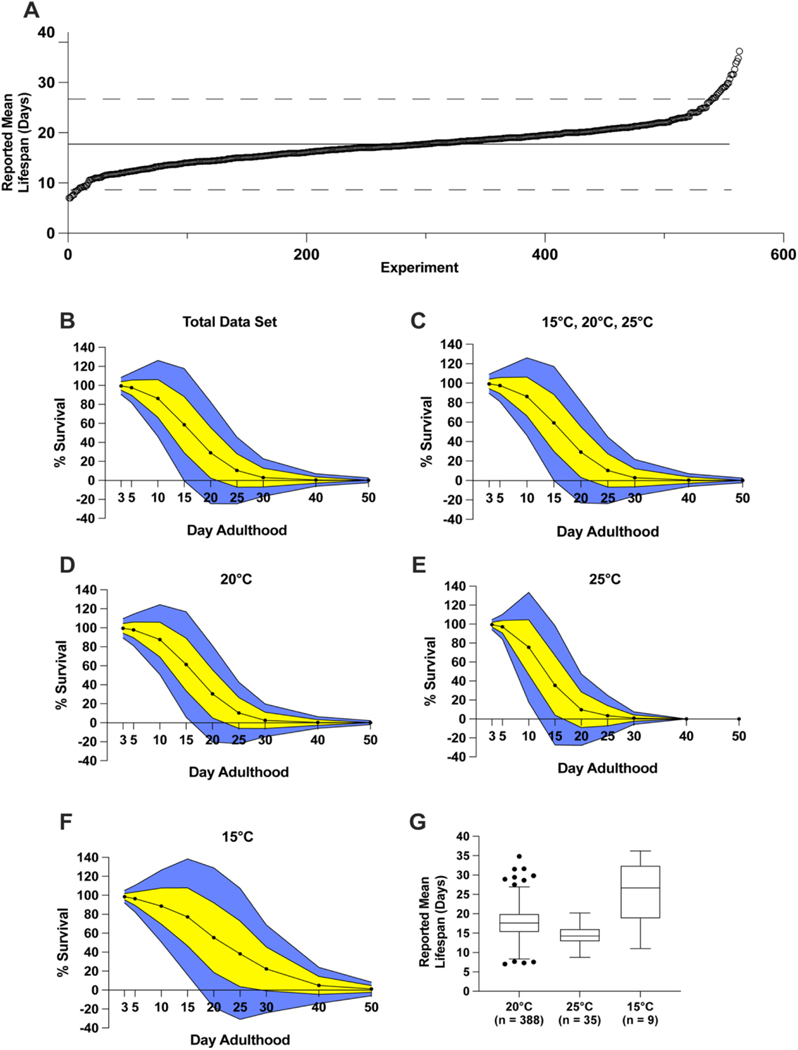
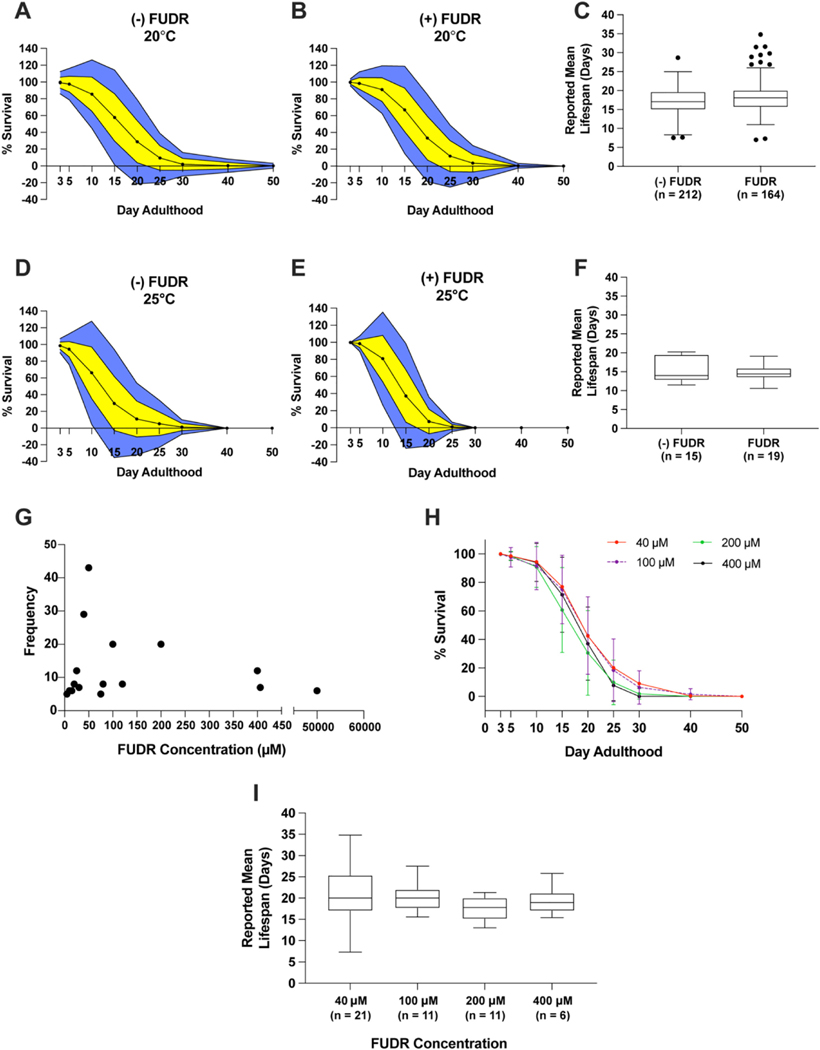
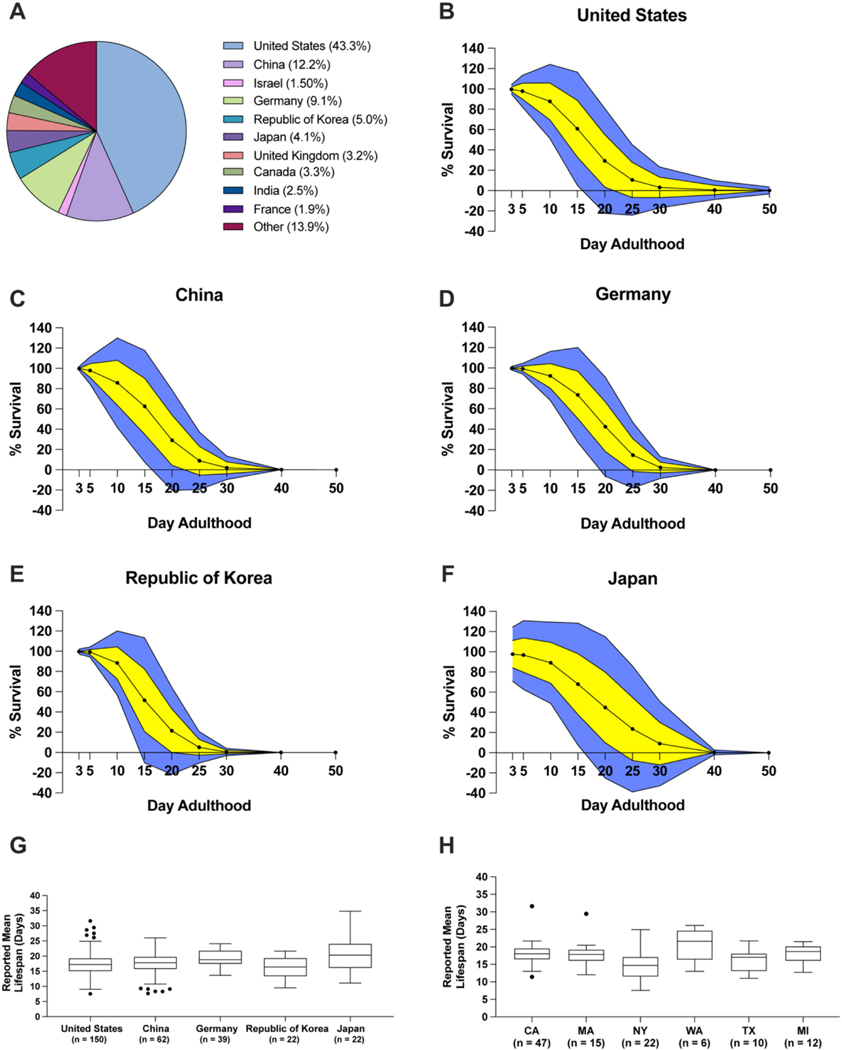
The nematode Caenorhabditis elegans is a powerful model organism for studying cell development, apoptosis, neuronal circuits, and aging. The isolate N2 is recognized by the C. elegans community as the reference wild-type strain. Interestingly, the lifespan of presumably isogenic C. elegans N2 worms-even when grown under comparable conditions-varies significantly amongst distinct laboratories. This hinders the inter-laboratory comparability of C. elegans lifespan data and raises questions regarding data interpretation and reproducibility. Here, we hypothesized slight alterations in experimental design and worm handling could explain the observed discrepancies. To test this hypothesis, we collected and assessed data from over 1000 published C. elegans N2 lifespan assays as well as corresponding methodological meta-data. We find that mean N2 lifespans range from approximately 7 days to upwards of 35 days, despite laboratories disclosing seemingly comparable experimental conditions. We further demonstrate that, in addition to temperature, the use of the chemical sterilizer 5-fluoro-2'-deoxyuridine (FUDR) may change N2 lifespan. Additionally, we observed differences in average N2 lifespan from experiments originating from distinct geographic locations, indicating a potential effect of location-specific factors on experimental outcomes. Taken as a whole, our work indicates the sum of many small, rather than a few critical, differences in experimental conditions may account for the observed variance in N2 lifespan. We also find that the absence of standardized experimental methods and the insufficient disclosure of experiment details in the peer-reviewed literature limits the inter-lab comparability of published results. We thus propose the establishment of a succinct reporting standard for C. elegans lifespan experiments to increase the reliability and reproducibility, and thus scientific value, of these studies.

Keywords: Aging; C. elegans; Lifespan; N2; Reproducibility; Variation.


Figures

Fig. 1.
Fig. 1.
Levels of assay feature disclosed in analyzed data set. White. Assay features used in analysis. Gray: assay feature disclosed in more than 50% of publications but not used for analysis. Dark gray: assay feature disclosed in less than 50% of experiments and not used in analysis.
Fig. 2.
Fig. 2.
Variability of N2 lifespans in the published literature. A. Reported mean lifespan of all entries in the data set. Average reported N2 lifespan was 17.7 days, as represented by the solid black line. Each circle represents an individual experiment. Dashed line indicates two standard deviations from the mean. BF. Average lifespan on the respective day for the total data set (B), combination of assay conditions 1, 2, and 5 in Table 1 (C), and respective individual assay conditions (DF). Yellow indicates 1 standard deviation from the mean; blue represents 2 standard deviations from the mean. Survival above 100% and below 0% is not physiologically possible. G. Tukey-method boxplot for experiments at 20 °C, 25 °C, and 15 °C (assay conditions 1, 2, and 5, respectively, from Table 1). (For interpretation of the references to colour in this figure legend, the reader is referred to the web version of this article.)
Fig. 3.
Fig. 3.
Analysis of the effect of 5-fluoro-2′-deoxyuridine on N2 lifespan. A-B. Average lifespan on each respective day for experiments without (A) and with (B) FUDR at 20 °C. C. Tukey-method boxplot comparing experiments with and without FUDR at 20 °C. D-E. Average lifespan on the respective day for experiments without (D) and with (E) FUDR at 25 °C. F. Tukey-method boxplot comparing mean lifespan of experiments with and without FUDR at 25 °C. G. Scatter plot comparing the frequency of FUDR concentrations observed in the dataset. H. Average lifespan on each respective day for commonly used FUDR concentrations. Error bars represent 1 standard deviation from the mean at 20 °C. I. Tukey-method boxplot of reported mean lifespans of 4 commonly used FUDR concentrations at 20 °C. All experiments were on solid NGM agar. For A-B, D-E, yellow indicates 1 standard deviation from the mean; blue indicates 2 standard deviations from the mean. Survival above 100% and below 0% is not physiologically possible. (For interpretation of the references to colour in this figure legend, the reader is referred to the web version of this article.)
Fig. 4.
Fig. 4.
The effect of worm transfers on N2 lifespan. A-C. Average survival curves for the respective day of adulthood (A-B) and Tukey-method boxplot of reported mean lifespans (C) for experiments which transformed worms less than (“(−) manipulation”) or more than (“(+) manipulation”) twice during the experiment. D-E. Average survival curves from the “manipulation” group which transferred worms everyday (D) or every 2–3 days (E) during the reproductive period. F. Overlay of the survival curves of D-E. Error bars represent 1 standard deviation from the mean. For A-B, D-E, yellow indicates 1 standard deviation from the mean and blue indicates 2 standard deviations from the mean. Survival above 100% and below 0% is not physiologically possible. All experiments were done on solid NGM at 20 °C. (For interpretation of the references to colour in this figure legend, the reader is referred to the web version of this article.)
Fig. 5.
Fig. 5.
Distinct geographic locations show differences in N2 lifespan. A. Analysis of countries experiments were performed in the entire dataset. BF. Average survival curves for the United States (B), China (C), Germany (D), Republic of Korea (E), and Japan (F) at 20 °C on solid NGM. Yellow indicates 1 standard deviation from the mean and blue indicates 2 standard deviations from the mean. Survival above 100% and below 0% is not physiologically possible. G-H Tukey-method boxplots of the reported mean N2 lifespans of different countries (G) and states of the United States (H). CA: California; MA: Massachusetts; NY: New York; WA: Washington; TX: Texas; MI: Michigan. (For interpretation of the references to colour in this figure legend, the reader is referred to the web version of this article.)

References

    1. Aitlhadj L, Stürzenbaum SR, 2010. The use of FUdR can cause prolonged longevity in mutant nematodes. Mech. Ageing Dev. 131 (5), 364–365. 10.1016/j.mad.2010.03.002. - DOI - PubMed
    1. Altun Z, Hall D, 2009. Introduction. Worm Atlas. 10.3908/wormatlas.1.1. - DOI
    1. Ankeny RA, 2001. The natural history of Caenorhabditis elegans research. Nat Rev Genet. 2 (6), 474–479. 10.1038/35076538. - DOI - PubMed
    1. Barbour V, 2002. Celebrating death—the 2002 Nobel prize in physiology or medicine. Lancet 360 (9340), 1117. 10.1016/S0140-6736(02)11240-2. - DOI - PubMed
    1. Brenner S, 1974. The genetics of Caenorhabditis elegans. Genetics 77 (1), 71–94. - PMC - PubMed

Publication types

Substances