. 2022 Jan;601(7893):440-445.
doi: 10.1038/s41586-021-04228-1. Epub 2021 Nov 18.

Genome surveillance by HUSH-mediated silencing of intronless mobile elements

Affiliations

Genome surveillance by HUSH-mediated silencing of intronless mobile elements

Marta Seczynska et al. Nature. 2022 Jan.

Abstract

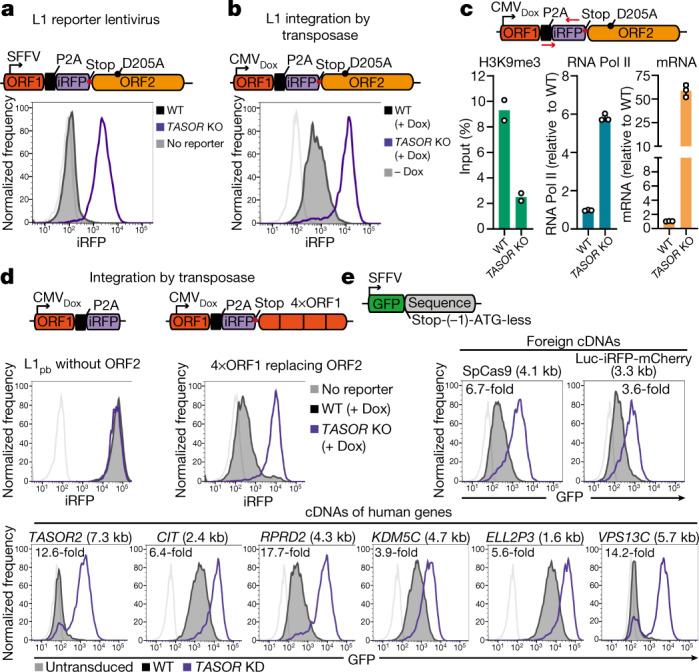
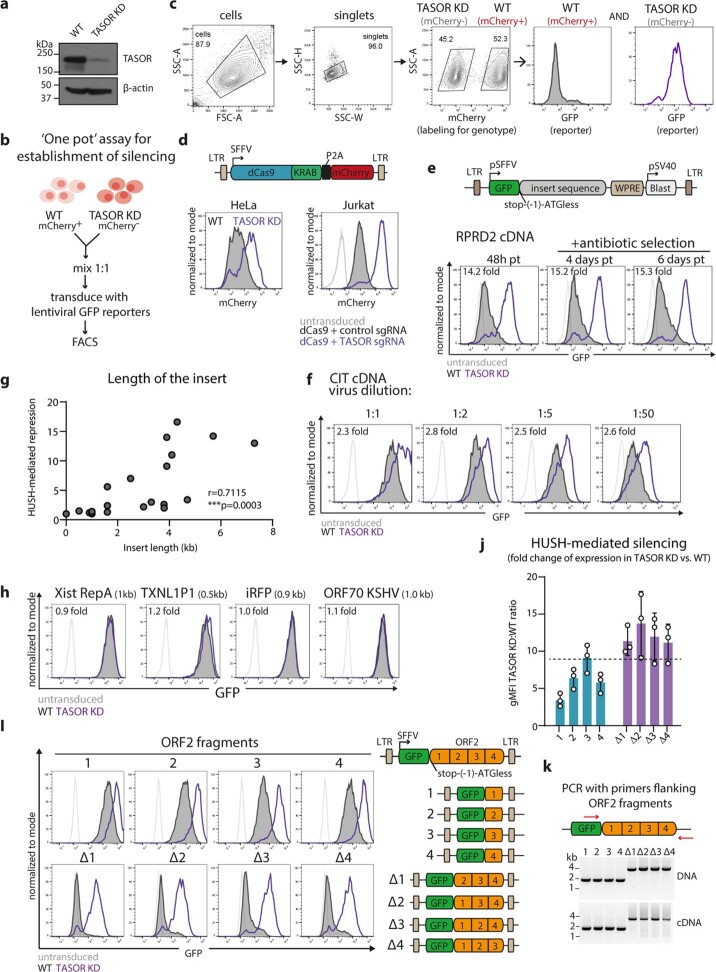
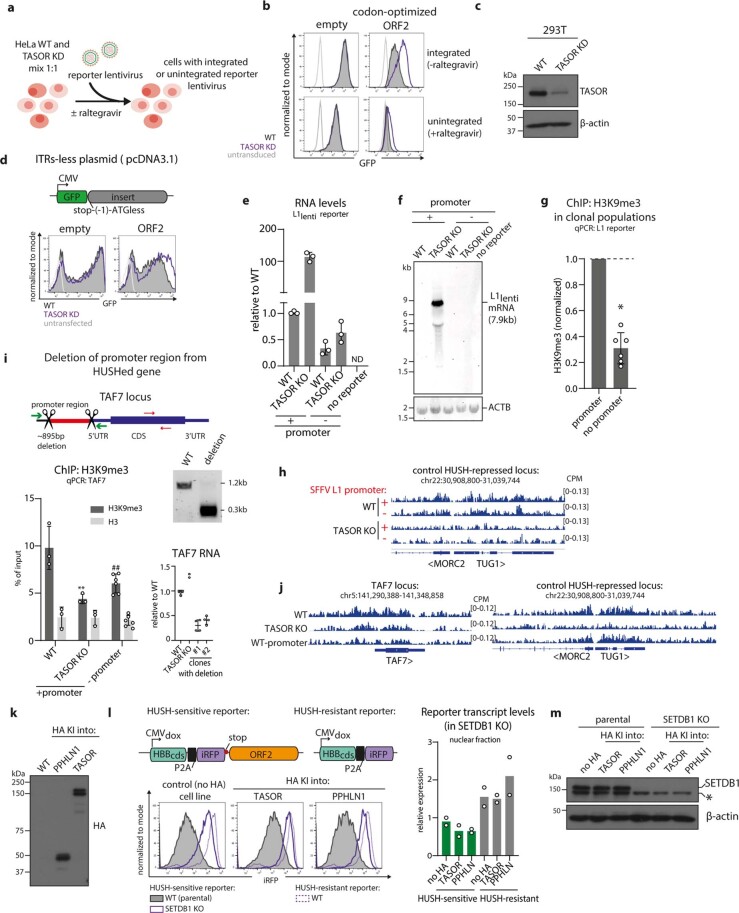
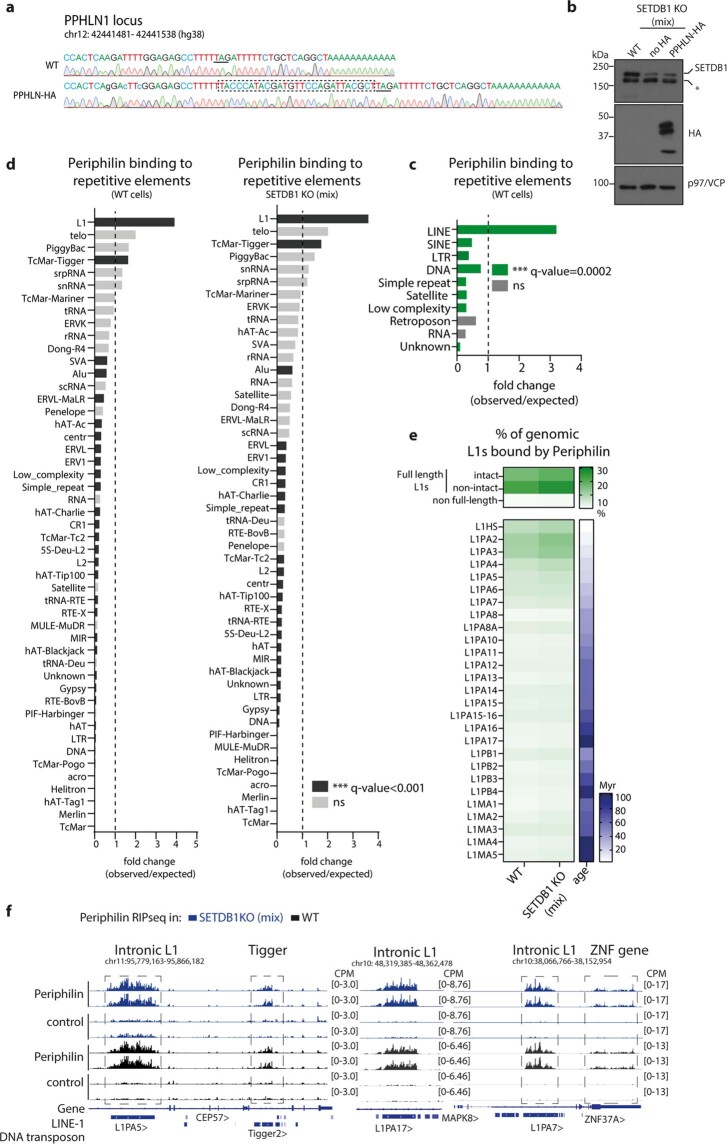
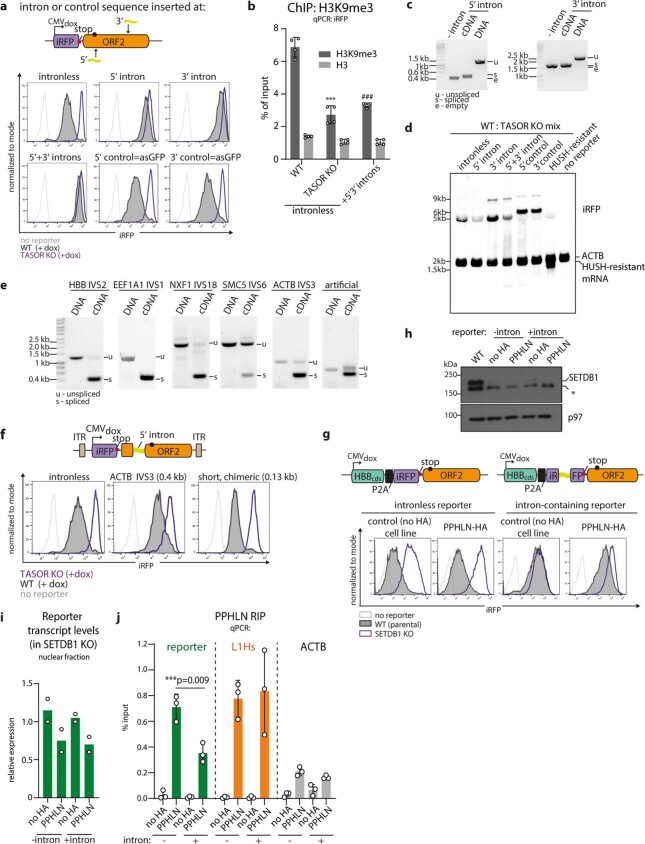
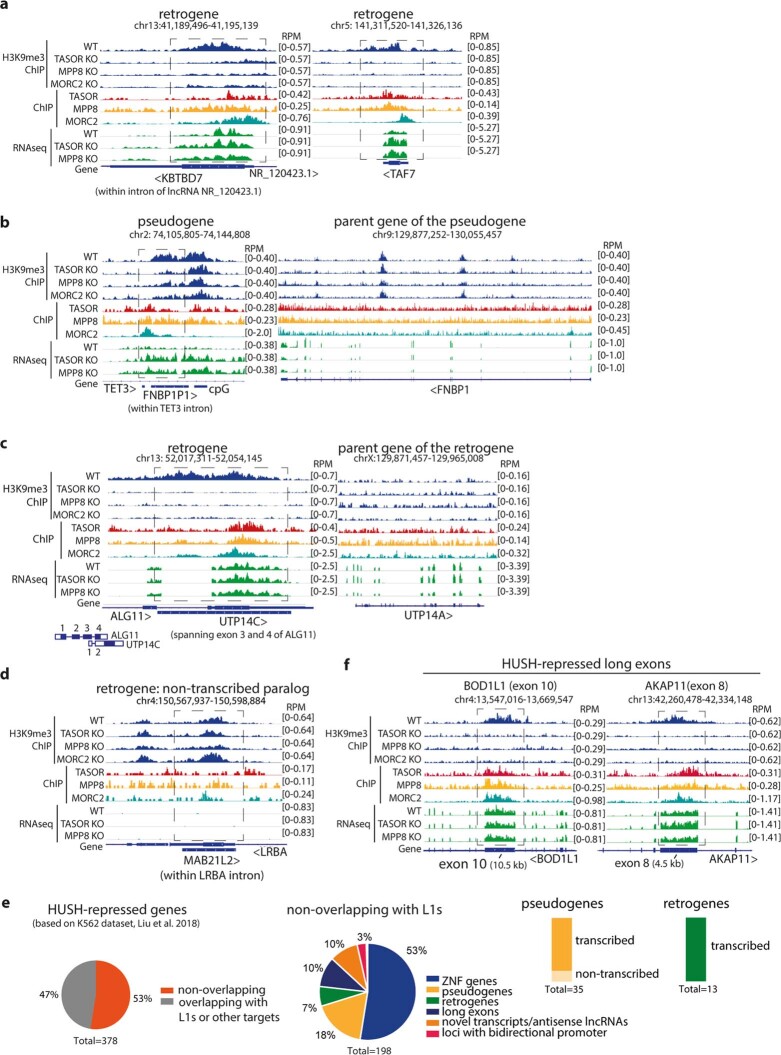
All life forms defend their genome against DNA invasion. Eukaryotic cells recognize incoming DNA and limit its transcription through repressive chromatin modifications. The human silencing hub (HUSH) complex transcriptionally represses long interspersed element-1 retrotransposons (L1s) and retroviruses through histone H3 lysine 9 trimethylation (H3K9me3)1-3. How HUSH recognizes and initiates silencing of these invading genetic elements is unknown. Here we show that HUSH is able to recognize and transcriptionally repress a broad range of long, intronless transgenes. Intron insertion into HUSH-repressed transgenes counteracts repression, even in the absence of intron splicing. HUSH binds transcripts from the target locus, prior to and independent of H3K9me3 deposition, and target transcription is essential for both initiation and propagation of HUSH-mediated H3K9me3. Genomic data reveal how HUSH binds and represses a subset of endogenous intronless genes generated through retrotransposition of cellular mRNAs. Thus intronless cDNA-the hallmark of reverse transcription-provides a versatile way to distinguish invading retroelements from host genes and enables HUSH to protect the genome from 'non-self' DNA, despite there being no previous exposure to the invading element. Our findings reveal the existence of a transcription-dependent genome-surveillance system and explain how it provides immediate protection against newly acquired elements while avoiding inappropriate repression of host genes.


Conflict of interest statement

S.M.C. is an employee of AstraZeneca. All other authors declare no competing interests.

Figures

Fig. 1
Fig. 1. Diverse intronless transgenes are HUSH-repressed.
a, Repression of L1 reporter lentivirus in wild-type (WT) (black) or TASOR-knockout (KO) (purple) HeLa cells, measured by flow cytometry. b, c, L1 reporter integrated by piggyBac transposase. b, Doxycycline (Dox)-induced expression in wild-type and TASOR KO HeLa cells measured by flow cytometry. CMV, cytomegalovirus promoter. c, Chromatin immunoprecipitation with quantitative PCR (ChIP–qPCR) assays of H3K9me3 (left; mean of n = 2 biological replicates ± s.d.) and RNA polymerase II (Pol II) (middle; mean of n = 3 biological replicates ± s.d.) in wild-type and TASOR KO HeLa cells at the reporter. L1 transcript levels assayed by quantitative PCR with reverse transcription (RT–qPCR) (right; mean of n = 3 technical replicates ± s.d.). d, Doxycycline-induced expression of piggyBac reporter without ORF2 sequence (left) and with ORF2 sequence (4 kb) replaced by 4×ORF1 (4×1 kb in size) (right) integrated into wild-type or TASOR KO HeLa cells. e, HUSH-mediated repression of GFP lentiviral reporters bearing different untranslated cDNA sequences measured by flow cytometry 72 h after transduction. Length of the cDNA sequence is indicated in brackets and fold change of reporter expression in TASOR KD and wild-type cells measured by geometric mean fluorescence is indicated on the graph. Frequency is normalized to mode (a, b, d, e).
Fig. 2
Fig. 2. HUSH binds target RNA and initiates silencing before DNA integration.
a, HUSH-mediated repression of non-integrated reporters. Left, HUSH-mediated repression of integrated and non-integrated GFP reporter lentiviruses with no insert (empty) or with synthetic ORF2 measured by flow cytometry 24 h after transduction and calculated as the ratio of reporter expression in wild-type and TASOR knockdown (KD). Data are mean of n = 3 biological replicates ± s.d.; two-sided ***P = 0.002, **P = 0.008 versus corresponding no-insert sample, unpaired t-test with Welch’s correction. Right, flow cytometry histograms showing expression from GFP lentiviral plasmids containing different untranslated sequences transfected into wild-type or TASOR KD 293T cells. gMFI, geometric mean fluorescence intensity. b, Top, genome browser track depicting input and H3K9me3 chromatin immunoprecipitation with sequencing (ChIP-seq) signal over the unique fragment of the SFFV-driven or promoterless L1 reporter integrated into wild-type and TASOR KO Hela cells. Bottom, ChIP–qPCR quantifying H3K9me3 and total histone H3 levels at a SFFV-driven or promoterless L1 lentiviral reporter integrated into wild-type and TASOR KO HeLa cells. Data are mean of n = 3 biological replicates (independent polyclonal integrations of the reporters) ± s.d.; ***P = 0.0006, **P = 0.002, *P = 0.003 versus wild-type promoter, paired two-tailed t-test. Red arrows indicate position of the primers used for subsequent quantitative PCR. c, RIP in SETDB1 KO 293T cells with haemagglutinin (HA) tag knocked into TASOR or PPHLN1 locus, showing periphilin and TASOR association with the indicated RNAs (see Extended Data Fig. 4k–m for more details). Data are mean ± s.d.; n = 3 independent experiments, normalized to input. d, Enrichment of periphilin RIP sequencing (RIP-seq) peaks at different repetitive elements in SETDB1 KO (mix) cells. SETDB1 KO (mix) is a polyclonal cell pool after SETDB1 CRISPR–Cas9. Significant enrichment is defined as a fold change score above 1 with empirical Benjamini–Hochberg adjusted one-sided P-values (q); ***q = 0.0002 e, Genome browser tracks depicting periphilin and control RIP-seq signal over intronic L1 elements in wild-type and SETDB1 KO (mix) cells. Source data
Fig. 3
Fig. 3. Introns protect against HUSH, even in the absence of intron splicing.
HUSH-mediated repression of intronless and intron-containing iRFP-ORF2 piggyBac reporters. a, b, Second intron from the human β-globin gene (HBB IVS2) cloned within the iRFP gene. a, Flow cytometry histograms showing expression in wild-type and TASOR KO HeLa cells. b, ChIP–qPCR quantification of H3K9me3 and total histone H3 at reporters in wild-type and TASOR KO HeLa cells. Data are mean of n = 3 independent experiments ± s.d.; **P < 0.008, *P = 0.02 versus intronless wild type, ratio-paired two-tailed t-test. c, HUSH-mediated repression of reporter with intron(s) or control sequence cloned at the 5′ or 3′ of ORF2, measured by flow cytometry and shown as the ratio of reporter expression in TASOR KO and wild-type cells. Data are mean from n biological replicates ± s.d.; ***P ≤ 0.0001, one-way analysis of variance (ANOVA) post hoc pairwise comparisons versus no-intron condition with Bonferroni correction. d, Flow cytometry histograms showing expression from reporters with different introns from human genes or control sequences cloned at the 5′ end of ORF2. Intron size is shown in parentheses. BFP, blue fluorescent protein. e, Flow cytometry histograms showing expression from reporters with different HBB IVS2 mutant introns cloned 5′ of ORF2. Gel image (right) confirms that mutant introns are not spliced from the reporter. ss, splice site. f, Quantification of HUSH-mediated repression of reporters from Fig. 3d, e, Extended Data Fig. 8c by flow cytometry and calculated as the ratio of reporter expression in TASOR KO and wild-type HeLa cells. Data are mean of n biological replicates (independent polyclonal integrations of the reporters) ± s.d.; ***P ≤ 0.0001, *P = 0.044, **P = 0.009, one-way ANOVA post hoc pairwise comparisons versus intronless with Bonferroni correction. asGFP data is the same as in 5′ control from c.
Fig. 4
Fig. 4. Transcribed processed pseudogenes and retrogenes are bound and silenced by the HUSH complex.
a, Visualization of HUSH-dependent H3K9me3, HUSH–MORC2-occupancy and RNA sequencing in wild-type and HUSH KO K562 cells at representative loci of processed pseudogene and retrogene. Genome browser tracks are generated from publicly available BigWig files. Arrowheads indicate transcriptional direction of the gene. b, Volcano plots showing log2 fold change (log2 FC) of periphilin over control RIP-seq-normalized read counts for three gene categories: processed pseudogenes (left), intronless (middle) and intron-containing protein-coding genes (right); representative data from SETDB1 KO (mix) cells. For each data point, significance was determined after a comparative assessment of counts between conditions using negative binomial generalized linear models as implemented in edgeR. Multiple testing correction of significance was performed using the false discovery rate (FDR) method; n = 4 independent experiments. Only genes with periphilin RIP-seq signal greater than 0.3 RPKM are included (>0.3 reads per kilobase of transcript, per million mapped reads (RPKM) in each RIP-seq replicate from both SETDB1 KO (mix) and wild-type 293T cells). Genes with periphilin peaks overlapping L1 elements are excluded. Intronless protein-coding genes are defined as genes that produce only intronless isoforms. ZNFs, zinc finger family genes. c, Schematic of genome surveillance by the HUSH complex. HUSH recognizes long, intronless mobile DNA and targets it for transcriptional silencing. Host genes are protected against HUSH by the presence of introns (left of DNA strand). An average human protein-coding gene contains ten 6,355-bp-long introns35. Transcription of the target initiates HUSH-mediated repression: periphilin binds its specific target transcript, MPP8 recruits SETDB1 to deposit H3K9me3. Periphilin–RNA and MPP8–H3K9me3 interactions anchor HUSH at the target locus (area with dashed outline, right).
Extended Data Fig. 1
Extended Data Fig. 1. HUSH repression of the L1 transgene is independent of the integration mode and site and is due to the L1 ORF2 sequence.
a, Schematic of L1-iRFP reporter. The single mRNA transcript generates two proteins due to peptide bond skipping at the P2A sequence: the ORF1 (ORF1p) and iRFP (iRFPp). Changes in reporter transcription (e.g. due to H3K9me3-mediated silencing) affect iRFP expression. b, Western blot validating TASOR KO in HeLa cells with decreased levels of HUSH subunits periphilin and MPP8 due to TASOR depletion. β-actin is the loading control. c,d, Effect of reverse transcriptase inhibitor 3TC on the expression from L1 lentivirus (L1lenti) and L1 reporter integrated by transposase (L1pb). To validate that our reporters monitor expression only from the initial L1 integration, and no subsequent retrotransposition activity, we compared reporter expression in the presence and absence of reverse transcriptase inhibitor 3TC, which prevents retrotransposition and new L1 insertions. If expression from new insertions contributes to the iRFP signal, 3TC should decrease iRFP, in particular at time points ≥3 days. No such decrease in iRFP signal is observed with L1lenti and L1pb upon 3TC treatment, demonstrating that both reporters monitor expression from the initial L1 integration. As lentiviral integration requires reverse transcription, the 3TC was added 12h post transduction when reverse transcription will be complete. c, Flow cytometry histograms of expression of L1 lentivirus upon 50µM 3TC treatment in WT or TASOR KO cells (left). 3TC was added 12 h post transduction and expression measured at day 5 post transduction. As a positive control, 3TC was used at the time of transduction (c – right hand panel). The absence of iRFP signal confirms inhibition of RT activity. Quantification of expression using geometric mean fluorescence intensity (gMFI) (right). d, Flow cytometry histograms of expression of L1pb reporter in the absence or presence of 50µM 3TC after 5 days of dox induction (left). Quantification of expression using gMFI (right). e, Establishment of repression of L1 reporter lentivirus in WT and HUSH KOs: TASOR, MPP8 or periphilin KO HeLa cells, and KOs of HUSH-effectors MORC2 and SETDB1. HUSH/HUSH effector KO (all GFP+) were mixed with WT cells and transduced with the L1-iRFP reporter at high multiplicity of infection (MOI). Expression of the reporter was measured by flow cytometry 72h post transduction. Western blot validating KOs with p97 as a loading control (bottom panel). * marks non-specific band. f, Schematic of lentiviral vector driven by dox-responsive promoter for expression of Human Immunodeficiency virus 2 (HIV-2) viral protein X (Vpx) to induce TASOR depletion (left panel). Western blot validating TASOR depletion 6 days after Vpx induction by dox with tubulin as a loading control (right panel). Flow cytometry histogram showing expression of integrated L1 lentivirus reporter before and after TASOR depletion by Vpx (bottom panel). g, Expression of L1 reporter lentivirus in: WT HeLa (WT+reporter) (grey histogram), HeLa cells in which TASOR was depleted after the integration of L1 lentivirus (+TASOR KD) (purple histogram) and re-expression of mCherry-TASOR (+TASOR KD +mCherry-TASOR) (grey, dotted histogram). This experiment was repeated in Jurkat cells with similar results. h, Northern blot showing increased mRNA from L1pb reporter in TASOR KO cells 24 h post dox induction using iRFP probe. Full-length L1pb mRNA is the predominant RNA produced from the L1pb reporter. i, The expression of reporters with ORF2 or ORF1 sequences placed downstream of GFP in WT or TASOR-depleted (TASOR KD; see Extended Data Fig. 2a) HeLa cells measured by flow cytometry (upper panel). HUSH-mediated repression of reporters with ORF2 or ORF1 sequences placed upstream of GFP. CRISPR–Cas9 of TASOR (TASOR KO) after reporter integration (bottom panel). j, Northern blot analysis of mRNAs produced from L1pb reporter in which ORF2 (4kb) sequence was replaced by 4 tandem repeats of ORF1 (1kb). RNA was isolated from the mix of WT and TASOR KO cells and iRFP probe was used to detect reporter mRNA (Fig. 1d).
Extended Data Fig. 2
Extended Data Fig. 2. HUSH-mediated repression of cDNAs and ORF2 fragments correlates with length of the transgene.
a, Western blot showing TASOR depletion in TASOR KD HeLa cells. b, Schematic of assay for the establishment of silencing of lentiviral transgenes. c, Schematic of the gating strategy in ‘one pot’ assay for establishment of silencing. mCherry+ WT and mCherry- TASOR KO HeLa cells were defined based on the mCherry signal and the GFP signal for each of these subpopulations is subsequently plotted on the histogram. d, HUSH-mediated repression of the lentivirus encoding fusion of endonuclease dead Cas9 and KRAB domain (dCas9-KRAB) in HeLa (left) or Jurkat cells (right) measured by flow cytometry. mCherry fluorescence reports mRNA levels from the reporter. For Jurkat cells, a sgRNA targeting the TSS of TASOR was used to deplete TASOR. e, HUSH-mediated repression monitored at different time points post infection and after selection with the antibiotic for the transgene-delivered antibiotic resistance gene. (f) HUSH-mediated repression monitored 48h after transduction of HeLa WT and TASOR KD with lentiviral reporter at different range of MOI. e and f were repeated with different reporters with similar results. g, Scatter plot illustrating a significant correlation between HUSH-mediated repression and length of the insert sequence in the GFP reporters. Each point represents a reporter with different cDNA sequence. Pearson correlation r = 0.7115, two-sided p = 0.0003; 95% CI [0.40 to 0.87] h, Expression of GFP non-coding lentiviral reporters bearing different short cDNA sequences in WT and TASOR KD HeLa cells measured by flow cytometry 72h post transduction. i, HUSH-mediated repression of GFP bearing the indicated untranslated ORF2 fragments measured by flow cytometry. j, Quantification of the HUSH-mediated repression of GFP untranslated reporters bearing full length ORF2 or ORF2 fragments, n = 3 biological replicates ±SD (left). k, RT-PCR analysis of transcripts from GFP reporters bearing ORF2 fragments with primers flanking ORF2 fragments (right). Product sizes corresponding to full length transcripts are 1.7 kb and 3.8 kb for reporters with 1-4 fragments and ∆1-4 fragments respectively. Source data
Extended Data Fig. 3
Extended Data Fig. 3. Susceptibility to HUSH-repression is governed by high adenine content in the sense strand and transgene length.
a, Scatter plot illustrating the relationship between HUSH-mediated repression and AT content of the insert sequence in the GFP reporter. Each point represents a reporter with different cDNA sequence. Reporters were assigned into three groups according to the length of the insert cDNA sequence (orange, green and grey) and Pearson r correlation was quantified for each group. b, Expression of GFP reporter bearing untranslated sequence of native or codon-optimized ORF2 (with increased GC content) in WT and TASOR KD HeLa cells measured by flow cytometry. Quantification of n = 3 independent experiments in ‘e’. c, Scatter plots illustrating the relationship between HUSH-mediated repression and nucleotide content of the insert sequence in the GFP reporter (left) with the significance of the two-sided Pearson correlation between HUSH-mediated repression and nucleotide content (right). Dotted line on the graph corresponds to p-value = 0.05; for exact p-value see source data. d, HUSH-mediated repression of GFP lentiviral reporters bearing native ORF2 (A-rich) or reverse-complement ORF2 sequence (T-rich) measured 4 days post transduction (right). To prevent premature transcription termination, two putative polyadenylation sites were deleted from ORF2 sequence (AATAAA at position 228-233 of reverse complement ORF2 and ATTAAA at 123-129). Relative contribution of A and T nucleotides to the nucleotide content of the insert (left). e, Quantification of the HUSH-mediated repression of GFP untranslated reporters bearing native, codon-optimized (codon opt.) or reverse complement (reverse compl.) ORF2; n = 4 (native and codon opt.) and n = 2 (for reverse compl.) biological replicates ±SD, normalized to gMFI of native ORF2 reporter in WT cells. f, The expression of transposase-integrated reporters bearing ORF2 or reverse complement ORF2 sequence in WT or TASOR KO HeLa cells measured by flow cytometry. g, Analysis of mRNA produced from reporters in f, by Northern blot. RNA was isolated from the mix of WT and TASOR KO cells. h, Quantification of HUSH-mediated repression of L1pb reporter in which ORF2 sequence was replaced by 1 ORF1, 3 ORF1 or 4 ORF1 tandem repeats. mean of n = 3 biological replicates ± SD ***p < 0.001 (for exact p value see source data); one-way ANOVA post-hoc pairwise comparisons with Bonferroni correction. Source data
Extended Data Fig. 4
Extended Data Fig. 4. HUSH represses non-integrated DNAs and requires transcription to maintain repression.
a, Transduction of cells with lentiviral reporter in the presence or absence of the integrase inhibitor raltegravir to test the establishment of reporter silencing in the presence or absence of reporter integration. b, Representative flow cytometry histograms of expression from integrated or unintegrated lentiviral reporter in WT or TASOR KD HeLa cells. As unintegrated lentivirus is poorly expressed, the reporter with the synthetic ORF2 sequence was used since it provides higher expression than the native ORF2 sequence. c, Western blot showing CRISPR/Cas9 mediated depletion of TASOR in the population of 293T cells (TASOR KD). β-actin is a loading control. d, Flow cytometry histograms of expression from pcDNA3.1 plasmid transfected into WT or TASOR KD 293T cells. In contrast to lentivirus or plasmids for piggyBac-mediated integration, pcDNA3.1 lacks terminal repeats (ITRs). e, RT-qPCR quantifying transcript levels from SFFV-driven or promoter-less L1 lentiviral reporter integrated into WT and TASOR KO cells. Normalized to WT with SFFV-driven L1. n = 3 biological replicates (independent polyclonal integrations of the reporters) ±SD f, Northern blot analysis of mRNA produced from SFFV-driven or promoter-less L1 lentiviral reporter in WT and TASOR KO cells. g, ChIP-qPCR quantifying H3K9me3 at promoter-less L1 lentiviral reporter in clonal WT HeLa populations normalized to polyclonal WT population with SFFV-driven L1. n = 6 biological replicates ± SD, *p = 0.03 one-sample Wilcoxon test h, Genome browser track depicting H3K9me3 ChIPseq signal over control, HUSH-repressed locus in WT and TASOR KO HeLa cells harbouring SFFV-driven or promoter-less L1 reporter - related to Fig. 2b. i, CRISPR/Cas9-mediated deletion of the TAF7 promoter region (schematic, upper left) reduces TAF7 transcription measured by RT-qPCR and normalized to WT (bottom right). ChIP-qPCR quantifying H3K9me3 and total H3 at the locus (bottom left). n = 2 biological replicates x 3 independent experiments ± SD; **p = 0.0023, ##p = 0.009 one-way ANOVA post-hoc pairwise comparisons vs WT with Bonferroni correction. Cas9-cleavage sites indicated by scissors, green arrows indicate primers used to validate the deletion by genomic PCR and red arrows indicate position of the primers used in ChIP-qPCR. Gel image (upper right) confirms promoter deletion. j, Genome browser track depicting H3K9me3 ChIPseq signal over TAF7 locus or control HUSH-repressed locus in WT, TASOR KO HeLa and HeLa with deletion of TAF7 promoter. k, Western blot of HeLa cells with HA knocked into endogenous locus of TASOR or PPHLN1. i, Schematic of HUSH-sensitive and HUSH-resistant reporter constructs (upper schematic). Expression from the reporters is driven by dox-responsive promoter. Human beta globin coding sequence (HBBcds), instead of ORF1 as in the standard L1 reporter, is followed by P2A-iRFP and, for the HUSH sensitive reporter, by ORF2 sequence. HUSH-sensitive and HUSH-resistant reporters were integrated into control, HA-TASOR, PPHLN1-HA cell lines - resulting in six independent cell lines in total. In cell lines with the HUSH-sensitive reporter, SETDB1 function was then disrupted by CRISPR/Cas9-mediated knockout and mixed, polyclonal KO populations were used for RIP-qPCR. Flow cytometry histograms of expression from HUSH-sensitive or HUSH-resistant reporter in HA KI and control cell lines 48h after induction with dox (bottom). For the HUSH-sensitive reporter the expression is shown in WT and SETDB1 KO cells. Right panel: Relative levels of transcripts from reporters for RIP-qPCR (in SETDB1 KO) in nuclear fraction normalized to ACTB; n = 2 technical replicates m, Validation of SETDB1 depletion by CRISPR/Cas9 in TASOR or PPHLN1 HA-KI cells by western blot. β-actin as loading control. * marks non-specific band.
Extended Data Fig. 5
Extended Data Fig. 5. Periphilin specifically binds transcripts from evolutionary young, full-length L1 elements in WT and SETDB1-depleted cells.
a, Sequencing tracks showing insertion of sequence of HA-tag (marked as dashed box) into PPHLN1 locus. Underlined is the stop codon. Nucleotide substitutions to make modified locus sgRNA-resistant are marked as small letters. b, Western blot showing SETDB1 depletion in SETDB1 KO (mix) Periphilin-HA HEK293Ts and control HEK293Ts. p97/VCP as a loading. c,d, Enrichment of periphilin RIP-seq peaks at different repetitive elements in c, WT cells and d, WT (left) and SETDB1 KO (mix) (right). Significant enrichment is defined as a fold change score greater than one with Benjamini–Hochberg empirical adjusted one-sided p-value calculated using simulations and genomic association testing, ***q < 0.001 (for exact p-values see source data). e, Fraction of full length, non-full length L1s and L1s from different families overlapping with periphilin RIPseq peaks. Full length L1s definitions are based on L1Base,. Blue heatmap indicates age of L1 families predicted from the phylogenetic analysis. Periphilin-bound L1Hs may be underestimated in comparison to L1PA2-L1PA3 due to lower mappability of L1Hs as this is the least sequence-divergent L1 family. f, Genome browser tracks showing periphilin RIP signal over intronic L1s, Tigger DNA transposon and 3’UTR of ZNF37A Source data.
Extended Data Fig. 6
Extended Data Fig. 6. Introns protect different reporters from HUSH and are continuously required to prevent repression.
a, Quantification of H3K9me3 and RNAseq signal over endogenous genes in WT and TASOR KO K562 cells from a publicly available dataset . None of these endogenous genes are HUSH-repressed, unlike lentiviral reporters containing cDNA sequences of these genes. b, Northern blot analysis of mRNAs produced from intronless reporter or reporter with HBB IVS2 cloned within the iRFP gene. ACTB is a loading control. c, Flow cytometry histograms showing expression from GFP and GFP-ORF2 intronless or intron-containing lentiviral reporters in WT and TASOR KD HeLa cells 72h post transduction (bottom). Schematic of the construct (top). To prevent intron splicing during transcription in the virus-producing cells, the reporter cassette driven by the SFFV promoter was cloned in reverse orientation with respect to lentiviral transcription. The polyadenylation signal (pA) in reverse orientation provides a signal for termination of transcription from the reporter cassette in transduced cells. ORF2 is untranslated and intron (HBB IVS2) is cloned 5’ of ORF2. SA-splice acceptor, SD-splice donor. d, HUSH-mediated repression of integrated intronless or intron-containing ORF2 piggyBac reporters measured by flow cytometry (histograms in centre panel) and calculated as the ratio of reporter expression in TASOR KO and WT HeLa (right). Expression from the reporter is driven by a dox-responsive CMV promoter. Reporters contain either human beta globin coding sequence or genomic sequence (containing 2 introns) followed by P2A-iRFP and ORF2 sequences (schematics on the left). A HUSH-resistant reporter without ORF2 is the negative control. n biological replicates (independent polyclonal integrations of the reporters) ± SD; ***p ≤ 0.0001, one-way ANOVA post-hoc pairwise comparisons vs –introns with Bonferroni correction. e, HUSH-mediated repression of integrated intronless or intron-containing Cas9 piggyBac reporters measured by flow cytometry (histograms in centre panel) and calculated as the ratio of reporter expression in TASOR KO and WT HeLa (right). Expression from the reporter is driven by a dox-responsive CMV promoter. Reporters contain either HBB coding sequence or genomic sequence (containing 2 introns) followed by P2A-iRFP and Cas9 sequences (schematics on left panel). A HUSH-resistant reporter without Cas9 is the negative control. n biological replicates (independent polyclonal integrations of the reporters) ± SD; ***p ≤ 0.0001, one-way ANOVA post-hoc pairwise comparisons vs –introns with Bonferroni correction. f, HUSH-mediated repression of reporter with intron removed by Cre-loxP recombination following the reporter integration (upper schematic). Flow cytometry histograms of expression from iRFP-ORF2 reporters driven by EF1a promoter: (i) intronless or (ii) reporter-bearing intron (HBB IVS2) flanked by loxP sites in the absence or presence of Cre expression (left). Gel image (right) confirms intron deletion.
Extended Data Fig. 7
Extended Data Fig. 7. Intron insertion reduces HUSH-mediated repression and Periphilin binding to reporter transcripts.
a, Representative flow cytometry histograms of expression from reporters in Fig. 3c in WT and TASOR KO HeLa cells. The 5’ and 3’ control (asGFP) is the antisense GFP ‘stuffer‘ sequence b, ChIP-qPCR quantifying H3K9me3 and total H3 levels at intronless or reporter with introns (HBB IVS2) inserted at 5’ and 3’ of ORF2 (from Fig. 3c and Extended Data Fig. 7a). n = 4 independent experiments ± SD; ***p = 0.0003 and ###p = 0.0006 vs –intron WT, ratio paired two-tailed t-test. c, Gel images confirming splicing of introns at 5’ and 3’ of ORF2 from iRFP-ORF2 reporter transcripts (from Fig. 3c and Extended Data Fig. 7a) by PCR. d, Northern blot analysis of mRNAs produced from reporters with intron or control sequence inserted 5‘and 3’ of ORF2 (~5kb), or HUSH-resistant reporter without ORF2 (~1.5kb). RNA was isolated from the mix of WT and TASOR KO cells. e, PCR analysis of splicing of different introns 5’ of ORF2 from iRFP-ORF2 reporter transcripts (from Fig. 3d and Extended Data Fig. 7f). f, Representative flow cytometry histograms of expression from iRFP-ORF2 reporter with introns from ACTB (0.4kb) or a short, chimeric intron (0.13kb) cloned 5’ of ORF2 in WT and TASOR KO HeLa cells. Experiment repeated independently with similar results; quantification of n = 3-4 biological replicates in Fig. 3f. g, Schematic of intronless and intron-containing reporter constructs for periphilin RIP-qPCR (upper schematic). Reporters were integrated into WT 293T or periphilin-HA 293Ts - resulting in four independent cell lines. SETDB1 function was disrupted by CRISPR/Cas9-mediated knockout and mixed, polyclonal KO populations were used for RIP-qPCR. Flow cytometry histograms of expression from reporters in PPHLN-HA and control cell lines 48h after induction with dox (bottom). h, Validation of SETDB1 depletion by CRISPR/Cas9 in PPHLN1 HA-KI cells by western blot. β-actin as loading control. * marks non-specific band. i, Relative levels of transcripts from reporters for RIP-qPCR (in SETDB1 KO) in nuclear fraction normalized to ACTB; n = 2 technical replicates. j, RIP-qPCR showing decreased association of periphilin with RNA from intron-containing reporter. L1Hs and ACTB RNA are a positive and negative control, respectively. Data are mean ± SD; n = 3 independent experiments; and normalized to input.***p = 0.0009 vs -intron, one-way ANOVA post-hoc pairwise comparison with Bonferroni correction.
Extended Data Fig. 8
Extended Data Fig. 8. Sequences engineered for efficient splicing do not protect against HUSH repression.
a, Schematic of intron mutations in reporters from Fig. 3e. b, Analysis of splicing of mutant introns inserted 5’ of ORF2 from iRFP-ORF2 reporter transcripts by PCR (from Fig. 3e). c, Representative flow cytometry histograms of expression from reporters containing spliced stuffer sequences in WT and TASOR KO HeLa cells.
Extended Data Fig. 9
Extended Data Fig. 9. Transcribed processed pseudogenes and protein coding retrogenes, but not their parent genes, are bound and silenced by HUSH.
Genome browser tracks showing HUSH-dependent H3K9me3, HUSH/MORC2-occupancy and RNA-seq in WT and HUSH KO K562 cells at: a, additional, representative loci of retrogenes; b, FNBP1P1 pseudogene (left) and its parent gene FNBP1 (right); c, UTP14C retrogene (left) and its parent gene UTP14A (right) d, at the locus of MAB21L2, a non-transcribed paralog of HUSH-repressed MAB21L1 retrogene, Data from . e, HUSH-repressed genes obtained from the dataset in ref. : 378 genes were obtained when there was at least 30% reduction of H3K9me3 signal in all 3 knockout cell lines: TASOR KO, MPP8 KO and MORC2 KO (log2 FC H3K9me3 TASOR KO/WT ≤ -0.5; FDR significance ≤ 0.05; determined after a comparative assessment of counts between conditions (n = 2) using negative binomial generalized linear models as implemented in edgeR and corrected for multiple comparisons using FDR method). 104 of them were ZNF genes (including 8 ZNF pseudogenes) and the rest were inspected in IGV to determine the most probable reason for HUSH-repression e.g. overlap with L1 elements or other HUSH targets, pseudogene, retrogene, genes with signal over long exons, novel transcripts or antisense lncRNAs or loci with bidirectional promoter. The 11 resulting genes remained unannotated, either excluded because of low, background H3K9me3 over region or mapping artifacts or the reason for repression was unclear. Fraction of pseudogenes and retrogenes transcribed (average RNA-seq signal of all samples above > 0.1 RPKM or within transcriptionally active gene) (right) f, Genome browser tracks showing HUSH-dependent H3K9me3, HUSH/MORC2-occupancy and RNA-seq in WT and HUSH KO K562 cells at representative long exons. Data from ref. . Source data
Extended Data Fig. 10
Extended Data Fig. 10. Periphilin specifically binds to transcripts from intronless genomic loci.
Genome browser tracks showing periphilin RIP signal over representative loci of processed pseudogenes a, and intronless genes b, in WT and SETDB1 KO (mix) HEK293T cells. c, Heatmap showing periphilin and control RIP signal (RPKM) over selected pseudogenes and their corresponding parent intron-containing genes. For DUXA and AGGF1 parent genes, two (DUXAP9, DUXAP10) and four (AGGF1P1, AGGF1P2, AGGF1P3, AGGF1P10) pseudogenes are depicted. Data from periphilin RIPseq in SETDB1 KO (mix) cells (median of n = 4 independent experiments). d, Metagene profile of fold change of periphilin and control mean RIP-seq signal over three categories of genes: processed pseudogenes, intronless genes and intron-containing protein-coding genes. Only genes with periphilin RIPseq signal greater than 0.3 RPKM are considered (in each four RIP replicates in SETDB1 KO (mix) and two replicates in WT 293Ts). Genes where the periphilin signal enrichment peaks overlap with L1 elements are excluded. TSS-transcription start site, TTS-transcription termination site. Intronless protein-coding genes produce only intronless isoforms. e, Genome browser track showing periphilin RIPseq signal over representative locus of intron-containing gene (BOD1L1) with a long exon in WT and SETDB1 KO (mix) HEK293Ts. Source data

References

    1. Tchasovnikarova IA, et al. Epigenetic silencing by the HUSH complex mediates position-effect variegation in human cells. Science. 2015;348:1481–1485. - PMC - PubMed
    1. Liu N, et al. Selective silencing of euchromatic L1s revealed by genome-wide screens for L1 regulators. Nature. 2018;553:228–232. - PMC - PubMed
    1. Robbez-Masson L, et al. The HUSH complex cooperates with TRIM28 to repress young retrotransposons and new genes. Genome Res. 2018;28:836–845. - PMC - PubMed
    1. Allshire RC, Madhani HD. Ten principles of heterochromatin formation and function. Nat. Rev. Mol. Cell Biol. 2018;19,:229–244. - PMC - PubMed
    1. Aravin A, et al. A novel class of small RNAs bind to MILI protein in mouse testes. Nature. 2006;442:203–207. - PubMed

Publication types