. 2021 Nov 19;6(1):397.
doi: 10.1038/s41392-021-00784-0.

GOLM1 exacerbates CD8+ T cell suppression in hepatocellular carcinoma by promoting exosomal PD-L1 transport into tumor-associated macrophages

Affiliations

GOLM1 exacerbates CD8+ T cell suppression in hepatocellular carcinoma by promoting exosomal PD-L1 transport into tumor-associated macrophages

Jinhong Chen et al. Signal Transduct Target Ther. .

Abstract

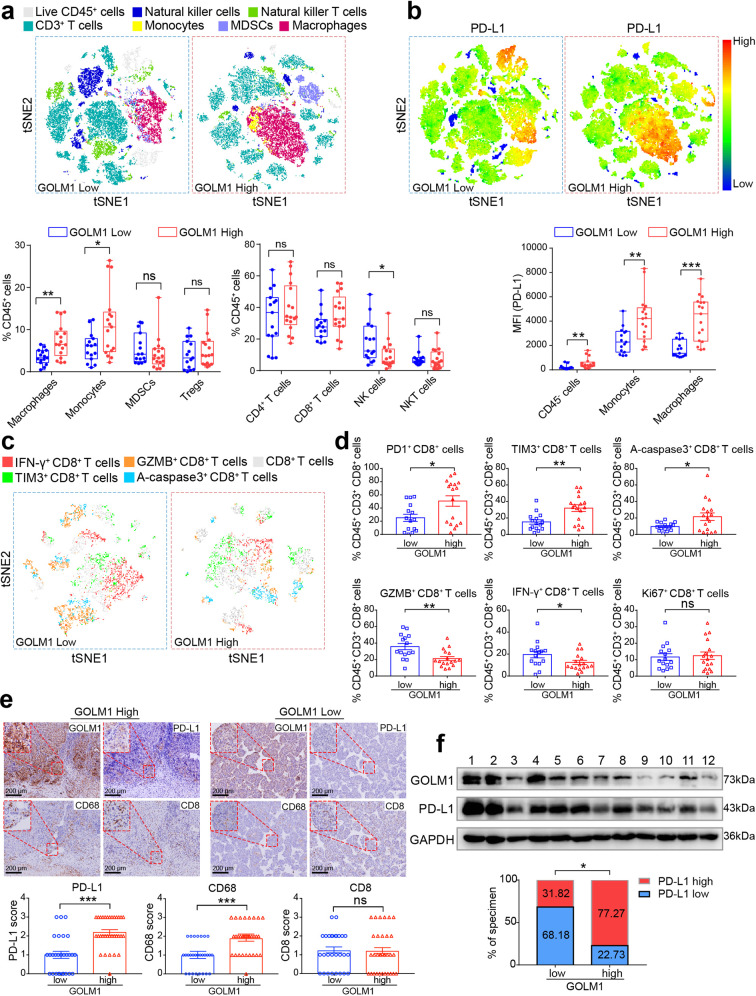
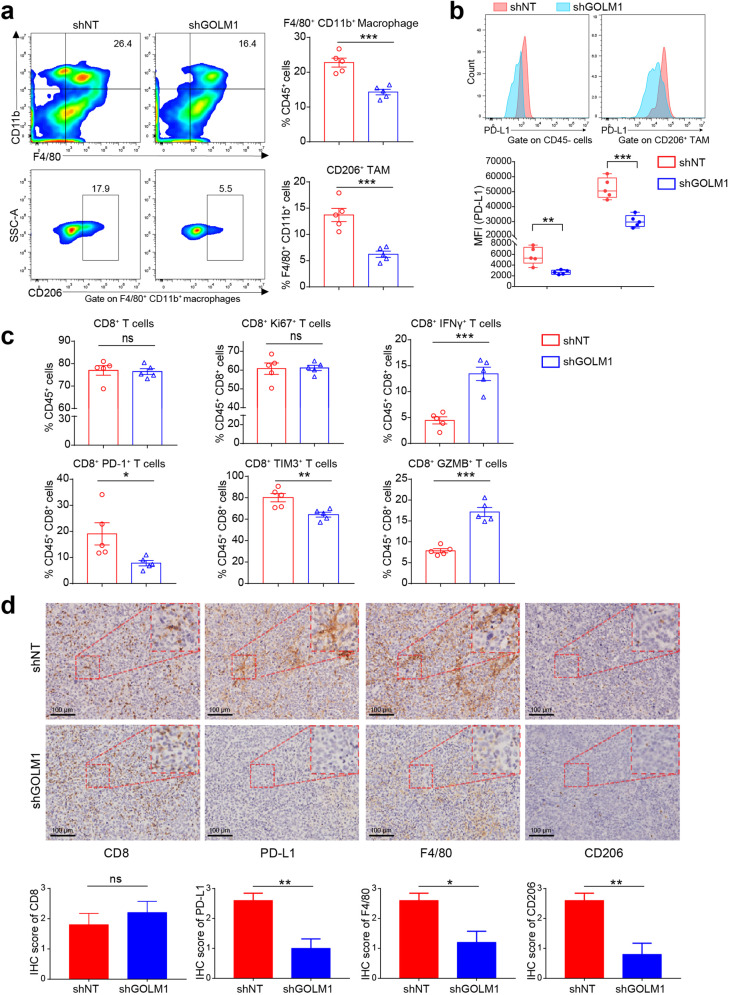
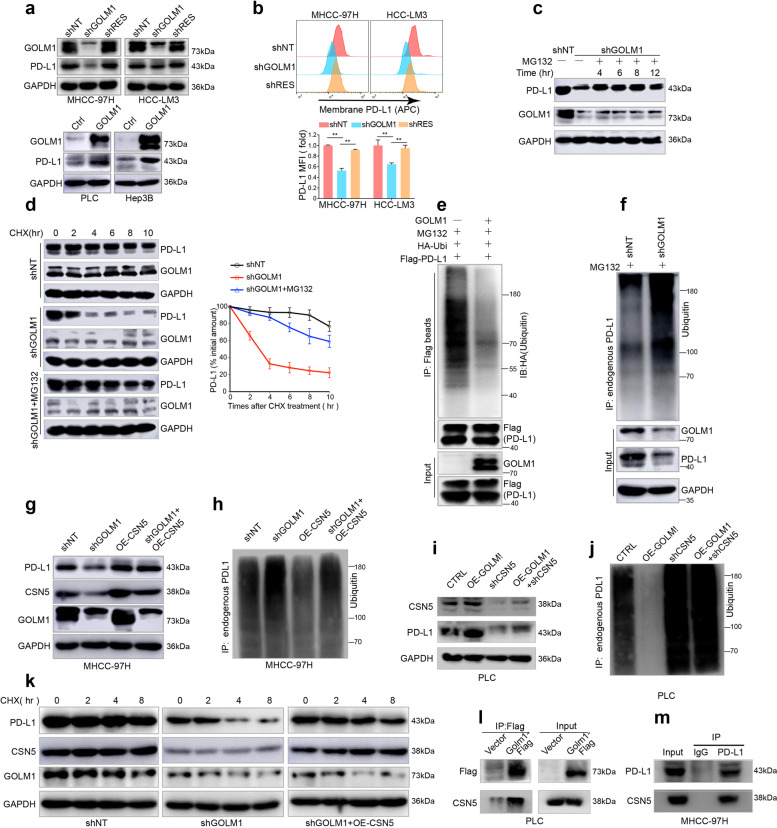
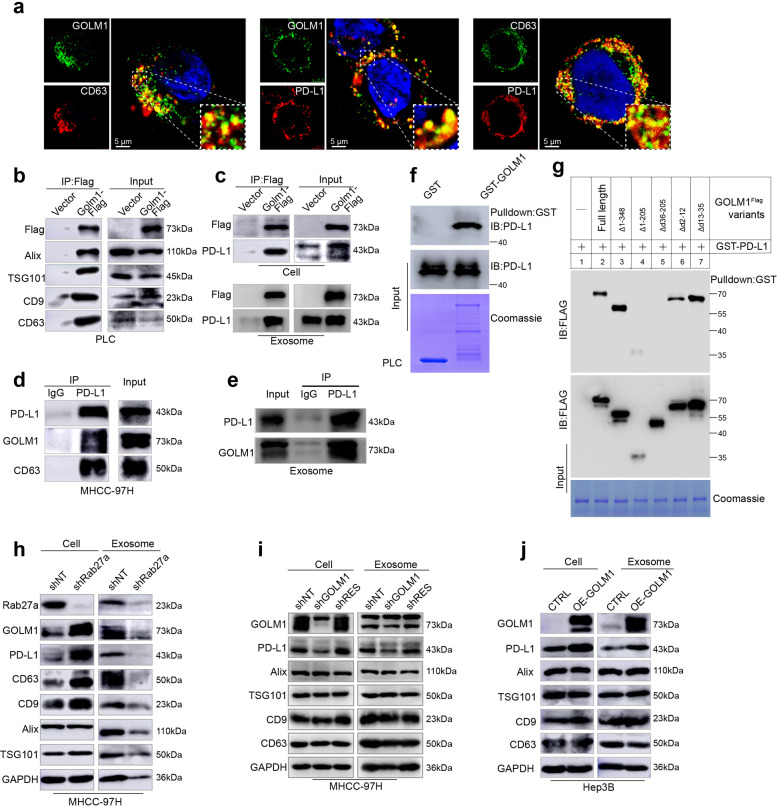
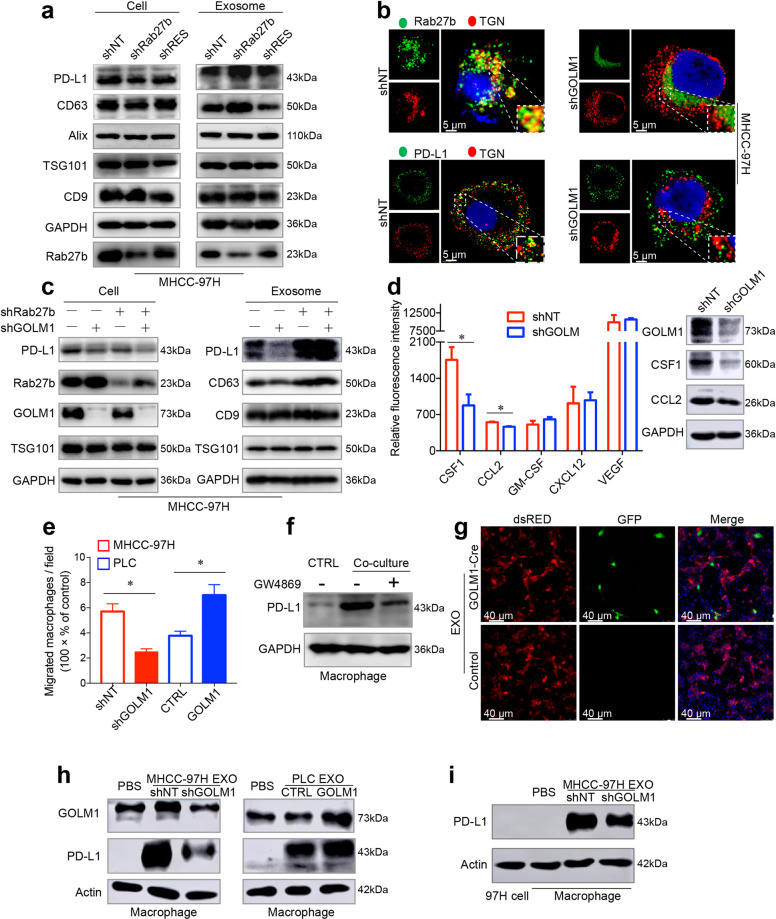
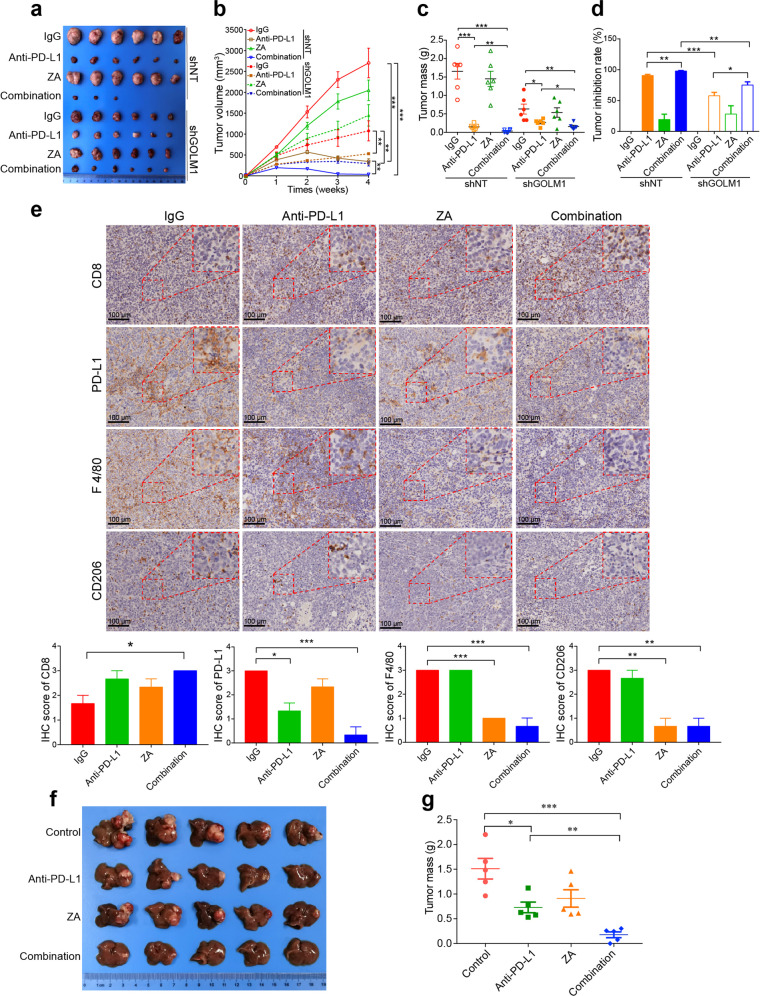
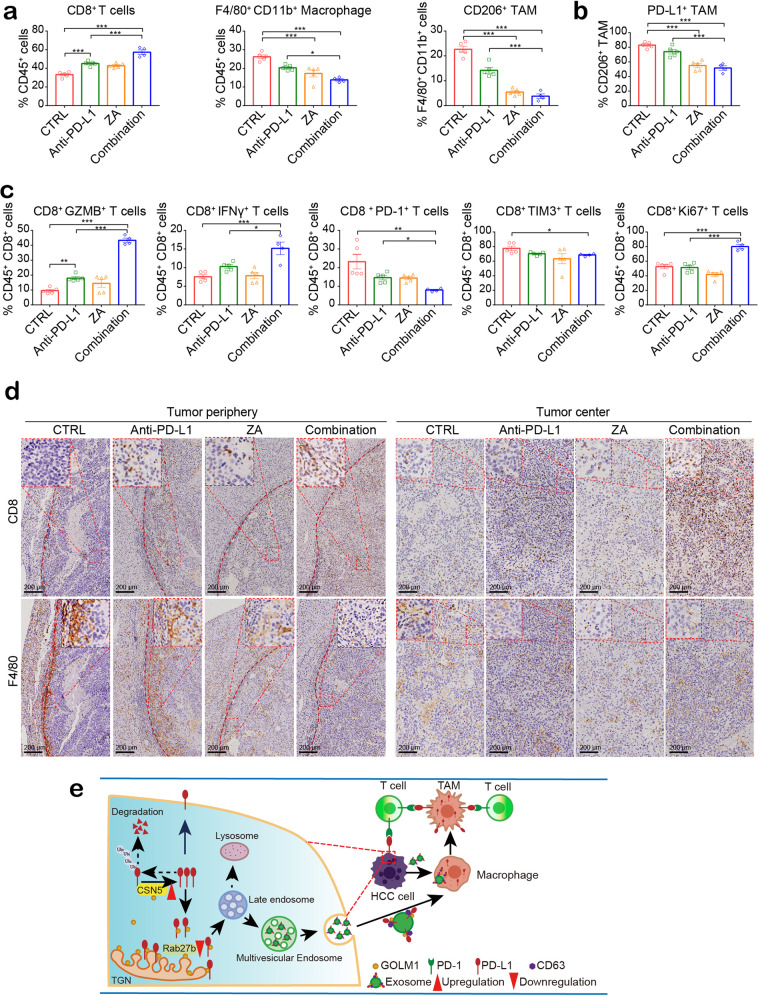
The immunosuppressive microenvironment plays an important role in tumor progression and immunotherapy responses. Golgi membrane protein 1 (GOLM1) is correlated to hepatocellular carcinoma (HCC) progression and metastasis. However, little is known about the role of GOLM1 in regulating the immunosuppressive environment and its impact on immunotherapeutic efficacy in HCC. In this study, GOLM1 was positively correlated with infiltrating tumor-associated macrophages (TAMs) expressed high levels of programmed death-ligand 1 (PD-L1) and CD8+ T cell suppression in HCC tissues. Both gain- and loss-of-function studies determined a close correlation between GOLM1 and immunosuppression. In the mechanism, GOLM1 promoted COP9 signalosome 5-mediated PD-L1 deubiquitination in HCC cells and increased the transport of PD-L1 into exosomes via suppression of Rab27b expression. Furthermore, co-culture with exosomes derived from HCC cells upregulated the expression of PD-L1 on macrophages. Zoledronic acid in combination with anti-PD-L1 therapy reduced PD-L1+ TAMs infiltration and alleviated CD8+ T cell suppression, resulting in tumor growth inhibition in the mouse HCC model. Together, our study unveils a mechanism by which GOLM1 induces CD8+ T cells suppression through promoting PD-L1 stabilization and transporting PD-L1 into TAMs with exosome dependent. Targeting PD-L1+ TAM could be a novel strategy to enhance the efficacy of anti-PD-L1 therapy in HCC.


Conflict of interest statement

The authors declare no competing interests.

Figures

Fig. 1
Fig. 1
Overexpression of GOLM1 is associated with the immunosuppressive microenvironment in HCC and immune-escape of tumor cells. a Differences in the immunophenotypes of infiltrating immune cells detected by flow cytometry in HCC tissues with high or low GOLM1 expression. t-Distributed Stochastic Neighbor Embedding (tSNE) map derived from flow cytometric analysis indicated the populations of the infiltrating immune cells, including CD3+ T cells (CD45+CD3+), natural killer (NK) cells (CD45+CD3CD56+), natural killer T (NKT) cells (CD45+CD3+CD56+), monocytes (CD45+CD14+), macrophages (CD45+CD14+CD68+), and myeloid-derived suppressor cells (MDSC) (CD45+CD11b+CD33+). Percentages of immune cell populations within CD45+ cells are shown on the bottom panel (n = 32). b PD-L1 expression profiles detected by flow cytometry in HCC tissues with high or low GOLM1 expression. tSNE map derived from flow cytometric analysis indicated the intensity of PD-L1 expression in CD45+ cells. Mean fluorescence intensity (MFI) of PD-L1 staining in tumor and stromal cells (CD45), monocytes (CD45+CD14+), macrophages (CD45+CD14+CD68+) is shown on the bottom panel (n = 32). c Representative tSNE map derived from flow cytometric analysis of CD8+ T cells in HCC tissues with high or low GOLM1 expression. d The functional state of CD8+ T cells was analyzed by flow cytometric quantification of GZMB+, IFN-γ+, PD-1+, TIM3+, Ki67+, and active-caspase3+ cells in HCC tissues with high or low GOLM1 expression (n = 32). e The differences of CD68 (macrophages), CD8 (CD8+ T cells), and PD-L1 levels detected by immunohistochemical staining (IHC) in human HCC tissues with high or low GOLM1. Representative IHC images for GOLM1, CD68, PD-L1, and CD8 expression in HCC tissues with high or low GOLM1 expression (n = 60) are shown on the top panel. The statistical analysis of IHC score is shown on the bottom panel. f The levels of GOLM1 and PD-L1 were detected by Western blot in HCC tissues and normalized against those of GAPDH using a computerized image system (Image-Pro Plus 6.0). Intensity higher than the median level was defined as high expression. The statistical analysis of quantification is shown on the bottom panel (n = 44). *P < 0.05, **P < 0.01, ***P < 0.001, ns: no significant
Fig. 2
Fig. 2
GOLM1 promotes TAM infiltration and PD-L1 expression on TAM in HCC. a Flow cytometric analysis of the infiltrated macrophages (F4/80+CD11b+) and TAMs (F4/80+CD11b+CD206+) in tumor tissues of subcutaneous implantation models of C57BL/6 mice with Hepa1-6-shNT or Hepa1-6-shGOLM1 cells (n = 5). b Flow cytometric analysis of PD-L1 expression in tumor and stromal cells (CD45), and TAMs (F4/80+CD11b+CD206+) in tumor tissues of subcutaneous implantation models of C57BL/6 mice (n = 5). c Flow cytometry analysis of the number and functional state of CD8+ T cells in the subcutaneous implantation models of C57BL/6 mice. Inhibitory receptors (PD-1 and TIM-3), the ability to produce effector cytokines (IFN-γ and GZMB), and proliferation (Ki67) of CD8+ T cells were detected to evaluate the functional state of T cells (n = 5). d The densities of CD8, PD-L1, F4/80, and CD206 were consistently observed by IHC staining. The quantification is shown on the bottom panel (n = 5). *P < 0.05, **P < 0.01, ***P < 0.001, ns: no significant
Fig. 3
Fig. 3
GOLM1 upregulates PD-L1 expression via CSN5-mediated PD-L1 deubiquitination in HCC cells. a The GOLM1 expression levels and the corresponding PD-L1 levels in HCC cells detected by Western blot when GOLM1 was knocked down by shGOLM1 and then restored by shRES-GOLM1 in MHCC-97H and HCC-LM3 cells (top panel), and when GOLM1 was exogenously upregulated by transfection of GOLM1FLAG in PLC and Hep3B cells (bottom panel). b Flow cytometric analyses of membrane PD-L1 expression in MHCC-97H and HCC-LM3 cells after downregulation and rescue of GOLM1 expression. The relative quantification is shown on the bottom panel. c Immunoblot showed that GOLM1-KD significantly decreased PD-L1 expression in MHCC-97H cells, which was alleviated by the proteasome inhibitor MG132 (10 μM). d Protein stability assay showed that GOLM1-KD significantly accelerated the degradation of PD-L1 protein, which could be attenuated by MG132. HCC cells were treated with 20 μg/mL cycloheximide (CHX) at indicated intervals and subjected to Western blot (left panel). The quantification is shown on the right panel. Ubiquitination assay of PD-L1 in HEK293T cells (e) and MHCC-97H-shGOLM1 cells (f) transfected with the indicated plasmids. Ubiquitinated PD-L1 was immunoprecipitated and subjected to Western blot analysis with an antibody against ubiquitin. Cells were treated with MG132 before ubiquitination analysis. Western blot analysis demonstrated that PD-L1 decrease (g) and ubiquitination (h) induced by GOLM1 knockdown were abolished by overexpression of CSN5. Western blot analysis demonstrated that upregulated expression (i) and decreased ubiquitination (j) of PD-L1 induced by GOLM1 overexpression was abolished by knockdown of CSN5. k Western blot analysis demonstrated that PD-L1 protein degradation induced by GOLM1 knockdown was abolished by overexpression of CSN5. l Co-IP determined the interaction of GOLM1 and CSN5 from PLC cells transfected with Flag-GOLM1. m The interaction of endogenous PD-L1 with CSN5 in MHCC-97H cells was validated by Co-IP
Fig. 4
Fig. 4
GOLM1 increases exosomal PD-L1 levels from HCC cells. a Immunofluorescence staining showed a co-localization of GOLM1 with exosome marker CD63 (left panel) or PD-L1 (middle panel) and CD63 with PD-L1 (right panel) in the multivesicular endosomes (MVEs), which are the precursor forms of exosomes before released. b Co-IP determined the association of GOLM1 and exosome markers CD63, CD9, TSG101, and Alix from PLC cells transfected with Flag-GOLM1. c Co-IP demonstrated the association of exogenous GOLM1 with PDL-L1 in GOLM1Flag PLC cells and exosomes: PLC cells transfected with FLAG-GOLM1 or empty vector (control) were subjected to IP using anti-FLAG magnetic beads. d The association of endogenous PD-L1 with GOLM1 and CD63 in MHCC-97H cells was validated. e The association of endogenous PD-L1 with GOLM1 in MHCC-97H exosomes was validated. f GST pulldown assays showed a direct interaction between GOLM1 and PD-L1. GST- GOLM1 was expressed in E. coli and purified. Full-length PD-L1 was produced via in vitro translation. g Mapping the regions of GOLM1 that interact with PD-L1. Various FLAG-tagged truncated GOLM1 were prepared to test the interaction with GST-PD-L1, GOLM1 was detected by anti-Flag antibody after GST pulldown. Coomassie blue staining of one-tenth of the amount of each GST-PD-L1 fragment. h Western blotting analysis showed after Rab27a was knocked down, intracellular accumulation of PD-L1 and GOLM1 was detected in MHCC-97H cells, whereas PD-L1 and GOLM1 in exosomes decreased significantly, and the abundance of exosomes, indicated by exosomal markers, ALIX, TSG101, CD63, and CD9, was inhibited significantly. i, j Western blot analysis of the exosomes isolated from an equivalent number (6 × 107) of HCC cells indicating that GOLM1 facilitates the secretion of exosomal PD-L1. MHCC-97H cells with endogenous high-GOLM1 (i) and low-GOLM1 Hep3B cells (j) were used
Fig. 5
Fig. 5
GOLM1 facilitates PD-L1 sorting into exosomes and transport to macrophages via suppression of Rab27b. a Western blot analysis showed the alterations of PD-L1 expression on HCC cells and in exosomes from MHCC-97H cells after knockdown of Rab27b and reintroducing shRES-Rab27b into Rab27b-KD cells. b Immunofluorescence images demonstrated the co-localization of Rab27b (top panel) or PD-L1 (bottom panel) with TGN marker TGN46 in MHCC-97H-shNT and MHCC-97H-shGOLM1 cells. c Western blotting showed that the knockdown of Rab27b significantly increased the reduced PD-L1 expression in exosomes induced by GOLM1-KD in MHCC-97H cells. d Western blot validated the screening results of an antibody microarray containing a panel of 42 chemokines related to the chemotaxis of TAMs, in the supernatant of MHCC-97H-shGOLM1 and MHCC-97H-shNT cells. e Migration assays revealed the association of macrophage migration with GOLM1 levels in HCC cells. f Western blotting analysis showed PD-L1 expression on macrophages after co-culture with MHCC-97H treated with exosome secretion inhibitor GW4869 (20μM) or DMSO (control) for 48 h. g Immunofluorescence images of THP1-derived macrophages. Exosomes isolated from MHCC-97H-GOLM1-Cre cells were added to cultures of macrophages expressing LoxP-DsRed-Stop-LoxP-eGFP. Macrophages switched from red to green indicated that GOLM1-Cre protein was successfully transferred by exosomes into macrophages. h Western blot showed the alterations in PD-L1 levels of macrophages co-cultured with exosomes derived from HCC cells with various GOLM1 expressions. i Western blot showed the PD-L1 levels of MHCC-97H cells and macrophages co-cultured with exosomes derived from MHCC-97H cells. *P < 0.05
Fig. 6
Fig. 6
Inhibition of TAM infiltration enhances the efficacy of anti-PD-L1 immunotherapy in HCC mouse model. ad The inhibitory effects of anti-PD-L1 Ab on tumor growth in subcutaneous implantation C57BL/6 mouse model using Hepa1-6 shNT or Hepa1-6 shGOLM1 cells. When tumor size was 40 mm3, mice were treated with IgG isotype control, anti-PD-L1 antibody (200 μg i.p. injection every 3 days), ZA (100 μg/kg i.p. injection every 3 days), and anti-PD-L1 antibody in combination with ZA until the treatment endpoint. Representative images of subcutaneous tumors (a), tumor growth curves (b), tumor weight (c), and tumor inhibition rate (d) for indicative groups (n = 6 mice/group). e Representative images and quantification of IHC staining of PD-L1, CD8, F4/80, and CD206 in hepa1-6 shNT subcutaneous tumors (n = 3 per group). f, g Representative images and tumor weight analysis in orthotopic implantation models of Hepa1-6 shNT (n = 5 mice/group). *P < 0.05, **P < 0.01, ***P < 0.001, ns: no significant
Fig. 7
Fig. 7
TAM inhibitor and anti-PD-L1 combination decreases PD-L1+ TAMs infiltration and neutralizes T cell suppression. a, b Flow cytometric quantification of CD8+ T cells, F4/80+ CD11b+ (macrophages), and F4/80+ CD11b+ CD206+ (TAMs), as well as PD-L1+ TAMs in tumor tissues from orthotopic implantation models of Hepa1-6 cell in C57BL/6 mice. ZA and anti-PD-L1 combination increased the infiltration of CD8+ T cells and decreased the infiltration of TAMs (a) with a significantly decreased percentage of PD-L1+ TAMs (b). c The functional state of T cells was analyzed by flow cytometric quantification of GZMB+, IFN-γ+, PD-1+, TIM3+, and Ki67+ cells among CD8+ T cells in HCC tissues from indicative groups (n = 5 mice in Control, anti-PD-L1, and ZA groups, n = 4 mice in combination group). d IHC data suggested that in the combination treatment group, infiltration of TAMs decreased sharply in the peripheral tumor region, whereas CD8+ T cell increased significantly in the central tumor region. Representative immunohistochemical staining images of CD8 and F4/80 in tumor periphery and center are shown. e A schematic diagram describing the molecular mechanisms of the immunosuppressive microenvironment drove by GOLM1 in HCC. *P < 0.05, **P < 0.01, ***P < 0.001, ns: no significant

References

    1. Villanueva A. Hepatocellular carcinoma. N. Engl. J. Med. 2019;380:1450–1462. - PubMed
    1. Llovet JM, et al. Hepatocellular carcinoma. Nat. Rev. Dis. Prim. 2021;7:6. - PubMed
    1. Maluccio M, Covey A. Recent progress in understanding, diagnosing, and treating hepatocellular carcinoma. CA Cancer J. Clin. 2012;62:394–399. - PubMed
    1. Guerra F, Levi Sandri GB. The problem of the most appropriate curative treatment for hepatocellular carcinoma. When to embolize? When to operate? J. Hepatol. 2015;63:280–281. - PubMed
    1. Llovet JM, et al. Sorafenib in advanced hepatocellular carcinoma. N. Engl. J. Med. 2008;359:378–390. - PubMed

Publication types

MeSH terms