. 2021 Nov 18;12(1):6663.
doi: 10.1038/s41467-021-26907-3.

Global predictions of primary soil salinization under changing climate in the 21st century

Affiliations

Global predictions of primary soil salinization under changing climate in the 21st century

Amirhossein Hassani et al. Nat Commun. .

Abstract

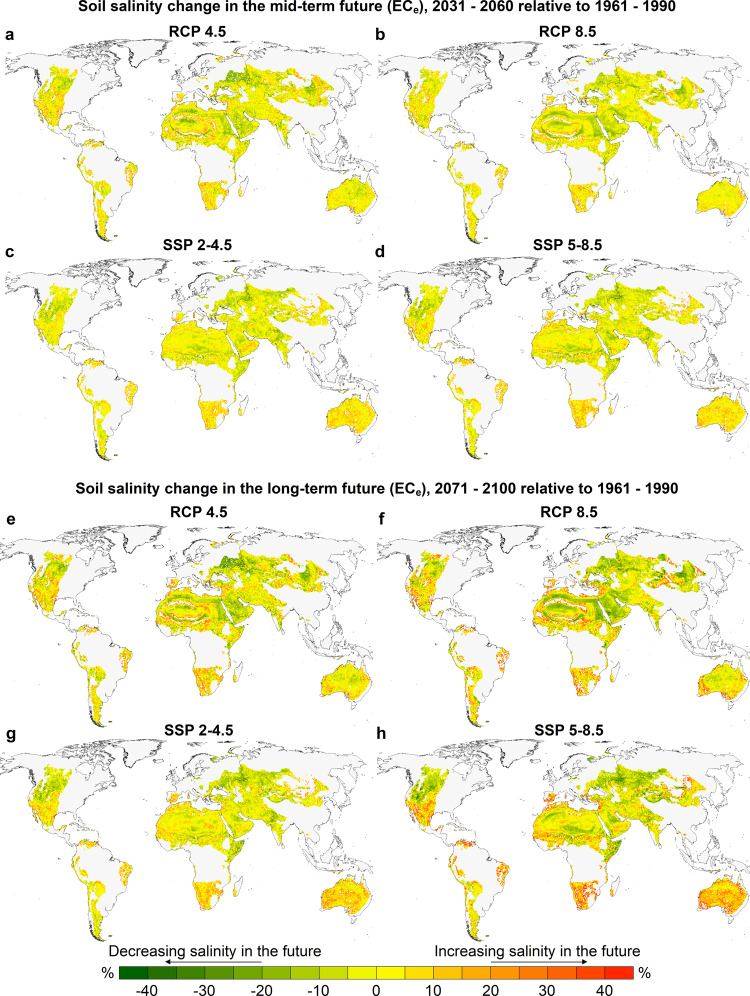
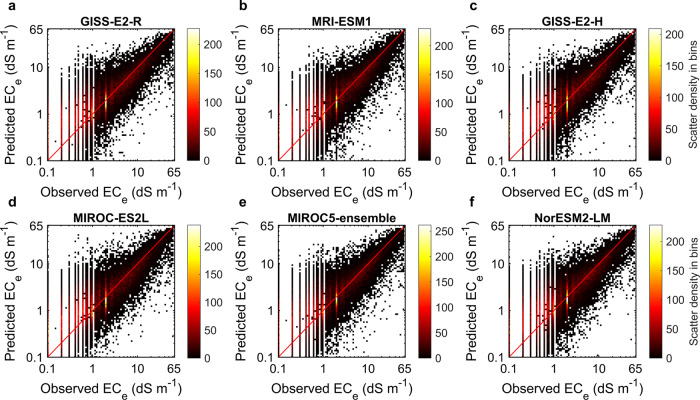
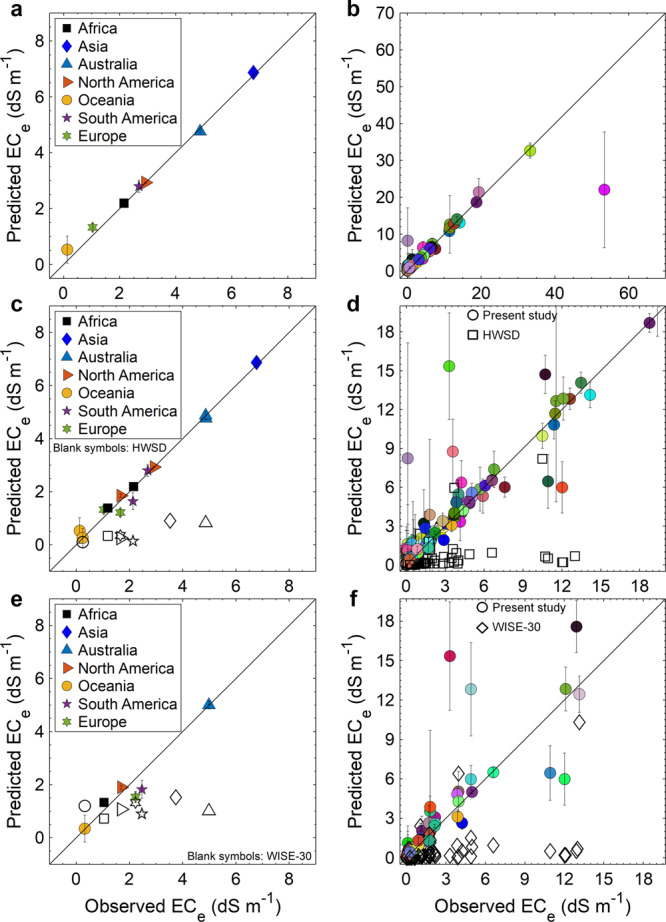
Soil salinization has become one of the major environmental and socioeconomic issues globally and this is expected to be exacerbated further with projected climatic change. Determining how climate change influences the dynamics of naturally-occurring soil salinization has scarcely been addressed due to highly complex processes influencing salinization. This paper sets out to address this long-standing challenge by developing data-driven models capable of predicting primary (naturally-occurring) soil salinity and its variations in the world's drylands up to the year 2100 under changing climate. Analysis of the future predictions made here identifies the dryland areas of South America, southern and western Australia, Mexico, southwest United States, and South Africa as the salinization hotspots. Conversely, we project a decrease in the soil salinity of the drylands in the northwest United States, the Horn of Africa, Eastern Europe, Turkmenistan, and west Kazakhstan in response to climate change over the same period.


Conflict of interest statement

The authors declare no competing interests.

Figures

Fig. 1
Fig. 1. Multi-model ensemble mean of the change in predicted soil salinity represented by saturated paste electrical conductivity (ECe) in the mid- and long-term futures, relative to the reference period (1961–1990) under different greenhouse gas concentration trajectories.
ad Mid-term prediction of changes in ECe (2031–2060). eh Long-term prediction of changes in ECe (2071–2100). The average of the predictions to the depth of 1 m were used for calculations of salinity change. At each map cell (pixel) and based on each GCM, we calculated the mean of soil salinity for the reference, mid-, and long-term future periods and then computed the relative change as: (Future mean − Reference mean)/Reference mean; the percentage value of each cell represents the multi-GCM mean of the calculated relative changes presented by the colour map. Positive values indicate an increase in soil salinity while the negative values are indicative of a decreasing trend.
Fig. 2
Fig. 2. Multi-GCM ensemble agreement on the sign of change in predicted values of soil ECe in the long-term future (2071–2100), relative to the reference period (1961–1990) under different greenhouse gas concentration trajectories.
a, b Multi-GCM ensemble agreement of the models adopted from Coupled Model Inter-comparison Project Phase 5 (CMIP5) forced by RCP 4.5 and RCP 8.5 scenarios (Representative Concentration Pathways, which result in a respective radiative forcing of 4.5 and 8.5 W m−2 in year 2100, relative to pre-industrial conditions), respectively. c, d respective multi-GCM ensemble agreement of the models adopted from CMIP6 project under SSP 2-4.5 and SSP 5-8.5 pathways (projections forced by RCP 4.5 and RCP 8.5 global forcing pathways for the Shared Socio-economic Pathways 2 and 5, respectively). 100% shows the full agreement of the models on the sign of change, while zero indicates inconsistency among the models’ predictions.
Fig. 3
Fig. 3. Continental-level predicted annual change in the total area of soils with an ECe ≥ 2 dS m−1 relative to the 20th century average (1904–1999) for the models obtained from the CMIP6 data project.
af Relative change under SSP 2-4.5 greenhouse gas concentration trajectory. gl Relative change under SSP 5-8.5 greenhouse gas concentration trajectory. Shaded areas show the minimum and maximum range of the relative changes predicted by multi-model ensemble members. Red lines show the low-pass filtered (5-year running window) of the multi-model ensemble mean of the predicted variations; since all spatio-temporal predictors are five-year moving averages, 1904 is the beginning of the period.
Fig. 4
Fig. 4. General properties of the ECe profiles used for training the models.
a spatial distribution of the soil salinity profiles used for model training and prediction of the soil salinity. Each profile includes one or more soil samples. b temporal distribution of the samples used for training the predictive models of soil salinity. Each bar shows the number of samples within one year. c frequency distribution of the measured values of ECe. The solid and dashed vertical lines represent the mean and median values, respectively. d average of the measured soil salinity values at 1 cm intervals to the depth of 1 m below the surface.
Fig. 5
Fig. 5. 10-fold cross-validation plots for the six trained models with the highest root mean squared error (RMSE) values out of the final 16 best-fitted models.
The RMSE decreases from af. The colour maps show the scatter density in each bin. The red lines represent the y = x line.
Fig. 6
Fig. 6. Comparison of the predicted values of soil salinity (ECe) in the present study and the measured values as well as the soil ECe predicted in other datasets (i.e. HWSD and WISE-30) at the continental and country levels.
a, b Average predicted values versus average measured values at the continental and country levels (87 countries), respectively. c, d Average of the surface (0–30 cm) salinity (ECe) values predicted by the present study and Harmonised World Soil Database (HWSD) versus the average of measured surface salinity at the continental and country levels (74 countries), respectively. e, f Average of the surface (0–20 cm) salinity predicted by the present study and WISE-30 (World Inventory of Soil Emission Potentials derived soil properties) dataset versus the average of measured surface salinity at the continental and country levels (71 countries), respectively. The error bars represent the minimum and maximum of average values calculated for the 29 models used in the study.

References

    1. Soil Science Glossary Terms Committee. Glossary of soil science terms (Soil Science Society of America, ASA-CSSA-SSSA, 2008).
    1. Burt, R. Soil Survey Investigations Report, no. 45, version 2.0. (Natural Resources Conservation Service, 2011).
    1. Abrol, I., Yadav, J. S. P. & Massoud, F. Salt-affected soils and their management (Food & Agriculture Org., 1988).
    1. Bleam, W. F. Soil and Environmental Chemistry (Academic Press, 2016).
    1. Zaman, M., Shahid, S. A. & Heng, L. Guideline for Salinity Assessment, Mitigation and Adaptation using Nuclear and Related Techniques (Springer, 2018).

Publication types