. 2021 Nov 18;12(1):6689.
doi: 10.1038/s41467-021-26936-y.

Proteogenomic discovery of neoantigens facilitates personalized multi-antigen targeted T cell immunotherapy for brain tumors

Affiliations

Proteogenomic discovery of neoantigens facilitates personalized multi-antigen targeted T cell immunotherapy for brain tumors

Samuel Rivero-Hinojosa et al. Nat Commun. .

Abstract

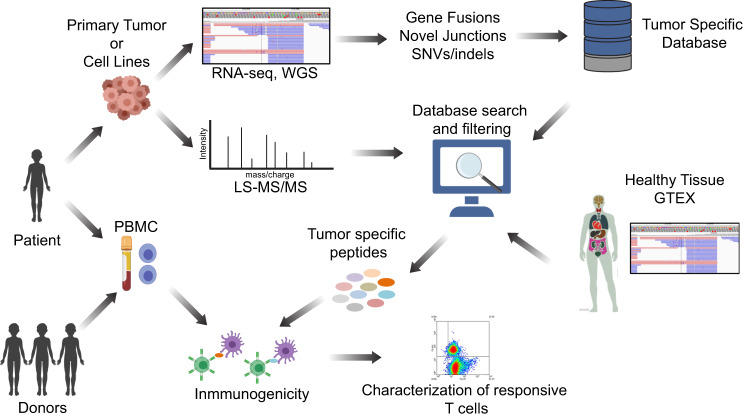
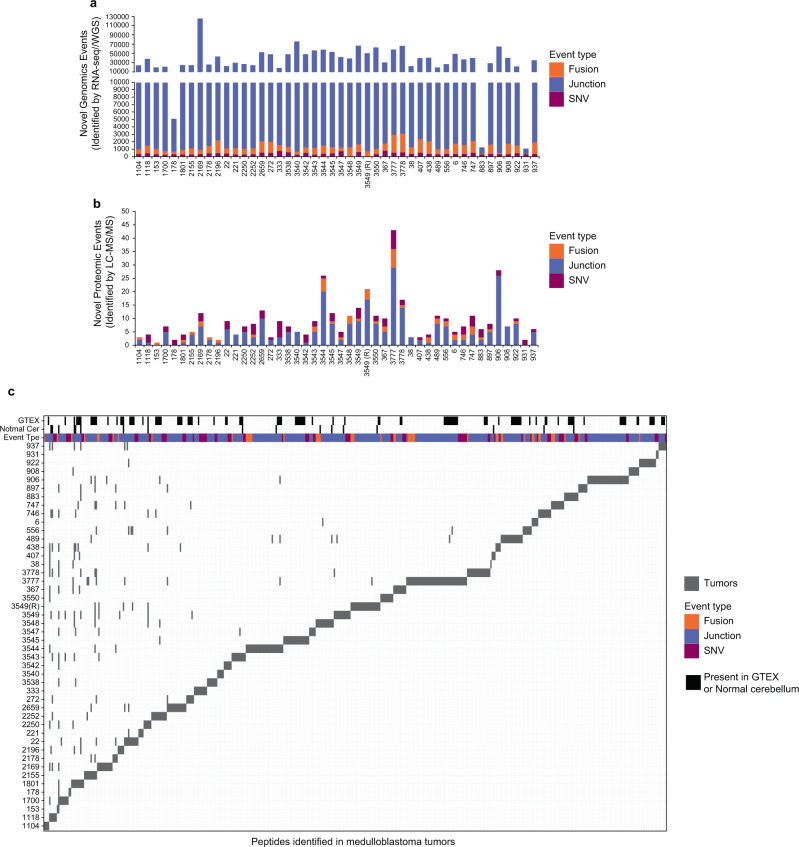
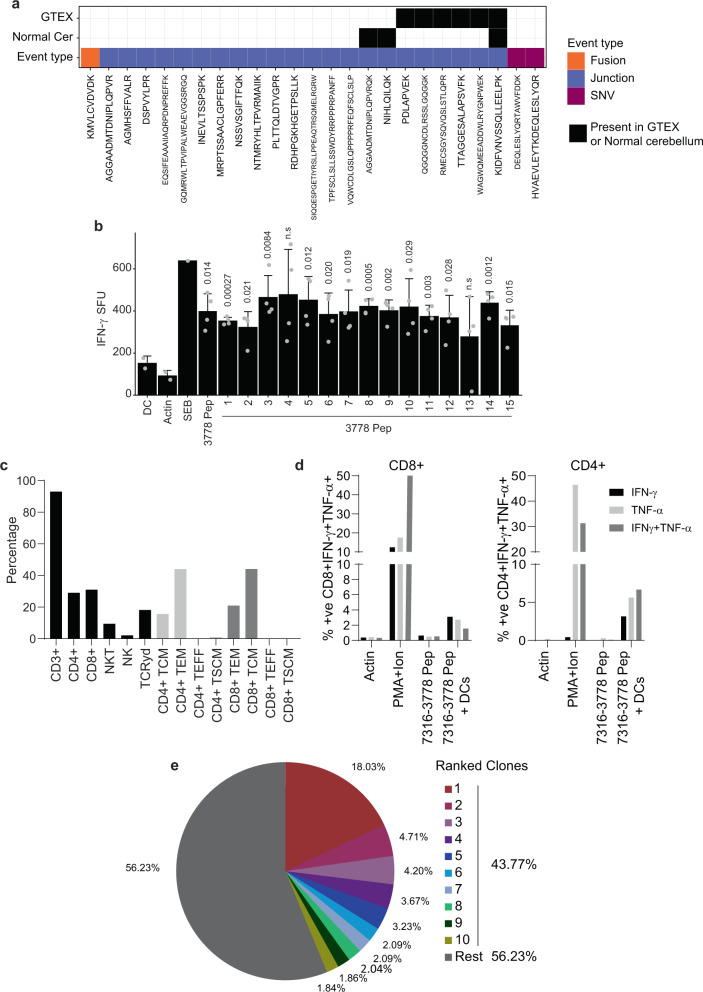
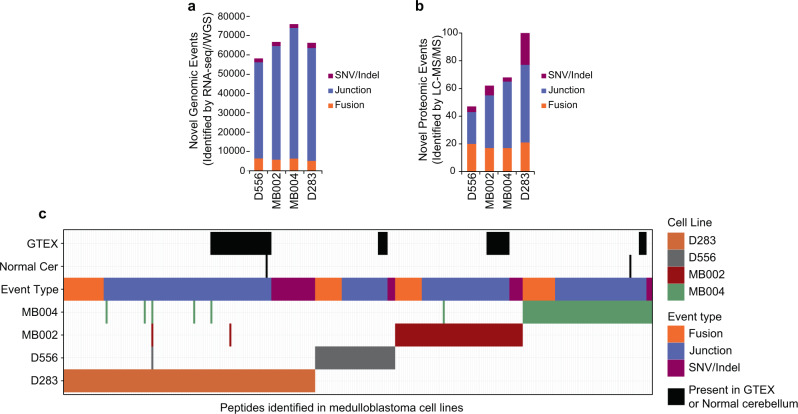
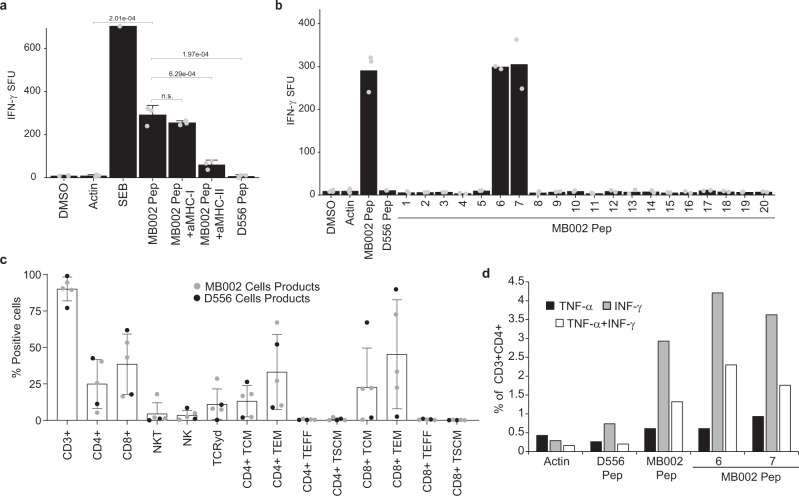
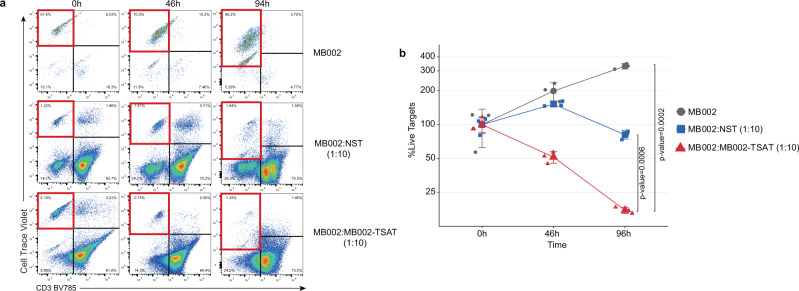
Neoantigen discovery in pediatric brain tumors is hampered by their low mutational burden and scant tissue availability. Here we develop a proteogenomic approach combining tumor DNA/RNA sequencing and mass spectrometry proteomics to identify tumor-restricted (neoantigen) peptides arising from multiple genomic aberrations to generate a highly target-specific, autologous, personalized T cell immunotherapy. Our data indicate that aberrant splice junctions are the primary source of neoantigens in medulloblastoma, a common pediatric brain tumor. Proteogenomically identified tumor-specific peptides are immunogenic and generate MHC II-based T cell responses. Moreover, polyclonal and polyfunctional T cells specific for tumor-specific peptides effectively eliminate tumor cells in vitro. Targeting tumor-specific antigens obviates the issue of central immune tolerance while potentially providing a safety margin favoring combination with other immune-activating therapies. These findings demonstrate the proteogenomic discovery of immunogenic tumor-specific peptides and lay the groundwork for personalized targeted T cell therapies for children with brain tumors.


Conflict of interest statement

The authors declare no competing interests.

Figures

Fig. 1
Fig. 1. Proteogenomic approach to identify tumor-specific antigens in pediatric brain tumors.
Schematic representation of the entire workflow is shown. Tumor tissue samples were obtained from patients, and WGS and RNA-seq were performed to identify tumor-specific genomic aberrations (SNV/indels, junctions, and fusions). Protein lysates were subjected to LC-MS/MS shotgun proteomics and spectra were searched against tumor-specific databases originating from tumor WGS and RNA-seq. MS-identified peptides were filtered using genomic and proteomic data from normal tissues to eliminate potential non-annotated normal proteins. Finally, to evaluate tumor-specific peptides for immunogenicity, autologous and allogeneic T cells were selected and expanded against the peptides and characterized for phenotype and function.
Fig. 2
Fig. 2. Tumor-specific genomic and proteomic events in 46 medulloblastoma tumors.
The number of a genomic (detected by RNA-seq/WGS) and b proteomic (detected by LC-MS/MS) tumor-specific events are shown for 46 medulloblastoma tumors. The type of tumor-specific genomic events is indicated: SNV/indels (purple), junctions (blue), and gene fusions (orange). The number of identified tumor-specific peptides ranged from 1 to 43 peptides per tumor with a mean of 9 peptides per tumor. c Tile plot depicting the number of tumor-specific peptides identified in medulloblastoma tumors. Black tiles indicate unannotated peptides identified in healthy cerebellum or normal tissues from GTEX. SNVs, fusions, and junctions are shown in purple, orange, and blue respectively. Each gray tile represents a peptide, although some peptides are found in multiple tumors, the vast majority are tumor-specific. Source data are provided as a Source Data file.
Fig. 3
Fig. 3. Autologous tumor-specific peptides induce a specific IFN-γ response.
a Tile plot depicting the number of tumor-specific peptides identified in patient 7316-3778’s tumor. Black tiles indicate the unannotated peptides identified in healthy cerebellar or normal tissues from GTEX. SNVs, fusions, and junctions are displayed in purple, orange, and blue respectively. b Dendritic cells derived from patients 7316-3778 were loaded with peptides identified in the subject’s tumor by our proteogenomic pipeline. DCs were co-cultured with non-adherent cells as described. Following three stimulations, peptide-specific responses were assessed by anti-IFN-γ ELISpot. In the presence of peptide-loaded DCs, a significant anti-IFN-γ response was observed against 13/15 peptides. One-sided t-test was used to calculate the p-values, n = 4. p-values are indicated in the figure, n.s. non-significant. c Summary data of patient TSAT phenotype, memory, and differentiation status. Gating strategy TSAT populations and phenotypes (Supplementary Fig. 15). d To assess CD4- and CD8-specific cytokine function, TSAT were incubated in the presence of pooled peptides or peptide-loaded DCs. Summary of intracellular staining data showing specific CD4+ and CD8+ responses to 7316-3778 peptides in the presence of peptide-loaded DCs. Gating strategy for intracellular staining (Supplementary Fig. 15). e Results of TCR Vβ CDR3 sequencing on the 7316-3778 TSA T product. Pie chart of the top 10 clonotypes in the TSA T. Clonotypes are listed in Supplementary Data 5. SFU spot-forming units; 1 SFU = 1 T cell secreting IFN-γ. Actin: specific peptide control; PMA/Ionomycin positive control. Data are presented as mean values +/− SD. Source data are provided as a Source Data file.
Fig. 4
Fig. 4. Tumor-specific genomic and proteomic events in medulloblastoma cells lines.
The number of a genomic (detected by RNA-seq/WGS) and b proteomic (detected by LC-MS/MS) tumor-specific events are shown for D556, MB002, MB004, and D283 medulloblastoma cell lines. The type of tumor-specific genomic events is indicated: SNV/indels (purple), junctions (blue), and gene fusions (orange). c Tile plot depicting the number of tumor-specific peptides identified in medulloblastoma cell lines. Black tiles indicate unannotated peptides identified in healthy cerebellum or normal tissues from GTEX. SNVs, fusions, and junctions are shown in green, red, and blue respectively. Source data are provided as a Source Data file.
Fig. 5
Fig. 5. MB002 cell line-specific peptides induce peptide-specific, poly-functional Class II-mediated T cell IFN-γ responses in vitro.
Dendritic cells were loaded with MB002-specific peptides and co-cultured with non-adherent PBMCs. After three stimulations, peptide-specific T cell responses were analyzed by anti-IFN-γ ELISpot. a Summary data of IFN-γ response to pooled MB002 peptides in healthy donor 1. One-sided t-test was used to calculate the p-values, n = 3. p-values are indicated in the figure. b Summary data showing IFN-γ response to individual MB002 peptides in healthy Donor 2 (n = 2). c Summary data of MB002 and D556 TSATs populations and phenotypes (Error bars: mean + SD of five independent experiments). d Summary data showing CD4+ cytokine response to the pooled MB002 peptides and to the individual peptides 6 and 7 in the healthy donor 2. SFU: spot-forming units; 1 SFU = 1 T cell secreting IFN-γ; TSA T: Tumor-specific antigen T cell; a-MHC-I/II: anti-MHC Class I/II blocking antibodies; MB002 pep: pooled MB002 peptides; D556 pep: pooled D556 peptides; DMSO: dimethyl sulfoxide (peptide solvent; unstimulated control); actin: peptide specificity control; SEB: staphylococcus enterotoxin B (positive control). Gating strategy for intracellular staining (Supplementary Fig. 15). Gating strategy TSA T populations and phenotypes (Supplementary Fig. 16). Data are presented as mean values +/− SD. Source data are provided as a Source Data file.
Fig. 6
Fig. 6. MB002 TSA T cells specifically lyse partially HLA-matched tumor cells.
To assess cytotoxic function, cryopreserved TSA T were thawed and rested overnight prior to plating with tumor targets. At the indicated time points, co-cultures were harvested and acquired as described in the “Methods”. a Representative dot plots from one healthy donor showing proliferation of tumor targets in the absence of TSA T (top row), moderate reduction of tumor targets in the presence of non-specifically activated T cells (PHA blasts; middle row), and robust lysis of tumor targets in the presence of TSA T (bottom row). Lysis was determined based on the disappearance of targets from quadrant 1 (red border). b Summary data of (a). NST non-specific T cells (PHA blasts). One-way ANOVA p-values are shown. Values at each time point were normalized to 0 h (100%). One-sided ANOVA test was used to calculate the p-values, n = 3. p-values are indicated in the figure. Gating strategy for expanded TSA T tumor cell cytotoxicity assays shown in Supplementary Fig. 18. Data are presented as mean values +/− SD. Source data are provided as a Source Data file.

References

    1. Shih DJ, et al. Cytogenetic prognostication within medulloblastoma subgroups. J. Clin. Oncol.: Off. J. Am. Soc. Clin. Oncol. 2014;32:886–896. - PMC - PubMed
    1. Agudo J, et al. GFP-specific CD8 T cells enable targeted cell depletion and visualization of T-cell interactions. Nat. Biotechnol. 2015;33:1287–1292. - PMC - PubMed
    1. Mount CW, et al. Potent antitumor efficacy of anti-GD2 CAR T cells in H3-K27M(+) diffuse midline gliomas. Nat. Med. 2018;24:572–579. - PMC - PubMed
    1. Heslop HE, et al. Long-term outcome of EBV-specific T-cell infusions to prevent or treat EBV-related lymphoproliferative disease in transplant recipients. Blood. 2010;115:925–935. - PMC - PubMed
    1. Gerdemann U, et al. Cytotoxic T lymphocytes simultaneously targeting multiple tumor-associated antigens to treat EBV negative lymphoma. Mol. Ther. 2011;19:2258–2268. - PMC - PubMed

Publication types

MeSH terms