. 2021 Nov 18;12(1):6680.
doi: 10.1038/s41467-021-26948-8.

Age-seroprevalence curves for the multi-strain structure of influenza A virus

Affiliations

Age-seroprevalence curves for the multi-strain structure of influenza A virus

Dao Nguyen Vinh et al. Nat Commun. .

Abstract

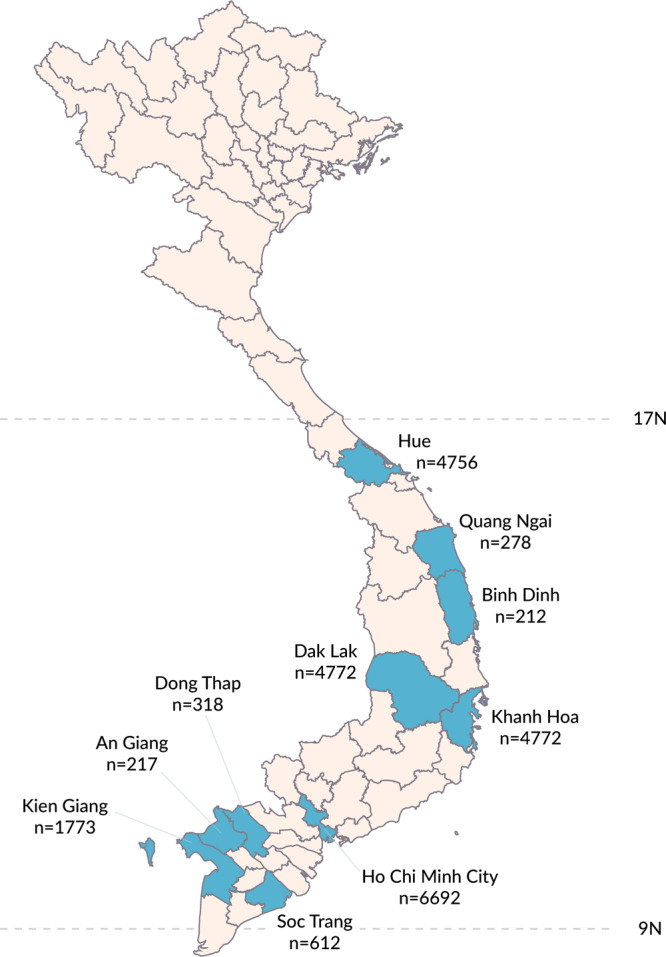
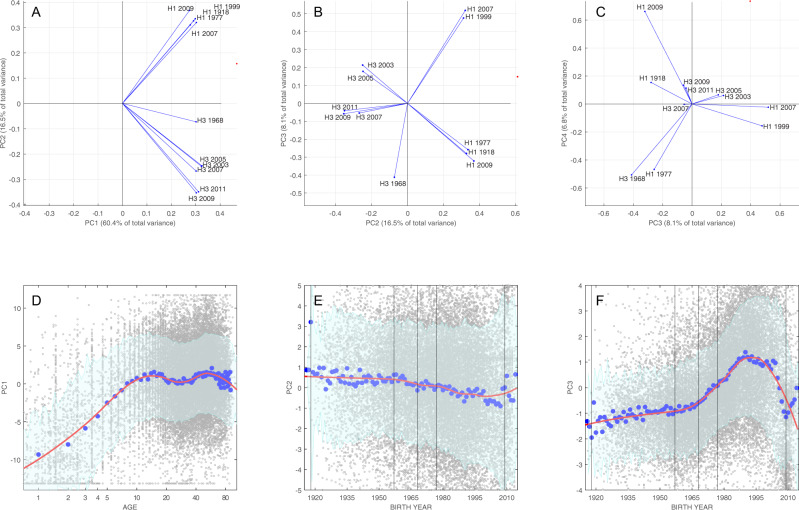
The relationship between age and seroprevalence can be used to estimate the annual attack rate of an infectious disease. For pathogens with multiple serologically distinct strains, there is a need to describe composite exposure to an antigenically variable group of pathogens. In this study, we assay 24,402 general-population serum samples, collected in Vietnam between 2009 to 2015, for antibodies to eleven human influenza A strains. We report that a principal components decomposition of antibody titer data gives the first principal component as an appropriate surrogate for seroprevalence; this results in annual attack rate estimates of 25.6% (95% CI: 24.1% - 27.1%) for subtype H3 and 16.0% (95% CI: 14.7% - 17.3%) for subtype H1. The remaining principal components separate the strains by serological similarity and associate birth cohorts with their particular influenza histories. Our work shows that dimensionality reduction can be used on human antibody profiles to construct an age-seroprevalence relationship for antigenically variable pathogens.


Conflict of interest statement

The authors declare no competing interests.

Figures

Fig. 1
Fig. 1. Serum collection sites at provincial hospitals in southern Vietnam that participated in this study.
Number of samples collected in each province is shown.
Fig. 2
Fig. 2. Principal component loadings and age/birth year relationships.
Principal component (PC) loadings for the first four principal components (AC) show the PC coefficients of all 11 influenza antigens. Only two consecutive components are shown in each panel. DF show the relationship between three first components and age (for PC1) or birth year (for PC2 and PC3). Small gray dots represent individuals, each with 11 titer measurements. The larger blue dots show the component mean for each 1-year age band or birth-year band. The red line is a spline regression curve of all 24,402 data points (LOESS curve, spanning factor = 0.5), and 80% prediction intervals (shown in green) were calculated using locally inferred error terms. The vertical lines show the time of introduction of new subtypes into the population. Note that titer scores were recentered around their means for this principal component decomposition and visualization, which is why the principal components (PC1, PC2, etc.) can be both positive and negative.
Fig. 3
Fig. 3. Density plots of individuals in principal component space, broken down by age group (shown in upper right of each panel).
Density is computed on a 256 × 256 grid spanning the minimum and maximum values of principal components one (PC1) and two (PC2). Color is scaled in each panel from zero (“Min,” white) to the maximum number of individuals that appear in a pixel in that panel (“Max,” black). Individuals move from the far left to the center and right of the PC1–PC2 space during the first 10 years of life, as a result of exposure to subtype H3N2 and H1N1 influenza viruses. The lower-left and upper-left boundaries of the diamond shape in PC1–PC2 space correspond to individuals who have only been exposed to one H1N1 strain (upper left) or those who have only been exposed to one H3N2 strain (lower left). Number of individuals (across all ages) shown here is n = 24,402.
Fig. 4
Fig. 4. Histograms showing how individuals are sorted by titer or principal component.
Histograms showing how individuals are sorted by their A maximum antibody titer, B maximum positive principal component (excluding PC1), and C maximum negative principal component (excluding PC1). In each panel, each of the n = 24,402 individuals appears exactly once depending on their highest titer (A) or the maximum magnitude of their principal components (B, C). For example, most individuals born after 2009 have their maximum antibody titer to the 2011 H3N2 strain, the 2009 H1N1 pandemic virus, or the 1918 H1N1 influenza virus. These same individuals have either principal component 2 or 4 as their largest magnitude component (among positive components). The vertical lines show the time of introduction of new subtypes into the population: H1N1 (orange), H3N2 (red), and H2N2 (green).
Fig. 5
Fig. 5. Age–seroprevalence curves shown by location and by subtype.
The four rows correspond to location, with the top row showing the age–seroprevalence relationship across Ho Chi Minh City, Hue, and Khanh Hoa combined (n = 16,220). The two columns show age–seroprevalence separately for subtypes H1N1 and H3N2 performed with separate PCAs. One gray dot is an individual. Red line shows the maximum-likelihood estimate of a saturating curve (Eq. 1) of the first principal component (PC1) as a function of age; gray bands show 95% confidence intervals. AR attack rate, CI confidence interval.

References

    1. Boni, M. F., Mølbak, K. & Krogfelt, K. A. in The Handbook of Infectious Disease Data Analysis (eds Held, L., Hens, N., O’Neill, P. & Wallinga, J.) Ch. 15 (Taylor & Francis, 2020).
    1. Ferguson NM, Donnelly CA, Anderson RM. Transmission dynamics and epidemiology of dengue: insights from age–stratified sero–prevalence surveys. Philos. Trans. R. Soc. Lond. B. 1999;354:757–768. - PMC - PubMed
    1. Hsu JP, et al. Rate of decline of antibody titers to pandemic influenza A (H1N1-2009) by hemagglutination inhibition and virus microneutralization assays in a cohort of seroconverting adults in Singapore. BMC Infect. Dis. 2014;14:414. - PMC - PubMed
    1. Zhao X, Ning Y, Chen MI-C, Cook AR. Individual and population trajectories of influenza antibody titers over multiple seasons in a tropical country. Am. J. Epidemiol. 2017;187:143–143. - PMC - PubMed
    1. Ranjeva S, et al. Age-specific differences in the dynamics of protective immunity to influenza. Nat. Commun. 2019;10:1660. - PMC - PubMed

Publication types

MeSH terms

Substances