Clinical Trial
. 2021 Nov 18;12(1):6726.
doi: 10.1038/s41467-021-26974-6.

Immune cell topography predicts response to PD-1 blockade in cutaneous T cell lymphoma

Affiliations
Clinical Trial

Immune cell topography predicts response to PD-1 blockade in cutaneous T cell lymphoma

Darci Phillips et al. Nat Commun. .

Abstract

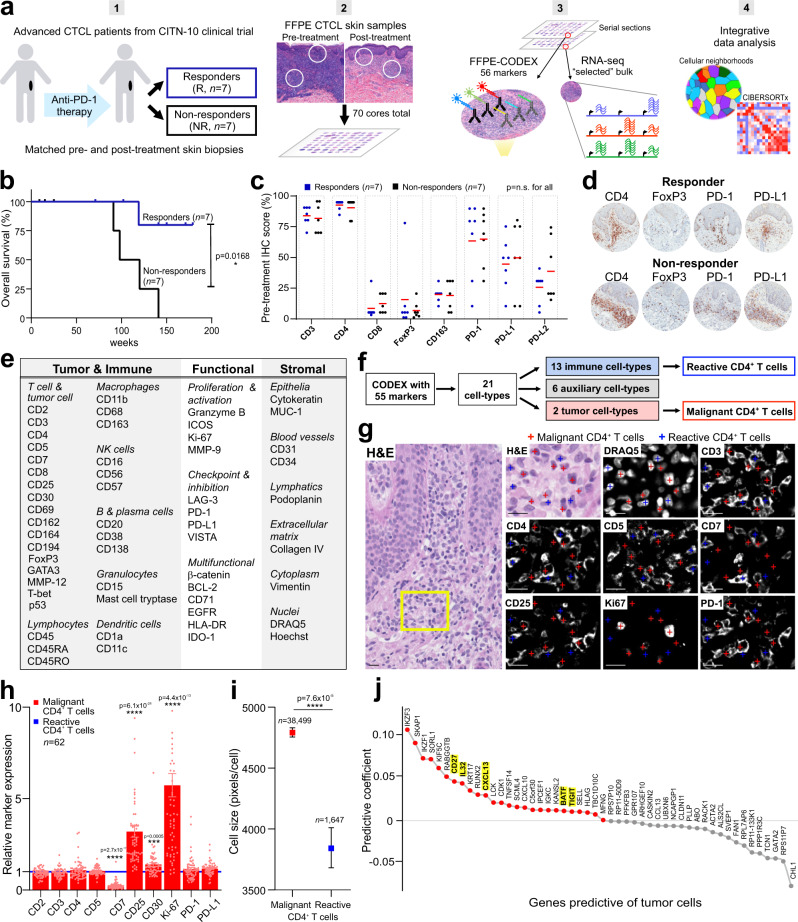
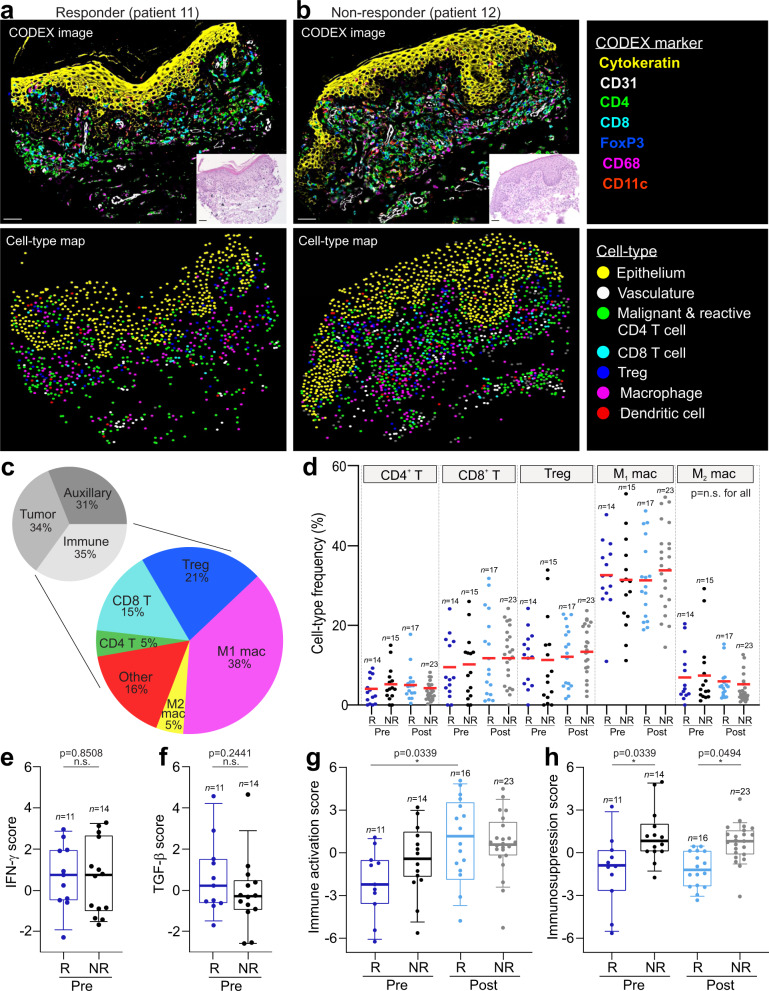
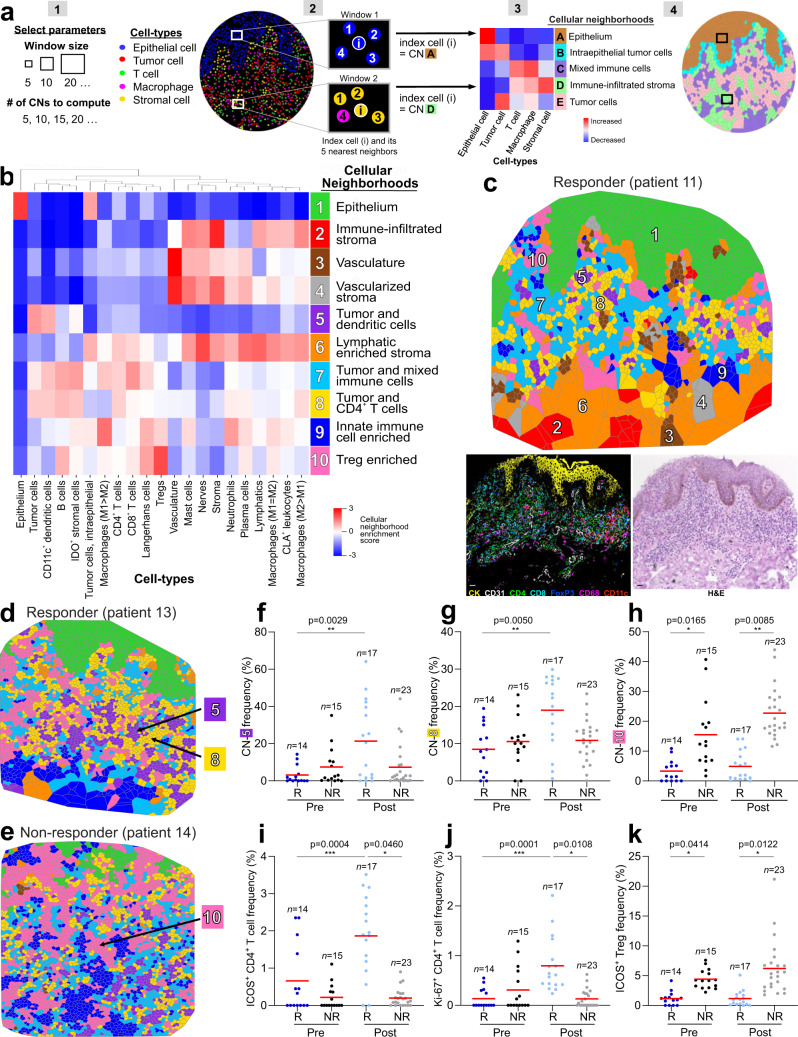
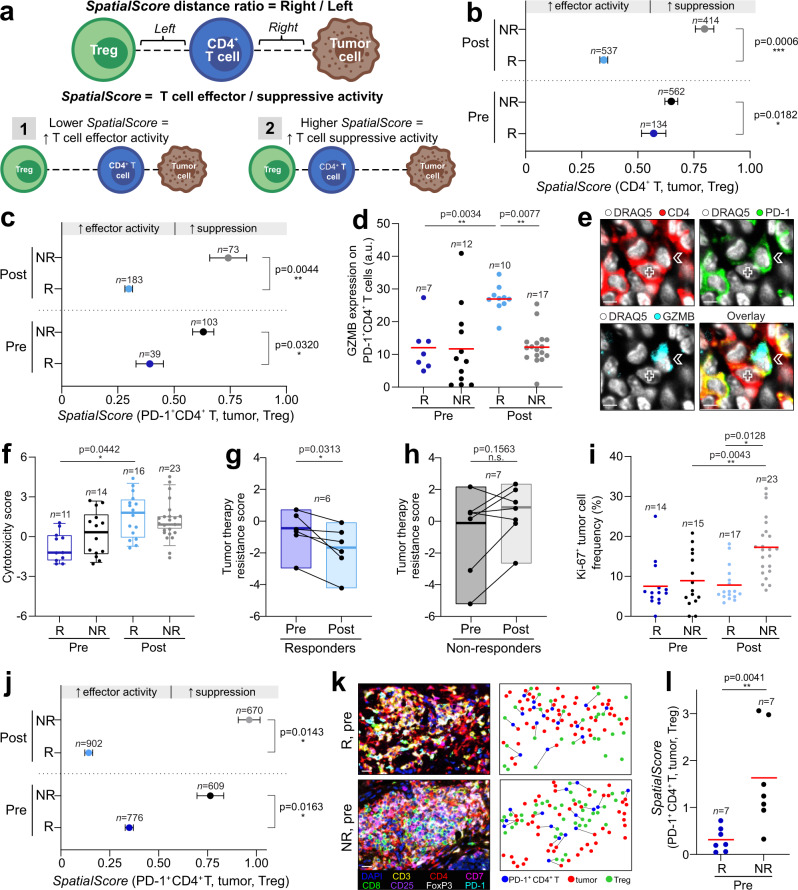
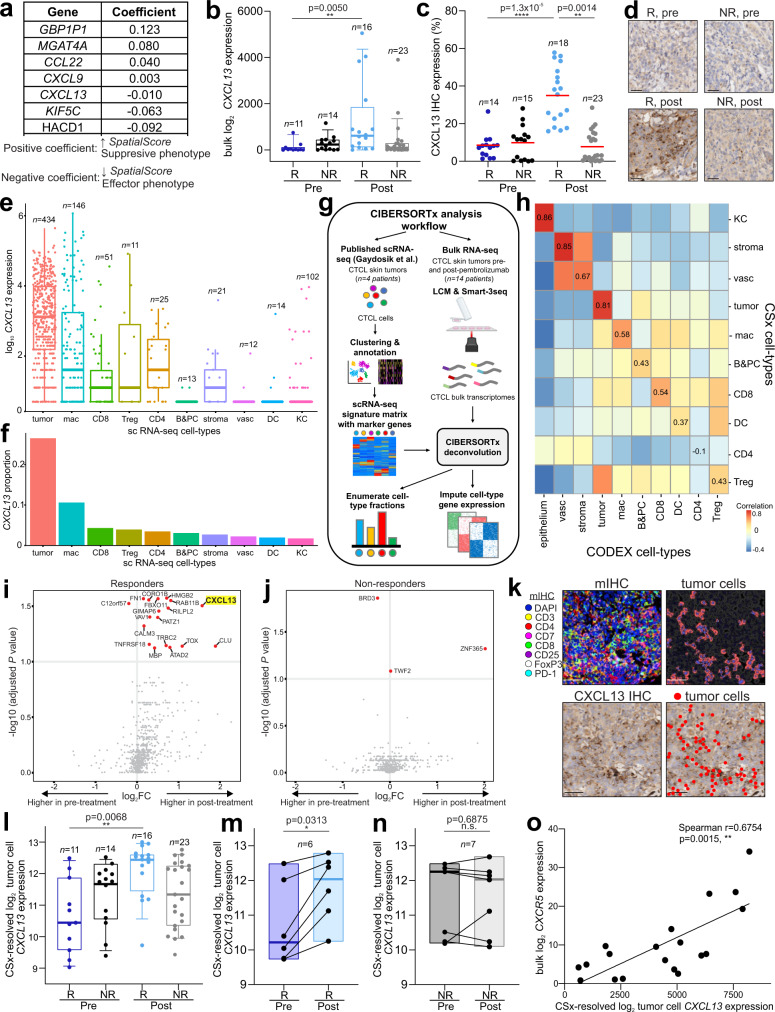
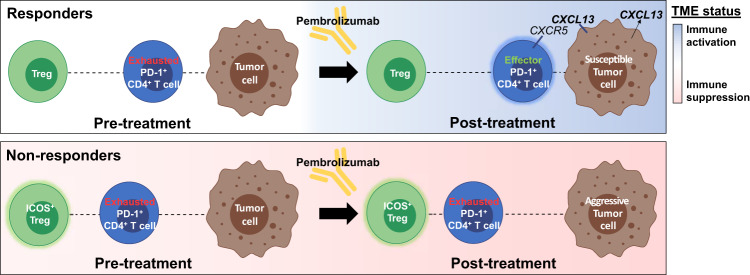
Cutaneous T cell lymphomas (CTCL) are rare but aggressive cancers without effective treatments. While a subset of patients derive benefit from PD-1 blockade, there is a critically unmet need for predictive biomarkers of response. Herein, we perform CODEX multiplexed tissue imaging and RNA sequencing on 70 tumor regions from 14 advanced CTCL patients enrolled in a pembrolizumab clinical trial (NCT02243579). We find no differences in the frequencies of immune or tumor cells between responders and non-responders. Instead, we identify topographical differences between effector PD-1+ CD4+ T cells, tumor cells, and immunosuppressive Tregs, from which we derive a spatial biomarker, termed the SpatialScore, that correlates strongly with pembrolizumab response in CTCL. The SpatialScore coincides with differences in the functional immune state of the tumor microenvironment, T cell function, and tumor cell-specific chemokine recruitment and is validated using a simplified, clinically accessible tissue imaging platform. Collectively, these results provide a paradigm for investigating the spatial balance of effector and suppressive T cell activity and broadly leveraging this biomarker approach to inform the clinical use of immunotherapies.


Conflict of interest statement

G.P.N. and Y.G. are co-founders and stockholders of Akoya Biosciences, Inc. and inventors on patent US9909167 (On-slide staining by primer extension). D.P., C.M.S., and G.P.N. are inventors on pending patent US62971722 (Spatial method to predict immunotherapy outcome in cancer), filed by Stanford University. C.M.S. is a scientific advisor to Enable Medicine, LLC. Y.H.K. received research funding from Merck & Co. The other authors declare no competing interests.

Figures

Fig. 1
Fig. 1. Discrimination of malignant and reactive CD4+ T cells in the CTCL TME.
a Workflow for sample preparation, CODEX, RNAseq, and computational analyses. b Kaplan-Meier overall survival curve, comparing responders and nonresponders (hazard ratio 0.0969 responder/nonresponder; p value calculated by log-rank test). c Pretreatment IHC protein marker expression per patient in responders and nonresponders (mean, red bar). P values calculated by two-sided Wilcoxon’s rank-sum tests (p = not significant (n.s.) for all comparisons). d Representative pretreatment IHC images for select markers from a responder (top) and nonresponder (bottom). e CODEX antibody panel (see also Supplementary Fig. 1e). f Identification of 21 cell types by clustering (see also Supplementary Fig. 2a, b). g Visual verification of reactive (blue crosses) versus malignant (red crosses) CD4+ T cells in CTCL tissue. Scale bars, 20 µm. h, Mean expression of select markers on all malignant (red bars, mean ± s.e.m.) relative to reactive (blue line) CD4+ T cells per tissue microarray spot (pink circles); cores were excluded if they contained <5 CD4+ T cells. P values calculated by two-sided Wilcoxon’s rank-sum tests. i Cell size, measured in pixels/cell, of all malignant (red square) and reactive (blue square) CD4+ T cells (mean ± s.e.m.). P value calculated by a two-sided Wilcoxon’s rank-sum test. j Ranking genes most predictive of tumor cells per tissue microarray spot using an L1-regularized linear model. Red-colored genes have positive predictive coefficients (i.e., most likely to represent tumor cells); gray-colored genes have negative predictive coefficients (i.e., less likely to represent tumor cells). Known CTCL marker genes are highlighted in yellow. Source data are provided as a Source Data file.
Fig. 2
Fig. 2. Characterization of the CTCL TME pre- and postpembrolizumab treatment.
a, b Top panels: Representative CODEX seven-color overlay images from a responder (left) and nonresponder (right) pretreatment. Scale bar, 50 µm. Insets, corresponding H&E images; scale bars, 50 µm. Bottom panels: corresponding cell type maps. c Upper pie chart: overall frequencies of tumor, immune and auxiliary cell types. Lower pie chart: overall frequencies of all immune cell types, including CD4+ T cells, CD8+ T cells, Tregs, M1 macrophages, M2 macrophages, and other (B cells, dendritic cells, Langerhans cells, mast cells, neutrophils, and plasma cells). d Cell type frequencies of CD4+ T cell, CD8+ T cell, Treg, M1 macrophage, and M2 macrophage as a percentage of all immune cells per tissue microarray spot across patient groups (mean, red bar). P values calculated with a linear mixed-effect model with Bonferroni’s corrections for multiple comparisons (p = not significant (n.s.) for all comparisons). e, f Pretreatment IFN-γ (e) and TGF-β (f) gene scores per tissue microarray spot in responders and nonresponders. For all box plots: box center line, median; box limits, upper and lower quartiles; box whiskers, 1.5x the interquartile range (IQR). P values calculated with a linear mixed-effect model with Bonferroni’s corrections for multiple comparisons. g, h Immune activation (g) and immunosuppression (h) gene scores, computed on bulk RNA-seq data, per tissue microarray spot across patient groups. Boxes, median ± upper and lower quartiles; whiskers, 1.5x IQR. P values calculated with a linear mixed-effect model with Bonferroni’s corrections for multiple comparisons. Source data are provided as a Source Data file.
Fig. 3
Fig. 3. Cellular neighborhoods reveal differences in the spatial TME organization in responders and nonresponders.
a Cellular neighborhood (CN) analysis schematic. [1] Selection of computational parameters, including the window size (five in this schematic) and the number of CNs to be computed (five in this schematic). [2] Assignment of an index cell (i, center of window) to a given CN based on the composition of cell types within its corresponding window the clustering of windows. [3] Heatmap of cell type distribution for each CN and assignment of CN names. [4] Visualization of CNs as a Voronoi diagram. b Identification of 10 conserved CNs in the CTCL TME using a window size of 10. c Representative Voronoi diagram of the 10 CNs in a responder post-treatment, with the corresponding H&E and seven color fluorescent CODEX images. Scale bar, 20 µm. de Voronoi diagrams of CNs in a responder (d) and nonresponder (e) post-treatment, highlighting CN-5 (tumor and dendritic cells), CN-8 (tumor and CD4+ T cells) and CN-10 (Treg enriched). fh Frequencies of CN-5 (f), CN-8 (g) and CN-10 (h) per tissue microarray spot across patient groups (mean, red bar). P values calculated with a linear mixed-effect model with Bonferroni’s corrections for multiple comparisons. ik Frequencies of ICOS+ CD4+ T cell (i), Ki-67+ CD4+ T cell (j) and ICOS+ Treg (k) as a percentage of all immune cells per tissue microarray spot across patient groups (mean, red bar). P values calculated with a linear mixed-effect model with Bonferroni’s corrections for multiple comparisons. Source data are provided as a Source Data file.
Fig. 4
Fig. 4. Spatial relationship between CD4+ T cells, Tregs and tumor cells predicts pembrolizumab response in CTCL.
a SpatialScore schematic. The SpatialScore is calculated by taking the ratio of the physical distance between each CD4+ T cell and its nearest tumor cell (distance “right”) relative to its nearest Treg (distance “left”). [1] A lower SpatialScore (i.e., CD4+ T cells closer to tumor cells than Tregs) suggests increased T cell effector activity. [2] A higher spatial score (i.e., CD4+ T cells closer to Tregs than tumor cells) suggests increased T cell suppression. bc SpatialScore calculated per cell for all CD4+ T cells (b) and PD-1+ CD4+ T cells (c) across patient groups (mean ± s.e.m.). P values calculated with a linear mixed-effect model taking a patient identifier as a random effect. d GZMB protein expression on PD-1+ CD4+ T cells by CODEX per tissue microarray spot (mean fluorescence intensity (arbitrary units, a.u.), red bar). P values calculated with a linear mixed-effect model with Bonferroni’s corrections for multiple comparisons. e CODEX images showing contact between a tumor cell (cross) and GZMB-expressing PD-1+ CD4+ T cell (arrow) in responder patient 13 post-treatment. Scale bars, 10 µm. f Cytotoxicity gene scores, computed on bulk RNA-seq data, per tissue microarray spot. Boxes, median ± upper and lower quartiles; whiskers, 1.5x IQR. P values calculated with a linear mixed-effect model with Bonferroni’s corrections for multiple comparisons. gh Pre- to post-treatment changes in tumor therapy resistance gene scores, computed on bulk RNA-seq data, per patient in responders (g) and nonresponders (h). Boxes, median ± upper and lower quartiles; whiskers, 1.5x IQR. P values were calculated by two-sided Wilcoxon’s signed-rank tests. i Ki-67+ tumor cell frequencies per tissue microarray spot (mean, red bar). P values calculated with a linear mixed-effect model with Bonferroni’s corrections for multiple comparisons. j SpatialScore calculated from Vectra mIHC data per cell for all PD-1+CD4+ T cells (mean ± s.e.m.). P values calculated with a linear mixed-effect model taking a patient identifier as a random effect. k Vectra mIHC images (left panels) and corresponding spatial plots (right panels)from responder patient 13 (R) and nonresponder patient 14 (NR) pretreatment. Scale bars, 20 µm. l SpatialScore calculated from Vectra mIHC data per patient in responders and nonresponders pretreatment(mean, red bar). P value calculated by a two-sided Wilcoxon’s rank-sum test, with no adjustments for multiple hypotheses. Source data are provided as a Source Data file.
Fig. 5
Fig. 5. CXCL13 is a key driver of pembrolizumab response in CTCL.
a Seven genes from bulk RNAseq data predictive of the SpatialScore. b Normalized bulk CXCL13 gene expression per tissue microarray spot. Boxes, median ± upper and lower quartiles; whiskers, 1.5x IQR. P values calculated with a linear mixed-effect model with Bonferroni’s corrections for multiple comparisons. c CXCL13 protein expression by IHC per tissue microarray spot (mean, red bar). P values calculated with a linear mixed-effect model with Bonferroni’s corrections for multiple comparisons. d Representative CXCL13 IHC images from responder patient 9 (left panels) and nonresponder patient 14 (right panels). Scale bars, 20 µm. ef CXCL13 expression in single-cell transcriptomes from CTCL skin tumors (Gaydosik et al.). e Normalized expression of CXCL13 in single cells; excluded cells with CXCL13 log1p normalized read counts < 0.5. Boxes, median ± upper and lower quartiles; whiskers, 1.5x IQR. f Proportion of CXCL13-expressing cells per cell type. g CIBERSORTx workflow schematic. A CSx deconvolution signature matrix was generated from single-cell transcriptomes (Gaydosik et al.) (left) and applied to CTCL bulk transcriptomes obtained with laser-capture microdissection (LCM) and Smart-3Seq (right) to enumerate cell type fractions and resolve gene expression profiles. h Heatmap correlation of CSx-resolved and CODEX-identified cell type frequencies; Spearman coefficients are on the diagonal. ij Differential expression of CSx-resolved tumor cell genes in responders (j) and nonresponders (k) pre- and post-treatment. P values calculated with a linear mixed-effect model with Benjamini-Hochberg correction (significantly different genes (p < 0.1), red; CXCL13 highlighted yellow). k Vectra mIHC image (top left), corresponding tumor cell depiction (top right), corresponding CXCL13 IHC image (bottom left), and corresponding overlay image of CXCL13 staining and tumor cells (bottom right) in responder patient 9 post-treatment. Scale bars, 20 µm. l Normalized CSx-resolved CXCL13 expression in tumor cells per tissue microarray spot. Boxes, median ± upper and lower quartiles; whiskers, 1.5x IQR. P values calculated with a linear mixed-effect model with Bonferroni’s corrections for multiple comparisons. mn Pre- to post-treatment changes in normalized CXCL13 gene expression from CSx-resolved tumor genes per patient in responders (m) and nonresponders (n). Boxes, median ± upper and lower quartiles; whiskers, 1.5x IQR. P values calculated by two-sided Wilcoxon’s signed-rank tests. o Correlation of CSx-resolved tumor cell CXCL13 expression and bulk CXCR5 expression per tissue microarray spot. Data evaluated with two-sided Spearman test. Source data are provided as a Source Data file.
Fig. 6
Fig. 6. Proposed mechanisms of pembrolizumab response in CTCL.
Cartoon depicting proposed mechanisms of pembrolizumab response in therapy responders (top panel) and nonresponders (bottom panel) pre- and post-treatment. The functional immune status of the TME is represented by blue shading when activated and pink shading when suppressed. In nonresponders, the TME is continually immunosuppressed and persistently exhausted PD-1+CD4+ T cells are in closer proximity to potently suppressive ICOS+ Tregs. Moreover, the tumor cells of nonresponders are less susceptible to pembrolizumab therapy. In contrast, responders have a neutral functional immune state pretreatment, which facilitates the baseline spatial organization that underlies a lower SpatialScore and immune cell priming and activation. This enables the transition from exhausted PD-1+ CD4+ T cells to effector/cytotoxic GZMBhi PD-1+ CD4+ T cells following pembrolizumab therapy. Additionally, responder tumor cells are susceptible to PD-1 blockade and overexpress CXCL13 post-treatment, which chemoattracts effector PD-1+ CD4+ T cells toward tumor cells, providing a mechanism for the sustained clinical response seen in responders.

References

    1. Willemze R, et al. The 2018 update of the WHO-EORTC classification for primary cutaneous lymphomas. Blood. 2019;133:1703–1714. - PMC - PubMed
    1. Scarisbrick JJ, et al. Cutaneous Lymphoma International Consortium Study of Outcome in Advanced Stages of Mycosis Fungoides and Sezary Syndrome: Effect of Specific Prognostic Markers on Survival and Development of a Prognostic Model. J. Clin. Oncol. 2015;33:3766–3773. - PMC - PubMed
    1. Wilcox RA. Mogamulizumab: 2 birds, 1 stone. Blood. 2015;125:1847–1848. - PubMed
    1. Postow MA, Callahan MK, Wolchok JD. Immune Checkpoint Blockade in Cancer Therapy. J. Clin. Oncol. 2015;33:1974–1982. - PMC - PubMed
    1. Ribas A, Wolchok JD. Cancer immunotherapy using checkpoint blockade. Science. 2018;359:1350–1355. - PMC - PubMed

Publication types

MeSH terms

Substances

Associated data