Meta-Analysis
. 2021 Nov 18;12(1):6738.
doi: 10.1038/s41467-021-27099-6.

Modulation of pancreatic cancer cell sensitivity to FOLFIRINOX through microRNA-mediated regulation of DNA damage

Affiliations
Meta-Analysis

Modulation of pancreatic cancer cell sensitivity to FOLFIRINOX through microRNA-mediated regulation of DNA damage

Pietro Carotenuto et al. Nat Commun. .

Abstract

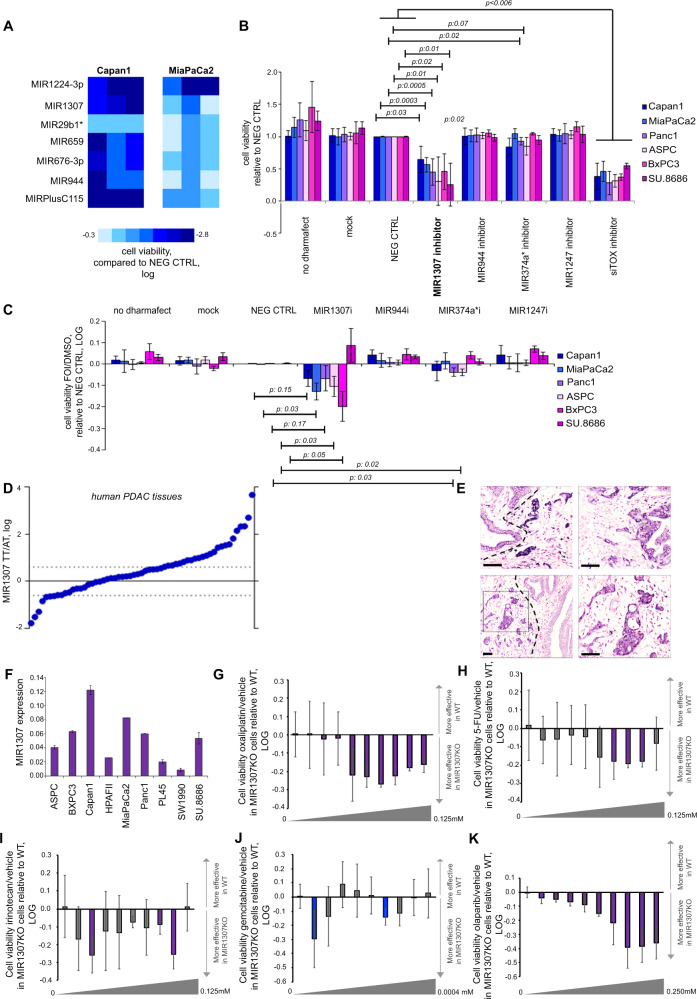
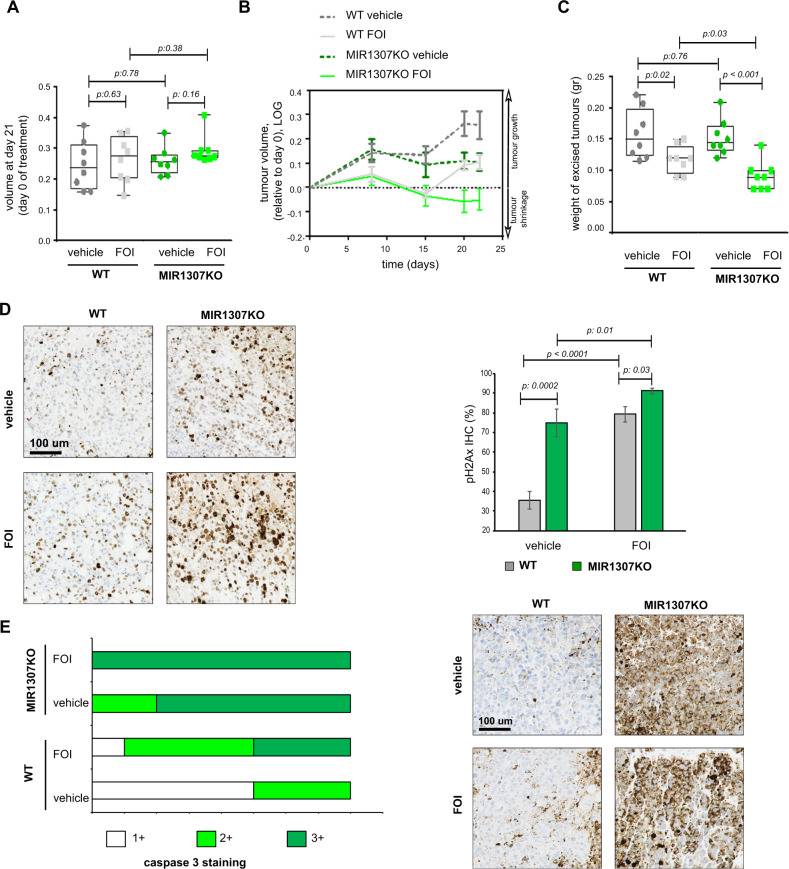
FOLFIRINOX, a combination of chemotherapy drugs (Fluorouracil, Oxaliplatin, Irinotecan -FOI), provides the best clinical benefit in pancreatic ductal adenocarcinoma (PDAC) patients. In this study we explore the role of miRNAs (MIR) as modulators of chemosensitivity to identify potential biomarkers of response. We find that 41 and 84 microRNA inhibitors enhance the sensitivity of Capan1 and MiaPaCa2 PDAC cells respectively. These include a MIR1307-inhibitor that we validate in further PDAC cell lines. Chemotherapy-induced apoptosis and DNA damage accumulation are higher in MIR1307 knock-out (MIR1307KO) versus control PDAC cells, while re-expression of MIR1307 in MIR1307KO cells rescues these effects. We identify binding of MIR1307 to CLIC5 mRNA through covalent ligation of endogenous Argonaute-bound RNAs cross-linking immunoprecipitation assay. We validate these findings in an in vivo model with MIR1307 disruption. In a pilot cohort of PDAC patients undergoing FOLFIRONX chemotherapy, circulating MIR1307 correlates with clinical outcome.


Conflict of interest statement

F.S. has a consultancy role with Bayer; has received research funding from AstraZeneca, Bayer, BMS, Roche; and travel grants from Bayer and Lilly. N.S. has received research funding from AstraZeneca, BMS, Pfizer; honoraria from Eli Lilly, Merck Serono, MSD Oncology, Pierre Fabre, Servier; travel/accommodation from AstraZeneca, BMS, Eli Lilly, Merck, Roche; and has had advisory roles with Pfizer, AstraZeneca, Servier. D.K.C. received research funding from Celgene, AstraZeneca, MSD and Immodulon, and honoraria from Celgene. D.C. has received funding from Amgen, Sanofi, Merrimack, AstraZeneca, Celgene, MedImmune, Bayer, 4SC, Clovis, Eli Lilly, Janssen, Merck; and has an advisory role with OVIBIO. M.F. has received grants from Astellas Pharma and QED Therapeutics; and has advisory roles with Astellas Pharma, Tesaro, and Diaceutics. F.S. received funding from Amal Therapeutics, Bayer, BMS, Dragonfly Therapeutics, Amgen (inst), AstraZeneca (Inst), Bayer (Inst), BMS (Inst), Roche (Inst), Sanofi (Inst), Bayer, Lilly and is Co-Chair EORTC Colon Cancer Task Force. N.V. received honoraria or travel accommodation from Merck Serono, Pfizer, Bayer, Eli-Lilly, and Menarini Silicon Biosystems. P.W. advises and received grants from Astex Pharmaceuticals; advises and owns stock in Nextechinvest; is employed and owns stock in Storm Therapeutics; advises CV6 Therapeutics, Black Diamond Therapeutics, and Vividion Therapeutics; received grants from Vernalis and Merck, and owns stock in Chroma Therapeutics. C.B. received honoraria from Incyte. All other authors declare no competing interests.

Figures

Fig. 1
Fig. 1. MIR1307 inhibition sensitizes PDAC cells to FOI chemotherapy in vitro and is expressed by PDAC cells in two independent cohorts of human pancreatic tissues.
A Capan1 and MiaPaca2 cells were screened against a library of MIR inhibitors in high-throughput. Cells were reverse transfected with LNA MIR inhibitors (Exiqon) for 48 h followed by FOI treatment for 72 h before assessing cell viability by CellTiter-Blue assay. Each square indicates logarithmic value of the mean of cell viability normalized to averaged negative controls (N = 3), with colour code indicating the degree of change in cell viability. Only miRNA inhibitors which enhanced chemosensitivity by >30% (p < 0.001) in both the cell lines are shown. B Validation of selected HTS hits was performed in a panel of PDAC cell lines with different inhibitory probes (mirVana microRNA inhibitors, ThermoFisher Scientific) following the same protocol used for HTS. Cells were transfected with the indicated probes and then treated with FOI for 72 h. Bars indicate mean and standard deviation (SD) of five replicates. p values from two-sided t-test are reported. C PDAC cell lines were transfected with MIR inhibitors mirVana microRNA inhibitors, ThermoFisher Scientific) while they were treated with DMSO or FOI for 48 h. Bars indicated the LOG value of the ratio between FOI and DMSO and are presented normalized to NEG CTRL. Bars below the 0 line indicate that cell viability was reduced by the MIR inhibitor in the FOI treated vs the DMSO treated cells, indicating specificity for chemotherapy. Bars indicate the mean and SD of five replicates. Values from two-sided t-test are reported. D MIR1307 expression was assessed by Taqman assay in the tumour (TT) and adjacent tissue (AT) of 59 human PDAC samples (cohort 1). Dots represent log of the ratio between the expression in TT and that in AT for each patient. Dashed lines indicate TT > AT fold change >1.3. E MIR1307 was assessed by in situ hybridization in FFPE tissue from human resected PDAC. Representative pictures of four different cases of PDAC. Bars indicate 100 μm. In the bottom left quadrant, it is possible to observe positive epithelial cancer cells (black square) and negative normal ducts (right of the dashed line). F MIR1307 expression was assessed in human PDAC cell lines by Taqman assay. Bars represent the mean and SD of three replicates. G MIR1307KO and WT MiaPaca2 cells were treated with oxaliplatin (scalar concentrations as indicated in the figure) or vehicle for 48 h. Bars represent the LOG value of the ratio between drug and vehicle and are presented normalized to WT. Bars below the 0 line indicate that the reduction in cell viability was increased in MIR1307KO cells. Purple bars indicate statistically significance (p < 0.05). Bars indicate mean and SD of five replicates. Cell viability was reduced by 75% at the highest dose in WT. H 5-Fluorouracil (see above). Cell viability was reduced by 69% at the highest dose in WT. Bars indicate mean and SD of five replicates. I Irinotecan (see above). Cell viability was reduced by 93% at the highest dose in WT. Bars indicate mean and SD of five replicates. J Gemcitabine (see above). Cell viability was reduced by 60% at the highest dose in WT. Bars indicate the mean and SD of five replicates. K Olaparib (see above). Cell viability was reduced by 50% at the highest dose in WT.
Fig. 2
Fig. 2. MIR1307 disruption increases apoptosis in PDAC cells.
A MIR1307KO and WT MiaPaca2 cells were treated for 48 h with FOI or DMSO and cell viability assessed by CellTiter Blue. Values from two-sided t-test are reported. B MIR1307KO and WT cells were plated and treated with FOI and DMSO for 10 days before being stained with Crystal Violet. Representative pictures (left) and quantitation of four replicates with standard deviation (right) are presented. Values from two-sided t-test are reported. C Activation of caspase 3/7 was measured by luminescence after 24 h of treatment with staurosporin. Bars represent the mean and SD of six replicates. Values from two-sided t-test are reported. D Cells were treated with DMSO or FOI for 48 h before activation of caspase 3/7 activity was measured by luminescence. Staurosporin (10 μM) was added as positive control. Bars indicate the mean and SD of six replicates. Values from two-sided t-test are reported. E Positivity for Annexin V was measured by flow cytometry after 24, 48, and 72 h of treatment. Bars represent the mean and SD of three replicates. Values from two-sided t-test are reported. F Cells were treated with DMSO or FOI for 48 h in association with vehicle or Z-VAD (caspase-inhibitor) 10 μM. Source data are provided as a Source Data file. G Cells were plated in 96 well plates and treated with the indicated drugs for 48 h, after which caspase 9 activation was assessed by caspase 9 GLO9 assay. Increasing doses of FOI (from 0.5 to 10 μM) were used, while FFCP (10 μM), H2O2 (300 μM) and staurosporin (10 μM) were used as activators of the intrinsic apoptosis. Bars indicate the mean and SD of three replicates. * indicates p < 0.05 from two-sided t-test are reported.
Fig. 3
Fig. 3. MIR1307 disruption sensitizes PDAC cells to accumulation of DNA damage.
A Cells were treated with FOI or DMSO for 48 h and collected for western blotting analysis of the indicated proteins. Experiments were repeated twice with similar results. Source data are provided as a Source Data file. B 8OHdG (marker of DNA damage from oxidative stress) was measured after 48 h of treatment with DMSO or FOI. Bars indicate the mean and SD of six replicates. Values from two-sided t-test are reported. CF COMET assay was performed to detect DNA strand breaks in cells treated with DMSO or FOI for 48 h. Representative pictures (bars indicate 100 μm) along with quantitative analyses of >40 cells (across three replicates) are represented. Error bars indicate median and interquartile ranges. Values from two-sided t-test are reported. G WT and MIR1307KO cells were treated with DMSO or FOI for 24 h and assessed for H2AX staining by immunofluorescence. H2O2 was used as a positive control as an inducer of DNA-damage. Quantitation (left) and representative pictures (right) are shown. The magnification bar indicates 50 μm. Dots indicate the mean value for field obtained (n = 10). Bars indicate median and 95% Confidence interval. Values from two-sided t-test are reported. Blue: Hoechst, Green: γH2AX.
Fig. 4
Fig. 4. Re-expression of MIR1307 rescues chemotherapy-induced cytotoxicity and DNA damage in MIR1307KO cells.
A Cells were treated with DMSO or FOI chemotherapy for 48 h and assessed for cell viability by CellTiter-Blue. Bars represent the mean and SD of six replicates. Values from two-sided t-test are reported. B Cells were treated for 48 h and COMET assay performed afterwards. Representative images are shown (magnification/scale 20×; magnification bar indicates 50 μm). C Quantification plots of the COMET assay are shown with median and interquartile ranges. A median of 90 cells (across three replicates) was assessed for each sample. Values from two-sided t-test are reported.
Fig. 5
Fig. 5. MIR1307-dependent effects are mediated by modulation of CLIC5 expression.
A mRNA expression of indicated genes was assessed by TaqMan assay. Bars indicated the mean and SD of three replicates. Values from two-sided t-test are reported. B Cells were transfected for 48 h and treated with FOI for additional 48 h before mRNA expression was assessed by TaqMan assay. Bars represent mean and SD of six replicates normalized on the WT siCTRL mimicCTRL sample. Values from two-sided t-test are reported. C Cells were transfected for 48 h and treated with FOI for 48 h and then collected for protein assessment by western blotting. Representative pictures and quantification plots are shown here. Values from two-sided t-test are reported. Source data are provided as a Source Data file. D Luciferase assay was performed in MiaPaca2 cells using the vectors indicated. MIR1307 or scrambled mimic were added as indicated. Data are presented normalized to the second column from the left indicating cells transfected with CLIC5 WT vector and scrambled mimic. Bars represent the mean and SD of three independent replicates. Values from two-sided t-test are reported. E Cells were transfected for 48 h and treated with FOI for 48 h before assessed for cell viability by CellTiter-Blue assay. Bars represent the mean and SD of six replicates. Values from two-sided t-test are reported. Bars below the 0 line indicate reduced cell viability in FOI sample vs DMSO sample. F MIR1307KO cells were transfected with the indicated siRNA and DMSO or FOI chemotherapy added 24 h later. 8OHdG (marker of DNA damage from oxidative stress) was measured after 48 h of treatment. Bars indicate mean and SD of six replicates. Values from two-sided t-test are reported. As the value generated by the assay is inversely related to the DNA damage, values here are expressed as 1/actual data. G MIR1307KO cells were transfected with the indicated siRNA and DMSO or FOI chemotherapy added 24 h later. COMET assay was performed after 48 h of treatment. At least 200 measurements from more than five biological replicates were taken for each condition. Bars represent mean and SE. Values from two-sided t-test are reported. H Cells were treated with DMSO or FOI for 24 h in the presence or absence of 10 mM N-acetyl-cystein (a ROS scavenger) and ROS detected and quantitated by a luminescence-based assay. Menadione 50 μM was used as positive control (inducer of ROS). Bars represent the mean and SD of three biological replicates. * indicate p < 0.05 from two-sided t-test are reported.
Fig. 6
Fig. 6. Validation of MIR1307-mediated effect in an independent in vitro PDAC model.
A Capan 1 cells were stably infected with miRZip lentiviral vectors expressing MIR1307-sh or CTRL probes. MIR1307. A miRZip MIR1307-sh cells had reduced MIR1307 expression when detected by Taqman assay. Please note that it is recognized that Taqman assays can detect the MIR1307-sh produced by the vector and therefore justifies the lack of >90% MIR1307 expression. Bars represent mean of three biological replicates with SD. Values from two-sided t-test are reported. B CLIC5mRNA was assessed by real time PCR. Bars represent the mean and SD of three biological replicates. Values from two-sided t-test are reported. C CLIC5 and vinculin protein expression were assessed by western blotting. D Cells were plated in 96-well plates and treated with DMSO or FOI for 48 h before assessing cell viability by CellTiter Blue. Bars represent the mean and SD of 12 replicates repeated in two separate occasions. Values from two-sided t-test are reported. E Capan 1 cells were treated with scalar concentrations of FOI (from 0.5 to 10 μM) in presence of absence of caspase 9 inhibitor for 48 h before being assessed for caspase activation. Bars represent the mean and SD of three independent replicates. F Capan 1 cells were treated for 48 h and COMET assay performed afterwards. Representative images are shown (magnification/scale 20×, magnification bar indicates 50 μm). At least 50 cells (across three replicates) were assessed for each sample. Bars represent mean and standard error. Values from two-sided t-test are reported. G Cells were treated with DMSO or FOI for 24 h and fixed before being stained with the indicated fluorescent antibodies. Representative pictures (left) along with quantitation (right) of the percentage of positive cells on the total cells in the field, with at least five fields assessed per replicate in six biological replicates. Bars represent the mean and 95% Confidence interval. The magnification bar indicates 20 μM.
Fig. 7
Fig. 7. MIR1307 disruption increases chemosensitivity of PDAC xenografts.
WT or MIR1307KO MiaPaca2 cells were injected subcutaneously in the flank of NSG mice (N = 16 each) and monitored for growth by caliper. When tumours became visible and measurable (day 21), mice were randomized to be treated with a weekly intraperitoneal vehicle (saline alone) or combination of oxaliplatin (3 mg/kg), fluorouracil (25 mg/kg), and irinotecan (25 mg/kg) for 4 weeks before being sacrificed. A Tumour volume at day 21 was comparable across the groups. Minimum to maximum values are presented. The box indicates the 95% confidence interval with median depicted within the box. Values from two-sided t-test are reported. B Tumour volume data during treatment are shown. Data are normalized to baseline pre-treatment tumour size (day 21). For statistical data please see Table S5. Two-way ANOVA test: p 0.05. C Excised tumours were weighed before being stored at −80 for analyses. Median values along with minimum to maximum values are shown. Values from two-sided t-test are reported. D Excised tumours were fixed in formalin and included in paraffin. pH2A.X was assessed by IHC and expressed as % of positive cells in each sample. Representative picture and quantification plots are shown. Values from two-sided t-test are reported. E Caspase 3 protein expression was assessed by IHC with a semiquantitative score. Each sample was scored as mild (1+), moderate (2+), and strong (3+) expression. Representative picture along with quantification plots are shown.
Fig. 8
Fig. 8. Circulating MIR1307 predicts benefit from FOLFIRINOX.
Plasma was collected from advanced PDAC patients undergoing FOLFIRINOX chemotherapy and subjected to RNA extraction. MIR1307 expression was assessed by droplet digital PCR. Cohort was split according to median MIR1307 expression in low and high MIR1307. Kaplan−Meier curve for correlation with overall survival (OS) is shown.

References

    1. Vincent A, et al. Pancreatic cancer. Lancet. 2011;378:607–620. - PMC - PubMed
    1. Burris HA, 3rd, et al. Improvements in survival and clinical benefit with gemcitabine as first-line therapy for patients with advanced pancreas cancer: a randomized trial. J. Clin. Oncol. 1997;15:2403–2413. - PubMed
    1. Cunningham D, et al. Phase III randomized comparison of gemcitabine versus gemcitabine plus capecitabine in patients with advanced pancreatic cancer. J. Clin. Oncol. 2009;27:5513–5518. - PubMed
    1. Conroy T, et al. FOLFIRINOX versus gemcitabine for metastatic pancreatic cancer. N. Engl. J. Med. 2011;364:1817–1825. - PubMed
    1. Von Hoff DD, et al. Increased survival in pancreatic cancer with nab-paclitaxel plus gemcitabine. N. Engl. J. Med. 2013;369:1691–1703. - PMC - PubMed

Publication types

MeSH terms