. 2021 Nov 18;12(1):6699.
doi: 10.1038/s41467-021-27034-9.

Inflammasome-mediated GSDMD activation facilitates escape of Candida albicans from macrophages

Affiliations

Inflammasome-mediated GSDMD activation facilitates escape of Candida albicans from macrophages

Xionghui Ding et al. Nat Commun. .

Abstract

Candida albicans is the most common cause of fungal sepsis. Inhibition of inflammasome activity confers resistance to polymicrobial and LPS-induced sepsis; however, inflammasome signaling appears to protect against C. albicans infection, so inflammasome inhibitors are not clinically useful for candidiasis. Here we show disruption of GSDMD, a known inflammasome target and key pyroptotic cell death mediator, paradoxically alleviates candidiasis, improving outcomes and survival of Candida-infected mice. Mechanistically, C. albicans hijacked the canonical inflammasome-GSDMD axis-mediated pyroptosis to promote their escape from macrophages, deploying hyphae and candidalysin, a pore-forming toxin expressed by hyphae. GSDMD inhibition alleviated candidiasis by preventing C. albicans escape from macrophages while maintaining inflammasome-dependent but GSDMD-independent IL-1β production for anti-fungal host defenses. This study demonstrates key functions for GSDMD in Candida's escape from host immunity in vitro and in vivo and suggests that GSDMD may be a potential therapeutic target in C. albicans-induced sepsis.


Conflict of interest statement

All authors declare no competing interests.

Figures
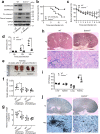
Fig. 1
Fig. 1. Gsdmd disruption alleviates C. albicans infection and associated kidney damage.
a C. albicans-triggered GSDMD cleavage in mouse bone marrow-derived macrophages (BMDMs). BMDMs from WT (C57BL/6 J) or Gsdmd-/- (C57BL/6 J) mice were untreated or infected with WT C. albicans for 6 h at MOI 50. Full-length (p53) GSDMD, cleaved (p30) GSDMD, pro-caspase-1, and cleaved caspase-1 in the cell lysates were detected by western blotting. The figure shows the result of a representative experiment that was repeated three times. Source data are provided as a Source Data file. b Kaplan-Meier survival plots of C. albicans-challenged WT (n = 15) and Gsdmd-/- (n = 15) mice. Age- and sex-matched (10-week-old female) WT and Gsdmd-/- mice were intravenously challenged with 2 × 10⁵ CFU C. albicans and monitored for 15 days. Survival rates were analyzed using Kaplan-Meier survival curves and log-rank testing (p = 0.0031 vs. WT). c Comparison of body weight changes of C. albicans-challenged WT and Gsdmd-/- mice. Two-tailed unpaired Student’s t test was used for statistical comparisons. Data presented are the means ± SD (n = 9 for WT, n = 4 for Gsdmd-/-) of 3 independent experiments. p = 0.0443 vs. WT at day 10. d Clinical score of C. albicans-challenged WT and Gsdmd-/- mice. Data presented are the means ± SD (n = 7 mice per data point) of three independent experiments. Comparison was made by two-way ANOVA followed by Sidak’ multiple comparisons test. p = 0.0443 (12 h), p < 0.0001 (24 h) vs. WT. e Comparison of the kidneys of C. albicans-challenged WT and Gsdmd-/- mice. Mice were sacrificed 2 weeks after the C. albicans infection. Shown are representative images from three independent experiments. f Kidney weights of C. albicans-challenged WT and Gsdmd-/- mice. Two-tailed unpaired Student’s t test was used for statistical comparisons. Data presented are the means ± SD (n = 8 kidneys per group) of three independent experiments. p = 0.012 (Challenged) vs. WT. g Kidney weights are shown as the weight per gram body weight of each mouse. Two-tailed unpaired Student’s t test was used for statistical comparisons. Data presented are the means ± SD (n = 8 kidneys per group) of three independent experiments. p = 0.0049 (Challenged) vs. WT. h Histopathologic assessment of the kidneys of WT and Gsdmd-/- mice 2 days after intravenous injection of 1 × 10⁶ CFU C. albicans. Shown are representative H&E-stained sections of kidney tissues from three independent experiments. i Fungal burden in the kidneys, livers, spleens, and lungs of WT and Gsdmd-/- mice. Mice were sacrificed 2 days after intravenous injection of 1 × 10⁶ CFU C. albicans. Whole organs were homogenized, and live C. albicans in the indicated organs were quantified as CFU per tissue. Data presented are the means ± SD (n = 7 mice per group) of three independent experiments. Comparison was made by two-way ANOVA followed by Sidak’ multiple comparisons test. p < 0.0001 (kidney) vs. WT. j C. albicans in the kidneys were identified by Grocott methenamine silver staining. Mice were sacrificed 2 days after intravenous injection of 1 × 10⁶ CFU C. albicans. The figure shows the result of a representative experiment that was repeated three times.
Fig. 2
Fig. 2. Gsdmd disruption reduces, while Casp-1/11 disruption completely abolishes, IL-1β secretion.
a C. albicans-triggered GSDMD cleavage and IL-1β production in Casp-1/11-/- mice. BMDMs from WT and Casp-1/11-/- mice were infected with C. albicans for 6 h at MOI 50. GSDMD (cleaved p30 and full-length p53), pro-IL-1β, and mature IL-1β (m-IL-1β) in the cell lysates and m-IL-1β in the supernatants were assessed by western blotting. Results are representative of data from at least three biological replicates. The intensities of protein bands were quantified using ImageJ. Comparison was made by two-way ANOVA followed by Sidak’ multiple comparisons test. Data shown are means ± SD (n = 3 biologically independent samples). p = 0.003 (cell lysate-m-IL-1β), p < 0.0001 (supernatant-m-IL-1β) vs. WT. Source data are provided as a Source Data file. b IL-1β secretion by BMDMs from WT and Casp-1/11-/- mice. BMDMs were infected with C. albicans (MOI = 10) for the indicated time periods. IL-1β in culture supernatants was measured by ELISA. Comparison was made by two-way ANOVA followed by Sidak’ multiple comparisons test. Data shown are means ± SD (n = 3 mice per group). p < 0.0001 (12 h, 16 h) vs. WT. c C. albicans-triggered IL-1β production in WT and Gsdmd-/- mice assessed by western blotting. Comparison was made by two-way ANOVA followed by Sidak’ multiple comparisons test. Data shown are means ± SD (n = 3). p < 0.0001 vs. WT. Source data are provided as a Source Data file. d IL-1β secretion by BMDMs from WT and Gsdmd-/- mice measured by ELISA. Comparison was made by two-way ANOVA followed by Sidak’ multiple comparisons test. Data shown are means ± SD (n = 3 mice per group). p = 0.0003 (4 h), p < 0.0001 (8 h, 12 h, 16 h) vs. WT. e Gsdmd disruption did not alter the total amount of m-IL-1β produced by C. albicans-challenged BMDMs. BMDMs from WT and Gsdmd-/- mice were infected with C. albicans for 12 h at the indicated MOIs. The amounts of m-IL-1β in culture supernatants and cell lysates (intracellular) were measured by ELISA. Comparison was made by two-way ANOVA followed by Sidak’ multiple comparisons test. Data shown are means ± SD (n = 3 mice per group). p < 0.0001 vs. WT. f C. albicans-induced IL-1β production in Casp-1/11-/- mice. WT and Casp-1/11-/- mice were intravenously challenged with 1 × 10⁶ CFU C. albicans, and the level of IL-1β in the serum was assessed at the indicated time points. Two-tailed unpaired Student’s t test was used for statistical comparisons. Data shown are means ± SD (n = 4 mice per group). p = 0.0022 (8 h), p < 0.0001 (16 h), p = 0.0029 (24 h) vs. WT. g C. albicans-induced IL-1β production in Gsdmd-/- mice. WT and Gsdmd-/- mice were intravenously challenged with 1 × 10⁶ CFU C. albicans. Two-tailed unpaired Student’s t test was used for statistical comparisons. Data shown are means ± SD (n = 4 mice per group). p = 0.1542 (8 h), p = 0.0881 (16 h), p = 0.0003 (24 h) vs. WT. h Fungal burden in the kidneys, livers, spleens, and lungs of untreated or anakinra-treated WT and Gsdmd-/- mice. Mice were sacrificed 2 days after intravenous injection of 1 × 10⁶ CFU C. albicans. Two-tailed unpaired Student’s t test was used for statistical comparisons. Data presented are the means ± SD (n = 7 for Control, n = 5 for Anakinra-treated mice) of three independent experiments. p = 0.0014 (kidney without anakinra), p = 0.8061 (kidney with anakinra) vs. WT. (i) Clinical score of C. albicans-challenged untreated or anakinra-treated WT and Gsdmd-/- mice. Two-tailed unpaired Student’s t test was used for statistical comparisons. Data presented are the means ± SD (n = 7 for Control, n = 10 for Anakinra-treated mice) of three independent experiments. p = 0.0009 (12 h without anakinra), p = 0.0551 (12 h with anakinra), p < 0.0001 (24 h without anakinra), p = 0.5316 (24 h with anakinra) vs. WT. j Kaplan-Meier survival plots of C. albicans-challenged untreated or anakinra-treated WT and Gsdmd-/- mice. Mice were intravenously challenged with 2 × 10⁵ CFU C. albicans and monitored for 15 days. Log-rank analysis was used. p = 0.0031 (without anakinra), p = 0.4337 (with anakinra) vs. WT.
Fig. 3
Fig. 3. GSDMD facilitates C. albicans escape from macrophages.
a Gsdmd disruption did not affect phagocytosis of C. albicans by macrophages. WT and Gsdmd-/- BMDMs were incubated with GFP-expressing C. albicans for 60 min at MOI 10. Shown are the representative images. Scale bars represent 10 µm. b Quantification of in vitro phagocytosis capacity of BMDMs. Phagocytosis efficiency was expressed as the percentage of BMDMs that engulfed at least one C. albicans. Phagocytosis index was expressed as the average number of internalized C. albicans per 100 cells. At least 200 cells were assessed for each sample. Data shown are means ± SD (n = 5 for WT 15 min, n = 6 for WT 60 min, n = 4 for Gsdmd-/- biologically independent samples per group). c Escape of engulfed C. albicans from macrophages. WT and Gsdmd-/- BMDMs were incubated with C. albicans at MOI 10. Dying cells were stained with propidium iodide (PI) (red) (200 ng/mL). Images were acquired every 5 min for 12 h using a 20× dry lens. Shown are representative images at the indicated time points. Scale bars represent 20 µm. Experiments were repeated three times. The related time-lapse video is included in the Supplemental Materials. d The number of escaped hyphae per macrophage. After 6 h, there were too many hyphae to be counted accurately. At least 200 cells were assessed for each sample. Data shown are means ± SD (n = 5 biologically independent samples per group). Comparisons were conducted with a two-tailed unpaired student’s t test. p = 0.0101 (4 h), p = 0.0257 (6 h) vs. WT. e The percentage of PI-positive BMDMs calculated at each time point. At least 200 cells were assessed for each sample. Data shown are means ± SD (n = 5 biologically independent samples per group). Comparisons were conducted with a two-tailed unpaired student’s t test. p = 0.0171 (9 h), p = 0.0306 (12 h) vs. WT. f C. albicans-induced BMDM death assessed by a lactate dehydrogenase (LDH) cytotoxicity assay. WT and Gsdmd-/- BMDMs were incubated with C. albicans at MOI 10. Relative LDH release was expressed as the percentage LDH activity in supernatants of cultured cells (medium) compared with total LDH (from the medium and cells) and used as an index of cytotoxicity. All values represent mean ± SD of three independent experiments. Comparisons were conducted with a two-tailed unpaired student’s t test. p = 0.0371 (4 h), p = 0.0070 (8 h), p = 0.0008 (12 h), p = 0.0014 (16 h) vs. WT. g Growth of GFP-expressing C. albicans (JKC2078-GFP) in the presence of WT and Gsdmd-deficient macrophages. WT and Gsdmd-/- BMDMs were incubated with GFP-expressing C. albicans for 6 h at MOI 5. The relative C. albicans mass was measured as the percentage fluorescence intensity of macrophage-containing C. albicans cultures compared with C. albicans cultures in the absence of macrophages. All values represent mean ± SD of three independent experiments. Comparisons were conducted with a two-tailed unpaired student’s t test. p = 0.0025 (16 h) vs. WT. h Growth and survival of C. albicans in the presence of WT and Gsdmd-deficient macrophages assessed by a colony formation assay. WT and Gsdmd-/- BMDMs were incubated with C. albicans at MOI 2 for the indicated time periods. Relative C. albicans survival was measured as the percentage CFU in macrophage-containing C. albicans cultures compared with C. albicans cultures in the absence of macrophages. All values represent mean ± SD of three independent experiments. Comparisons were conducted with a two-tailed unpaired student’s t test. p > 0.9999 (2 h), p = 0.0424 (4 h) vs. WT.
Fig. 4
Fig. 4. Hyphae formation is critical for C. albicans-induced GSDMD cleavage and C. albicans escape from macrophages.
a C. albicans-triggered GSDMD cleavage and IL-1β production. BMDMs from WT and Gsdmd-/- mice were infected with WT or hyphae-deficient (cph1Δ/Δ, efg1Δ/Δ) C. albicans for 6 h at MOI 50. GSDMD (cleaved p30 and full-length p53), pro-IL-1β, and mature IL-1β (m-IL-1β) in the cell lysates and m-IL-1β in the supernatants were assessed by western blotting. Results are representative of data from at least three biological replicates. Source data are provided as a Source Data file. b The intensities of protein bands were quantified using ImageJ. Data shown are means ± SD (n = 3 biologically independent samples). Comparisons were conducted with a two-tailed unpaired student’s t test. p = 0.0288 (m-IL1β in lysate), p = 0.0757 (m-IL1β in supernatant) vs. WT. c IL-1β secretion by BMDMs. BMDMs were infected (untreated BMDMs as controls) with WT or hyphae-deficient (cph1Δ/Δ, efg1Δ/Δ) C. albicans (MOI = 10) for 12 h. IL-1β in culture supernatants was measured by ELISA. Data shown are means ± SD (n = 3 biologically independent samples per group). Comparisons were conducted with a two-tailed unpaired student’s t test. p < 0.0001 vs. WT. d Hyphae-dependent IL-1β release calculated by subtracting the level of IL-1β release induced by hyphae-deficient (cph1Δ/Δ, efg1Δ/Δ) mutants from that induced by WT C. albicans. Data shown are means ± SD (n = 3 biologically independent samples per group). Comparisons were conducted with a two-tailed unpaired student’s t test. p < 0.0001 vs. WT. e Hyphae formation was critical for C. albicans escape from macrophages. BMDMs were incubated with WT or hyphae-deficient (cph1Δ/Δ, efg1Δ/Δ) C. albicans at MOI 10. Dying BMDMs were stained with PI (red). Images were acquired as described in Fig. 3c. Shown are representative images at the indicated time points. The related time-lapse video is included in the Supplemental Materials. (f) The percentage of PI-positive BMDMs calculated at each time point. At least 200 cells were assessed for each sample. Data shown are means ± SD (n = 3 biologically independent samples per group). Comparisons were conducted with a two-tailed unpaired student’s t test. p = 0.0199 (3 h), p = 0.0079 (6 h), p < 0.0001 (9 h), p = 0.0001 (12 h) vs. WT. g C. albicans-induced BMDM death assessed by the LDH assay. WT and Gsdmd-/- BMDMs were incubated (untreated BMDMs as controls) with WT or hyphae-deficient (cph1Δ/Δ, efg1Δ/Δ) C. albicans at MOI 10 for 12 h. Relative LDH release was assessed as described in Fig. 3f. Data shown are means ± SD (n = 3 biologically independent samples per group). Comparisons were conducted with a two-tailed unpaired student’s t test. p = 0.0008 Gsdmd-/- (C. albicans) vs. WT (C. albicans). p < 0.0001 (C. albicans) vs. WT (cph1Δ/Δ, efg1Δ/Δ). (h) Hyphae-dependent LDH release calculated by subtracting the level of LDH release induced by hyphae-deficient (cph1Δ/Δ, efg1Δ/Δ) mutants from that induced by WT C. albicans. Data shown are means ± SD (n = 3 biologically independent samples per group). Comparisons were conducted with a two-tailed unpaired student’s t test. p = 0.0025 vs. WT. i Growth and survival of C. albicans assessed by colony formation assays. BMDMs were incubated with WT or hyphae-deficient (cph1Δ/Δ, efg1Δ/Δ) C. albicans at MOI 10 for 6 h. Relative C. albicans survival was measured as described in Fig. 3h. Data shown are means ± SD (n = 6 for C. albicans, n = 7 for cph1Δ/Δ, efg1Δ/Δ). Comparisons were conducted with a two-tailed unpaired student’s t test. p < 0.0001 vs. WT. (j) A schematic diagram illustrating the role of hyphae in mediating macrophage death and facilitating C. albicans escape from macrophages.
Fig. 5
Fig. 5. GSDMD plays critical roles in both candidalysin-dependent and -independent IL-1β secretion by C. albicans infected macrophage.
a, b C. albicans triggered GSDMD cleavage via both candidalysin-dependent and -independent mechanisms. a C. albicans-triggered GSDMD cleavage and IL-1β production. BMDMs from WT and Gsdmd-/- mice were infected with WT or candidalysin-deficient (ece1Δ/Δ) C. albicans for 6 h at MOI 50. GSDMD (cleaved p30 and full-length p53), pro-IL-1β, and mature IL-1β (m-IL-1β) in the cell lysates and m-IL-1β in the supernatants were assessed by western blotting. Results are representative of data from three biological replicates. Source data are provided as a Source Data file. b The intensities of protein bands were quantified using ImageJ. Two-tailed unpaired Student’s t test was used for statistical comparisons. Data shown are means ± SD (n = 3 biologically independent samples per group). p < 0.0001 (GSDMD p30), p = 0.0076 (m-IL-1β in lysate of WT C. albicans-infected BMDM), p = 0.0035 (m-IL-1β in lysate of ece1Δ/Δ-infected BMDM), p = 0.0035 (m-IL-1β in supernatant of WT C. albicans-infected BMDM), p = 0.0032 (m-IL-1β in supernatant of ece1Δ/Δ-infected BMDM) vs. WT. c, d GSDMD was required for both candidalysin-dependent and -independent IL-1β secretion. c IL-1β secretion by BMDMs. BMDMs were infected with WT or candidalysin-deficient (ece1Δ/Δ) C. albicans (MOI = 10) for 12 h. IL-1β in culture supernatants was measured by ELISA. Two-tailed unpaired Student’s t test was used for statistical comparisons. Data shown are means ± SD (n = 3 biologically independent samples per group). Comparisons were conducted with a 2-tailed, unpaired, Student’s t-test. p < 0.0001 vs. WT. d Candidalysin-dependent IL-1β release calculated by subtracting the level of IL-1β release induced by candidalysin-deficient (ece1Δ/Δ) mutants from that induced by WT C. albicans. Two-tailed unpaired Student’s t test was used for statistical comparisons. Data shown are means ± SD (n = 3 biologically independent samples per group). Comparisons were conducted with a 2-tailed, unpaired, Student’s t-test. p = 0.0007 vs. WT.
Fig. 6
Fig. 6. GSDMD mediates both candidalysin-dependent and -independent C. albicans escape from macrophages.
ac Both candidalysin and GSDMD were required for the most efficient escape of engulfed C. albicans from macrophages. a C. albicans escape from macrophages. BMDMs from WT and Gsdmd-/- mice were incubated with WT or candidalysin-deficient (ece1Δ/Δ) C. albicans at MOI 10. Dying cells were stained with PI (red). Images were acquired as described in Fig. 3c. The related time-lapse video is included in the Supplemental Materials. b The number of escaped hyphae per macrophage was assessed as described in Fig. 3d. At least 200 cells were assessed for each sample. Two-tailed unpaired Student’s t test was used for statistical comparisons. Data shown are means ± SD (n = 3 biologically independent samples per group). For escaped hyphae/macrophage in WT mice, p = 0.0025 (2 h), p = 0.0029 (4 h), p < 0.0015 (6 h) vs. C. albicans (WT). For escaped hyphae/macrophage in Gsdmd-/- mice, p = 0.0012 (2 h), p = 0.0089 (4 h), p < 0.0212 (6 h) vs. C. albicans (WT). For escaped hyphae/macrophage in mice challenged with C. albicans (WT), p = 0.0101 (4 h), p = 0.0257 (6 h) vs. WT. For escaped hyphae/macrophage in mice challenged with ece1Δ/Δ, p = 0.0411 (6 h) vs. WT. For escaped hyphae/macrophage (Candidalysin-dependent), p = 0.0449 (6 h) vs. WT. c The percentage of PI-positive BMDMs calculated at each time point. At least 200 cells were assessed for each sample. Two-tailed unpaired Student’s t test was used for statistical comparisons. Data shown are means ± SD (n = 3 biologically independent samples per group). For PI+ cells (WT mice), p = 0.0485 (3 h), p = 0.0007 (6 h), p < 0.0009 (9 h), p < 0.001 (12 h) vs. C. albicans (WT). For PI+ cells (Gsdmd-/- mice), p = 0.0007 (6 h), p = 0.0009 (9 h), p < 0.001 (12 h) vs. C. albicans (WT). For PI+ BMMCs (challenged with C. albicans (WT)), p = 0.019 (9 h) vs. WT. For PI+ BMMCs (challenged with ece1Δ/Δ), p = 0.0454 (9 h), p = 0.0358 (12 h) vs. WT. For PI+ BMMCs (Candidalysin-dependent), p = 0.0391 (6 h), p = 0.018 (9 h) vs. WT. d C. albicans-induced BMDM death assessed by the LDH assay. WT and Gsdmd-/- BMDMs were incubated (uninfected BMDMs as controls) with WT or candidalysin-deficient (ece1Δ/Δ) C. albicans at MOI 10 for 12 h. Relative LDH release was assessed as described in Fig. 3f. Candidalysin-dependent LDH release calculated by subtracting the level of LDH release induced by candidalysin-deficient (ece1Δ/Δ) mutants from that induced by WT C. albicans. Two-tailed unpaired Student’s t test was used for statistical comparisons. Data shown are means ± SD (n = 3 biologically independent samples per group). p = 0.0008 (C. albicans (WT)), p = 0.0011 (ece1Δ/Δ) vs. WT.
Fig. 7
Fig. 7. Candidalysin-deficient C. albicans cause less severe infection and tissue damage.
a Kaplan-Meier survival plots of mice infected with WT or candidalysin-deficient (ece1Δ/Δ) C. albicans. Mice were intravenously challenged with 1 × 10⁶ CFU C. albicans. Survival rates were analyzed using Kaplan-Meier survival curves and log-rank testing. p = 0.0003 vs. WT. b Clinical scores of mice challenged with WT or candidalysin-deficient (ece1Δ/Δ) C. albicans. Two-tailed unpaired Student’s t test was used for statistical comparisons. Data shown are means ± SD (n = 10 mice per group). p = 0.0388 (16 h), p = 0.0483 (24 h), p = 0.0074 (30 h) vs. WT C. albicans. c Up panel, comparison of the kidneys of mice challenged with WT or candidalysin-deficient (ece1Δ/Δ) C. albicans. Mice were sacrificed 2 days after intravenous injection of 1 × 10⁶ CFU C. albicans. Shown are representative images. Lower panel, kidney weights of C. albicans-challenged mice. Two-tailed unpaired Student’s t test was used for statistical comparisons. Data shown are means ± SD (n = 8 kidneys per group). p = 0.0136 (ece1Δ/Δ), p = 0.0008 (w/o C. albicans) vs. WT C. albicans. d Histopathologic assessment of the kidneys of mice challenged with WT or candidalysin-deficient (ece1Δ/Δ) C. albicans. Mice were sacrificed 2 days after intravenous injection of 1 ×10⁶ CFU C. albicans. Shown are representative H&E-stained sections of kidney tissues. Experiments were repeated three times. e Fungal burden of kidneys, livers, and spleens of mice challenged with WT or candidalysin-deficient (ece1Δ/Δ) C. albicans. Mice were sacrificed 2 days after intravenous injection of 1 × 10⁶ CFU C. albicans. Two-tailed unpaired Student’s t test was used for statistical comparisons. Data shown are means ± SD (n = 7 for WT C. albicans-challenged mice, n = 8 for ece1Δ/Δ-challenged mice per group). p = 0.0032 (kidney) vs. WT C. albicans. f C. albicans in the kidney were identified by Grocott methenamine silver staining. Mice were sacrificed 2 days after intravenous injection of 1 × 10⁶ CFU C. albicans. Results are representative of data from at least three biological replicates.
Fig. 8
Fig. 8. C. albicans-induced GSDMD cleavage and C. albicans escape from macrophages relies on inflammasome activation.
a Casp1/11-mediated C. albicans-induced BMDM death. BMDMs from WT and Casp-1/11-/- mice were infected with C. albicans at MOI 10. BMDM death at the indicated time points was measured as relative LDH release as described in Fig. 3f. Two-tailed unpaired Student’s t test was used for statistical comparisons. Data shown are means ± SD (n = 3 biologically independent samples per group). p = 0.0016 (4 h), p = 0.0282 (8 h), p = 0.0172 (16 h) vs. WT. b Casp1/11-mediated C. albicans escape from macrophages. BMDMs from WT and Casp-1/11-/- mice were infected with C. albicans at MOI 10. Dying cells were stained with PI (red). Experiments were repeated three times. The related time-lapse video is included in the Supplemental Materials. c The percentage of PI-positive BMDMs calculated at each time point. At least 100 cells were assessed for each sample. Two-tailed unpaired Student’s t test was used for statistical comparisons. Data shown are means ± SD (n = 3 biologically independent samples per group). p = 0.0484 (3 h), p = 0.0257 (6 h) vs. WT. d Potassium efflux was essential for C. albicans-triggered GSDMD cleavage in BMDMs. BMDMs from WT or Gsdmd-/- mice were cultured in the indicated concentrations of KCl for 1 h and then infected with WT C. albicans for 6 h at MOI 50. Full-length (p53) and cleaved (p30) GSDMD in the cell lysates were detected by western blotting. Results are representative of data from three biological replicates. Source data are provided as a Source Data file. e C. albicans-induced BMDM death assessed by LDH assay. BMDMs were cultured in the indicated concentrations of KCl for 1 h and then infected (uninfected BMDMs as controls) with WT, candidalysin-deficient (ece1Δ/Δ), or hyphae-deficient (cph1Δ/Δ, efg1Δ/Δ) C. albicans at MOI 10 for 12 h. Relative LDH release was assessed as described in Fig. 3f. Two-tailed unpaired Student’s t test was used for statistical comparisons. Data shown are means ± SD (n = 3 biologically independent samples per group). For cph1Δ/Δ, efg1Δ/Δ-infected BMMCs, p = 0.0016 (KCl 50 mM) vs. KCl untreated macrophages. For KCl -untreated BMMCs, p < 0.0001 (ece1Δ/Δ, cph1Δ/Δ, efg1Δ/Δ, w/o C. albicans) vs. WT C. albicans. For KCl 30 mM -treated BMMCs, p = 0.0001 (cph1Δ/Δ, efg1Δ/Δ), p < 0.0001 (ece1Δ/Δ, w/o C. albicans) vs. WT C. albicans. For KCl 50 mM-treated BMMCs, p = 0.0001 (ece1Δ/Δ), p < 0.0001 (cph1Δ/Δ, efg1Δ/Δ, w/o C. albicans) vs. WT C. albicans. f Candidalysin-dependent LDH release calculated by subtracting the level of LDH release induced by candidalysin-deficient (ece1Δ/Δ) C. albicans from that induced by WT C. albicans. Two-tailed unpaired Student’s t test was used for statistical comparisons. Data shown are means ± SD (n = 3 biologically independent samples per group). p = 0.0052 (KCl 30 mM), p = 0.0036 (KCl 50 mM) vs. KCl untreated macrophages. g Potassium efflux was critical for C. albicans escape from macrophages. BMDMs were cultured in the indicated concentrations of KCl for 1 h and then infected with WT C. albicans at MOI 10. Dying cells were stained with PI (red). Images were acquired as described in Fig. 3c. Shown are representative images at the indicated time points. The related time-lapse video is included in the Supplemental Materials. h The percentage of PI-positive BMDMs calculated at each time point. At least 100 cells were assessed for each sample. Two-tailed unpaired Student’s t test was used for statistical comparisons. Data shown are means ± SD (n = 3 biologically independent samples per group). p = 0.016 (KCl 50 mM) vs. KCl untreated macrophages.
Fig. 9
Fig. 9. GSDMD antagonist NSA alleviates C. albicans infection in mice.
a Experimental scheme for assessing the effects of pharmacologic inhibition of GSDMD on C. albicans infection. Mice were intravenously challenged with 2 × 10⁵ CFU C. albicans 1 h after intraperitoneal injection of sesame oil alone (control) or NSA (dissolved in sesame oil, 20 mg/kg body weight). The challenged mice received daily NSA treatment (20 mg/kg body weight) and were monitored for 15 days. Controls were injected with sesame oil only during the same time period. b Kaplan-Meier survival plots of C. albicans-challenged mice. Survival rates were analyzed using Kaplan-Meier survival curves and log-rank testing. p = 0.0427 vs. control. c Clinical score of C. albicans-challenged untreated and NSA-treated mice. Two-tailed unpaired Student’s t test was used for statistical comparisons. Data presented are the means ± SD (n = 8 mice per data point) of three independent experiments. p = 0.005 vs. control. d Comparison of the kidneys of C. albicans-challenged untreated and NSA-treated mice. Mice were sacrificed 2 weeks after the C. albicans infection. Shown are the representative images from three independent experiments. e Kidney weights of C. albicans-challenged mice. Two-tailed unpaired Student’s t test was used for statistical comparisons. Data presented are the means ± SD (n = 6 for Vehicle, n = 7 for NSA-treated mice per data point) of three independent experiments. p = 0.0279 vs. control. f Fungal burden of kidneys from untreated and NSA-treated mice 2 days after C. albicans infection. Two-tailed unpaired Student’s t test was used for statistical comparisons. Data presented are the means ± SD (n = 8 mice per data point) of three independent experiments. p = 0.0379 vs. control. g C. albicans-induced IL-1β production in untreated and NSA-treated mice. Mice were intravenously challenged with 2 × 10⁵ CFU C. albicans. Two-tailed unpaired Student’s t test was used for statistical comparisons. Data shown are means ± SD (n = 5 for uninfected, n = 7 for C. albicans infected mice). p = 0.0242 vs. control (untreated mice).
Fig. 10
Fig. 10. GSDMD antagonist NSA alleviates C. albicans-induced death of human macrophages.
a NSA suppressed C. albicans-triggered hGSDMD cleavage in human monocyte-derived macrophages (hMDMs). NSA treated and untreated hMDMs were infected with WT C. albicans for 6 h at MOI 50. Full-length (p53) hGSDMD, cleaved (p30) hGSDMD, mature IL-1β (m-IL-1β), and actin in the cell lysates, as well as m-IL-1β and cleaved caspase-1 (C- caspase-1) in the supernatant, were detected by western blotting. The figure shows the result of a representative experiment that was repeated 3 times. The intensities of protein bands were quantified using ImageJ. UT, uninfected. Two-tailed unpaired Student’s t test was used for statistical comparisons. Data shown are means ± SD. p < 0.0001 vs. untreated (Vehicle). Source data are provided as a Source Data file. b IL-1β secretion by hMDMs. hMDMs were infected with C. albicans (MOI = 10) for the indicated time periods. IL-1β in culture supernatants was measured by ELISA. Two-tailed unpaired Student’s t test was used for statistical comparisons. Data shown are means ± SD (n = 3 biologically independent samples per group). p = 0.005 (4 h), p = 0.0012 (8 h), p = 0.0014 (12 h), p = 0.0048 (16 h) vs. untreated (Vehicle). (c) NSA treated and untreated hMDMs were incubated with C. albicans at MOI 10. Dying cells were stained with propidium iodide (PI) (red) (200 ng/mL). Images were acquired at indicated time points using 20× dry lens. Shown are representative images at the indicated time points. Scale bars represent 20 µm. Experiments were repeated three times. (d) The percentage of PI-positive hMDMs calculated at each time point. At least 200 cells were assessed for each sample. Two-tailed unpaired Student’s t test was used for statistical comparisons. Data shown are means ± SD (n = 4 biologically independent samples per group). p = 0.044 (3 h), p = 0.384 (6 h), p = 0.049 (9 h) vs. NSA untreated. e C. albicans-induced hMDM death assessed by LDH cytotoxicity assay. NSA treated and untreated hMDMs were incubated with C. albicans at MOI 10. Relative LDH release was expressed as the percentage LDH activity in supernatants of cultured cells (medium) compared with total LDH (from the medium and cells) and used as an index of cytotoxicity. Two-tailed unpaired Student’s t test was used for statistical comparisons. Data shown are means ± SD (n = 3). Results are representative of data from three biological replicates. p = 0.0007 (4 h), p = 0.0002 (8 h), p < 0.0001 (12 h), p < 0.0001 (16 h) vs. NSA untreated. f, g Candidalysin partially mediated C. albicans-induced death of human macrophages. f hMDMs were incubated with WT (Fig. 10c) or candidalysin-deficient (ece1Δ/Δ) C. albicans at MOI 10. Dying cells were stained with PI (red). Images were acquired as described in Fig. 10c. g The percentage of PI-positive hMDMs calculated at each time point. At least 200 cells were assessed for each sample. Data shown are means ± SD (n = 4 biologically independent samples per group). Two-tailed unpaired Student’s t test was used for statistical comparisons. p = 0.0429 (6 h), p < 0.0001 (9 h), p < 0.0096 (12 h) vs. WT C. albicans. (h) C. albicans-induced hMDM death assessed by the LDH assay. NSA treated and untreated hMDMs were incubated with WT or candidalysin-deficient (ece1Δ/Δ) C. albicans at MOI 10 for 12 h. Relative LDH release was assessed as described in Fig. 10e. Candidalysin-dependent LDH release was calculated by subtracting the level of LDH release induced by candidalysin-deficient (ece1Δ/Δ) mutants from that induced by WT C. albicans. Two-tailed unpaired Student’s t test was used for statistical comparisons. Data shown are means ± SD (n = 3 biologically independent samples per group). For LDH release, p < 0.0001 (WT C. albicans), p = 0.0002 (ece1Δ/Δ) vs. untreated (Vehicle). For candidalysin-dependent LDH release, p = 0.0015 vs. untreated (Vehicle). (i) GSDMD was required for both candidalysin-dependent and -independent IL-1β secretion. hMDMs were infected with WT or candidalysin-deficient (ece1Δ/Δ) C. albicans (MOI = 10) for 12 h. IL-1β in culture supernatants was measured by ELISA. Candidalysin-dependent IL-1β release was calculated by subtracting the level of IL-1β release induced by candidalysin-deficient (ece1Δ/Δ) mutants from that induced by WT C. albicans. Two-tailed unpaired Student’s t test was used for statistical comparisons. Data shown are means ± SD (n = 3 biologically independent samples per group). For IL-1β concentration, p < 0.0001 (WT C. albicans), p = 0.0248 (ece1Δ/Δ) vs. untreated (Vehicle). For candidalysin-dependent IL-1β release, p = 0.0007 vs. untreated (Vehicle).

References

    1. Brown GD, et al. Hidden killers: human fungal infections. Sci. Transl. Med. 2012;4:165rv113. - PubMed
    1. Delaloye J, Calandra T. Invasive candidiasis as a cause of sepsis in the critically ill patient. Virulence. 2014;5:161–169. - PMC - PubMed
    1. Singer M, et al. The Third International Consensus Definitions for Sepsis and Septic Shock (Sepsis-3) JAMA. 2016;315:801–810. - PMC - PubMed
    1. Hotchkiss RS, et al. Sepsis and septic shock. Nat. Rev. Dis. Primers. 2016;2:16045. - PMC - PubMed
    1. Minasyan H. Sepsis and septic shock: Pathogenesis and treatment perspectives. J. Critical Care. 2017;40:229–242. - PubMed

Publication types

MeSH terms