. 2021 Nov 18;12(1):6693.
doi: 10.1038/s41467-021-27047-4.

Generation of a Gluconobacter oxydans knockout collection for improved extraction of rare earth elements

Affiliations

Generation of a Gluconobacter oxydans knockout collection for improved extraction of rare earth elements

Alexa M Schmitz et al. Nat Commun. .

Abstract

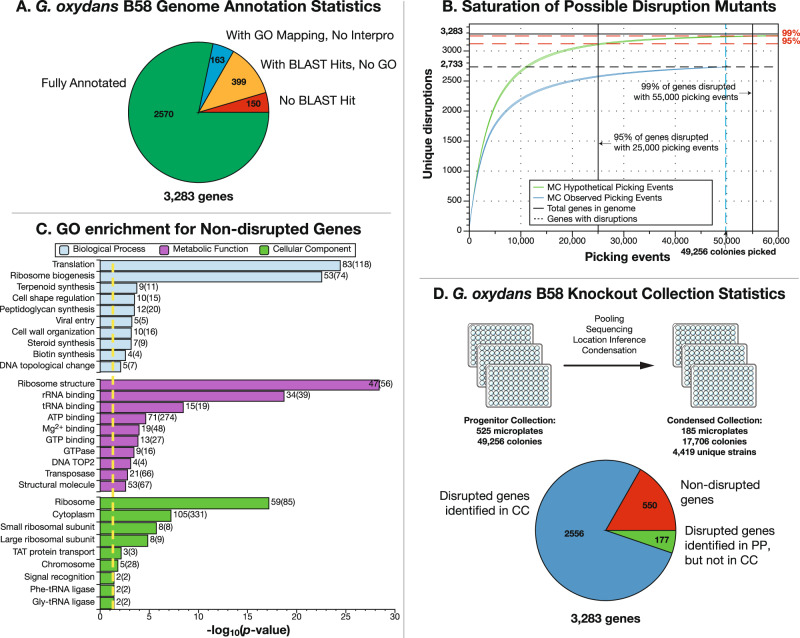
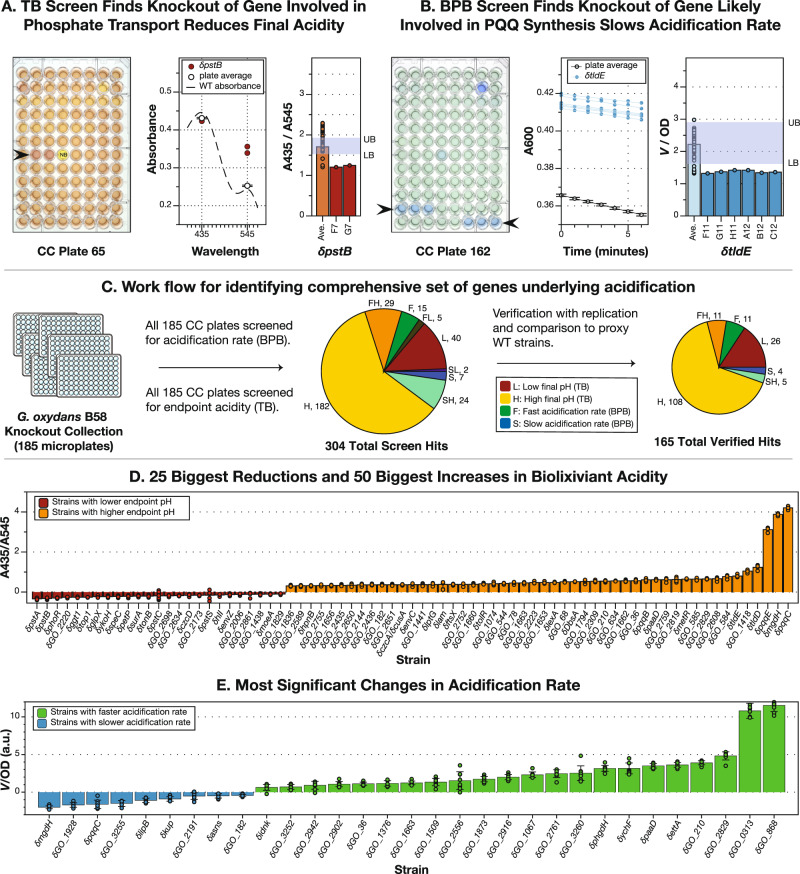
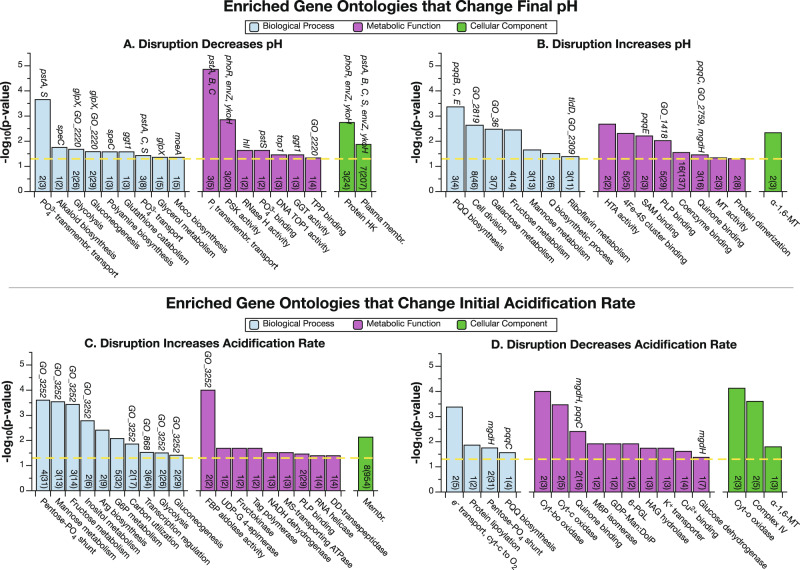
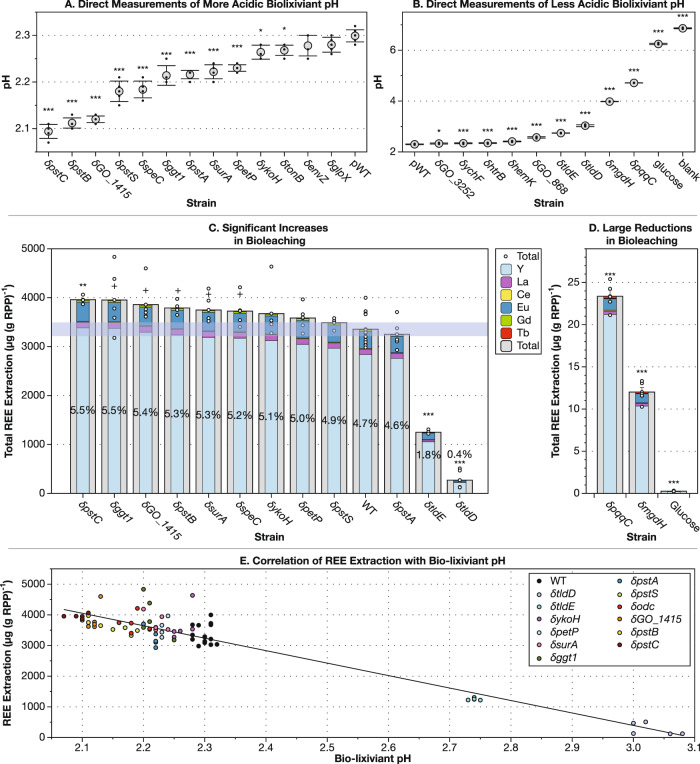
Bioleaching of rare earth elements (REEs), using microorganisms such as Gluconobacter oxydans, offers a sustainable alternative to environmentally harmful thermochemical extraction, but is currently not very efficient. Here, we generate a whole-genome knockout collection of single-gene transposon disruption mutants for G. oxydans B58, to identify genes affecting the efficacy of REE bioleaching. We find 304 genes whose disruption alters the production of acidic biolixiviant. Disruption of genes underlying synthesis of the cofactor pyrroloquinoline quinone (PQQ) and the PQQ-dependent membrane-bound glucose dehydrogenase nearly eliminates bioleaching. Disruption of phosphate-specific transport system genes enhances bioleaching by up to 18%. Our results provide a comprehensive roadmap for engineering the genome of G. oxydans to further increase its bioleaching efficiency.


Conflict of interest statement

The authors A.M.S, B.P., S.M. and B.B. are pursuing patent protection for engineered organisms using knowledge gathered in this work (US provisional application 63/220,475). The remaining authors declare no competing interests.

Figures

Fig. 1
Fig. 1. Knockout Sudoku was used to curate a saturating coverage transposon insertion mutant collection for Gluconobacter oxydans B58.
A The G. oxydans B58 genome contains 3283 genes. Two thousand five hundred and seventy genes were fully annotated with a BLAST hit, InterPro ID, and gene ontology (GO) group. An additional 163 genes had an annotation and GO group but lacked an InterPro ID; 399 retrieved only a BLAST hit, and 150 were unable to be assigned any annotation. B A Monte Carlo (MC) estimate (green curve) of the number of genes represented by at least one mutant as a function of the number of mutants collected demonstrated that picking 25,000 mutants would yield at least one disruption for 95% of genes, while picking 50,000 mutants would yield at least one disruption for 99% of genes. In total, we picked 49,256 single-gene disruption mutants and located at least one disruption for 2733 genes. A Monte Carlo simulation (blue curve) of picking with random drawing from the sequenced progenitor collection (PC) without replacements demonstrates that the genome coverage was truly saturated. The center of each curve is the mean value of the unique gene disruption count from 1000 simulations, while the upper and lower parts of each curve represent two standard deviations around this mean. C A one-sided Fisher’s exact test for gene ontology enrichment among the non-disrupted (putatively essential) genes revealed significant enrichment (p < 0.05, yellow line) of genes involved in translation and other ribosome-related functions. D The curated condensed collection (CC) contains 17,706 isolated colonies across 185 plates. High-throughput sequencing of the CC confirmed the location for 4419 unique disruption strains, representing disruptions in 2556 genes. Hundred and seventy-seven genes located in the PC were not located in the CC. No disruption mutant was detected in 550 genes.
Fig. 2
Fig. 2. High-throughput pH screens of the G. oxydans whole genome knockout collection were used to identify genes that control REE bioleaching.
A Thymol blue (TB) was used to measure the endpoint acidity of biolixiviant produced by each well of the condensed collection. The ratio of TB absorbance (A) at 435 and 545 nm is linearly related to pH between 2 and 3.4 (Supplementary Fig. 1). CC plate 65 contains biolixiviant produced by δpstB strain in wells F7 and G7 (arrowhead), whose absorbance at 435 and 545 nm are shown (middle panel, red dots), along with the average absorbance of all occupied wells on the plate (n = 94) (white dot; error bars are SEM). The dashed line represents a typical absorbance spectrum for WT-produced biolixiviant. The A435/A545 ratio for these two wells (right panel, red bars and dots) compared with the mean ratio of the plate (orange bar; orange dots show individual data points) is well below the lower bound (LB) for the plate, indicating that δpstB produces a much more acidic biolixiviant than the average strain. B Bromophenol blue (BPB) was used to measure rate of change in pH at the onset of glucose conversion to organic acids. Rate was measured over a 6 min period within five minutes of adding bacteria to a glucose and BPB solution. Condensed collection (CC) plate 162 contains the δtldE strain in wells F11–C12 (arrowheads), whose changes in absorbance over time are graphed along with the average for that plate (middle panel, n = 94). A comparison of the normalized rate over OD for each well (right panel, dark blue bars and dots) versus the plate mean (light blue bar; dots show individual data points) shows how V/OD for these wells was below the lower bound for CC plate 162. C All 185 plates of the CC were screened for acidification using TB and BPB assays. Hits from both screens were verified in comparison with proxy WT strains. In total, 176 disruption strains were shown to significantly contribute to acidification. D, E Comparisons with proxy WT strains were made by a two-tailed t-test with a Bonferroni-corrected alpha (α = 0.05/N where N is the number of comparisons). Bars represent mean values and dots represent individual data points. Error bars represent standard deviation. D The 25 largest significant reductions in biolixiviant pH and 50 largest significant increases in biolixiviant pH. N = 120 or N = 242 for comparisons with pWT set A or set B, respectively. (The full data set and number of biological replicates for each strain can be found in Supplementary Data 6E). E All significant changes in acidification rate, N = 60 (The full data set and number of biological replicates for each strain can be found in Supplementary Data 6F).
Fig. 3
Fig. 3. Genes involved in phosphate signaling, carbohydrate metabolism and PQQ synthesis were significantly overrepresented in the significant hits from high-throughput screens of acidification by G. oxydans.
A one-sided Fisher’s Exact Test was used to test for gene ontology enrichment (p < 0.05, yellow dashed line). Numbers at the base of bars are how many genes from the significant hits are from that gene ontology (GO), out of the total in the genome (in parentheses). Genes selected for further analysis of endpoint pH and bioleaching (Fig. 4) that contribute to an enriched GO are listed above the bars. A, B Enriched GO terms among genes that decreased and increased the end point pH. C, D Enriched GO terms among genes that increased and decreased the initial acidification rate. FBP fructose-bisphosphate, GDP-Man:DolP dolichyl-phosphate beta-d-mannosyltransferase, GGT glutathione hydrolase, G6P glucose 6-phosphate, HTA homoserine O-acetyltransferase, DD-transepeptidase D-Ala-D-Ala carboxypeptidase, HAG hydroxyacylglutathione, Membr membrane, Moco Mo-molybdopterin cofactor, MS monosaccharide, MT mannosyltransferase, M6P mannose-6-phosphate, Pi inorganic phosphate, PLP pyridoxal phosphate, PQQ pyrroloquinoline quinone, PSK phosphorelay sensor kinase, Q queuosine, RNase H DNA–RNA hybrid ribonuclease, SAM S-adenosyl-l-methionine, TPP thiamine pyrophosphate, TOP1 topoisomerase type 1, HK histidine kinase, UDP-G uracil-diphosphate glucose, 6-PGL 6-phosphogluconolactonase.
Fig. 4
Fig. 4. Increased acidification strains of G. oxydans B58 are able to increase rare earth extraction from retorted phosphor powder (RPP).
A, B A subset of 22 disruption strains was tested for acidification with direct pH measurement. Gray circles represent the mean pH for each strain and comparisons were made with wild type by two-tailed t-test with Bonferonni correction (N = 22). pH measurements significantly different from pWT are labeled with asterisks: *p < 0.05/22; **p < 0.01/22; ***p < 0.001/22 (n = 5 biological replicates, df = 18). Error bars represent standard deviation. Individual data points are shown as black dots. C, D Ten disruption strains with the lowest final biolixiviant pH and four with the highest were tested for RPP bioleaching capabilities. Outer gray bars represent the mean total REE extracted for each biolixiviant. Inner multicolored bars represent fractional contributions of each REE. Error bars represent standard error around the mean total REE extracted. Percentages are total REE extraction efficiency (based on previously published REE amounts in the RPP). Individual data points for total REE extracted are shown as white dots. C Comparison with a two-tailed t-test between each mutant and pWT demonstrated that eight strains were significantly better or worse at bioleaching total REEs (+p < 0.05; n = 5 biological replicates, df = 18). With a Bonferroni correction (N = 12), only one was significantly better (**p = 5.30 × 10−4 for δpstC), but two of the higher pH biolixiviants that extracted detectable REEs were significantly attenuated in bioleaching capability (***p = 1.71 × 10−11 and 6.32 × 10−14 for δtldE and δtldD, respectively). Light purple shading represents the mean and standard deviation for total REE bioleached by pWT biolixiviant. D Disruption mutants for mgdh and pqqC are only able to extract less than 1% of the REE that wild-type G. oxydans can but still extract significantly more REE than glucose alone when measured at a lesser dilution (two-tailed t-test with Bonferroni correction, N = 2: ***p = 9.71 × 10−10 and 2.47 × 10−8 for δpqqC and δmgdh, respectively, n = 5 biological replicates). E Total REE extraction is plotted versus pH for each replicate for each strain, demonstrating how the two are linearly related. Each data point is color coded by strain, as indicated in the plot legend.

References

    1. Bauer, D. et al. Critical Materials Strategy (U.S. Department of Energy, 2011).
    1. Grasso, V. B. Rare earth elements in national defense: background, oversight issues, and options for congress. Report No. R41744, (Congressional Research Service, 2013).
    1. Humphries, M. Rare earth elements: the global supply chain. Report No. R41347, (Congressional Research Service, 2013).
    1. Dent PC. Rare earth elements and permanent magnets. J. Appl. Phys. 2012;111:07A721.
    1. Nazarov, M. & Noh, D. New Generation of Europium-Activated and Terbium-Activated Phosphors (Pan Stanford Publishing, 2011).

Publication types

MeSH terms

LinkOut - more resources