. 2021 Nov 18;12(1):6690.
doi: 10.1038/s41467-021-27026-9.

Single-cell analysis of diverse immune phenotypes in malignant pleural effusion

Affiliations

Single-cell analysis of diverse immune phenotypes in malignant pleural effusion

Zhong-Yin Huang et al. Nat Commun. .

Abstract

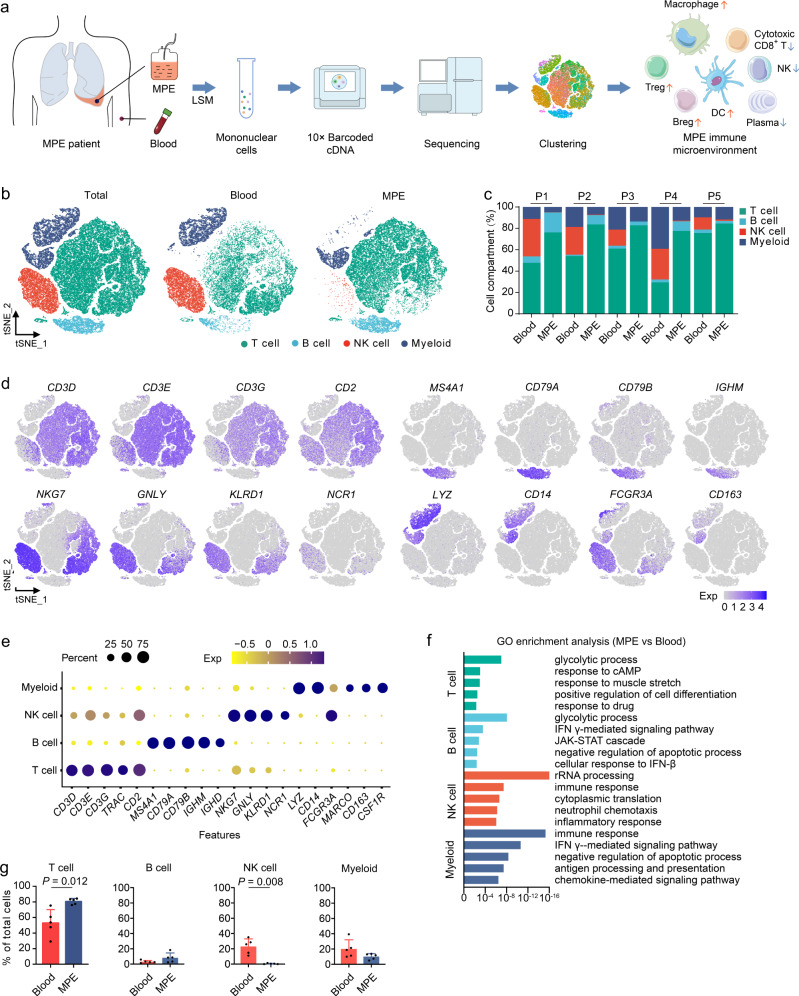
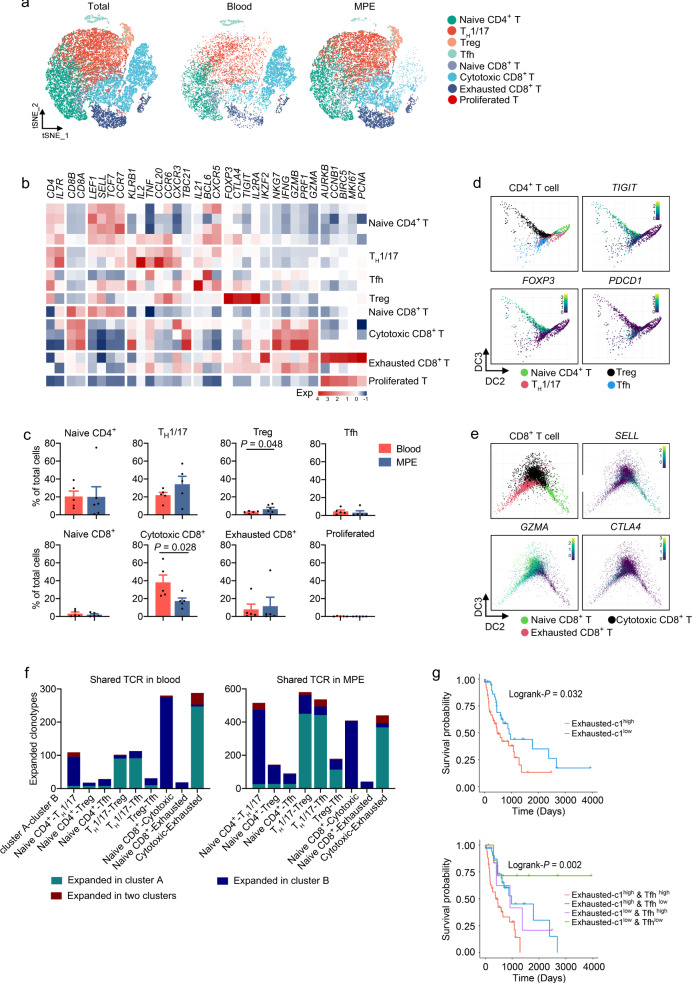
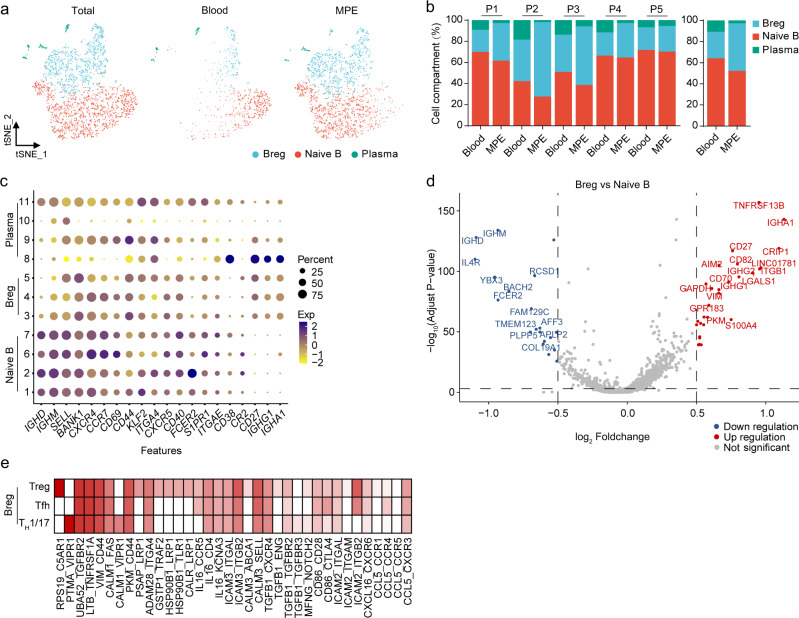
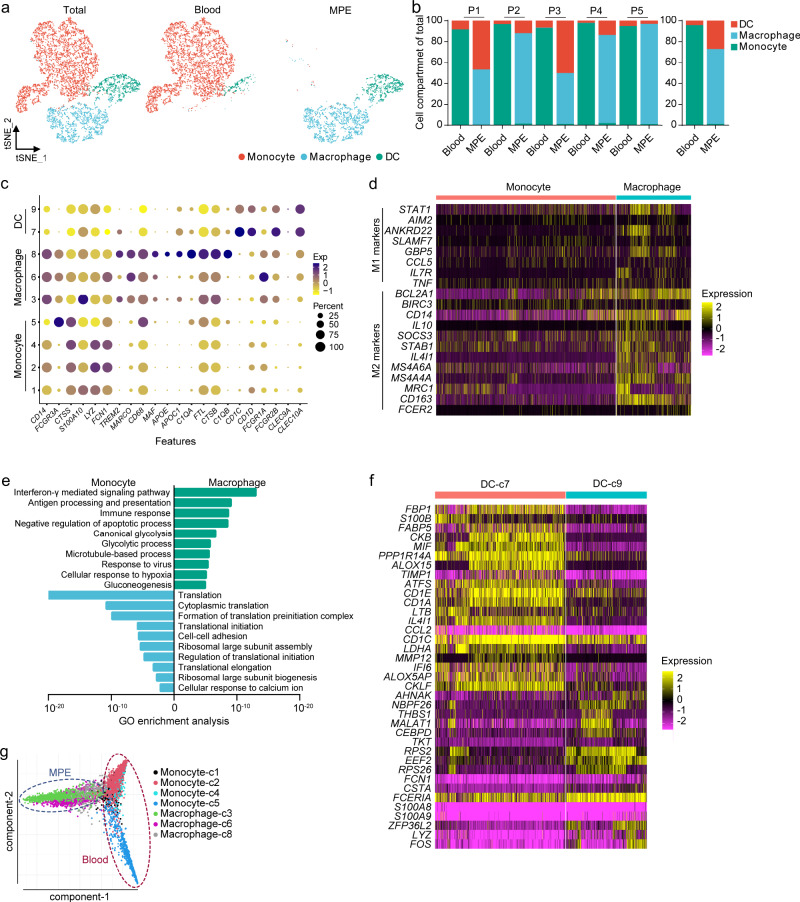
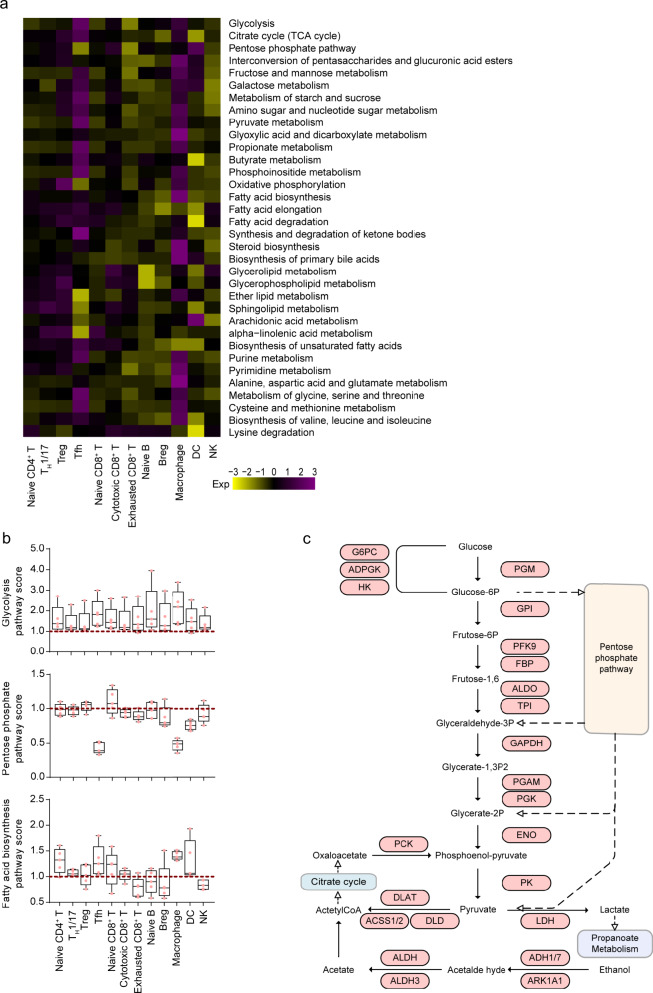
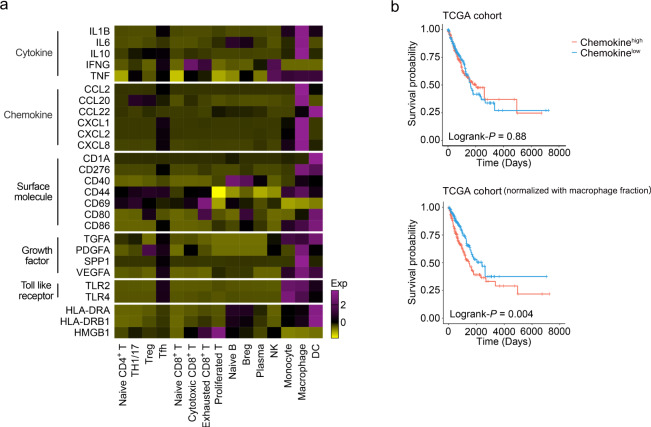
The complex interactions among different immune cells have important functions in the development of malignant pleural effusion (MPE). Here we perform single-cell RNA sequencing on 62,382 cells from MPE patients induced by non-small cell lung cancer to describe the composition, lineage, and functional states of infiltrating immune cells in MPE. Immune cells in MPE display a number of transcriptional signatures enriched for regulatory T cells, B cells, macrophages, and dendritic cells compared to corresponding counterparts in blood. Helper T, cytotoxic T, regulatory T, and T follicular helper cells express multiple immune checkpoints or costimulatory molecules. Cell-cell interaction analysis identifies regulatory B cells with more interactions with CD4+ T cells compared to CD8+ T cells. Macrophages are transcriptionally heterogeneous and conform to M2 polarization characteristics. In addition, immune cells in MPE show the general up-regulation of glycolytic pathways associated with the hypoxic microenvironment. These findings show a detailed atlas of immune cells in human MPE and enhance the understanding of potential diagnostic and therapeutic targets in advanced non-small cell lung cancer.


Conflict of interest statement

The authors declare no competing interests.

Figures

Fig. 1
Fig. 1. Comprehensive dissection and clustering of single cells from MPE and blood.
a The flowchart of the overall study design. scRNA-seq and expression analysis of malignant pleural effusion (MPE) and blood samples (n = 5) were performed on the 10× Genomics platform. b t-SNE plots within each sample type, color-coded by cell types. c Average proportion of each cell type derived from each patient, color-coded by cell types. d Canonical marker genes for the immune cell types defined in Fig. 1b. Data are colored according to expression levels. e Dot plot of average expression of canonical marker genes for the immune cell types defined in Fig. 1b. f Gene ontology (GO) enrichment analysis using the genes upregulated in MPE compared with blood for each cell type. The statistical significance was tested by Fisher’s exact test and adjusted by Benjamini–Hochberg correction. g Frequencies of four immune cell types in MPE and blood according to the t-SNE plot using scRNA-seq data. Data are presented as mean ± SD. Comparisons were made using two tailed paired Student’s t test. Blood, n = 5 samples, MPE, n = 5 samples.
Fig. 2
Fig. 2. Dissection and clustering of T cells in MPE patients.
a t-SNE plots of T cells within each cell type, color-coded by T cell subsets. b Heatmap of selected T cell marker genes in each T cell subset. c Frequencies of T cell subsets in MPE and blood according to the t-SNE plot using scRNA-seq data. Data are presented as mean ± SD. Comparisons were made using two-tailed paired Student’s t test. Blood, n = 5 samples; MPE, n = 5 samples. d Diffusion map of CD8+ T cell functional state transitions. DC diffusion component. e Diffusion map of CD4+ T cell functional state transitions. DC diffusion component. f Bar plots summarizing the distributions of expanded TCRs between given two clusters. TCR T cell receptor. g The Kaplan–Meier overall survival curves of TCGA LUAD patients grouped by the gene signature of exhausted-c1 (upper panel) or exhausted-c1 and Tfh (lower panel). The high and low groups are divided by the median value of the mean expression of signature gene after normalization by T cell fractions estimated by CIBERSORT. The statistical significance was calculated using two-sided log-rank test.
Fig. 3
Fig. 3. Dissection and clustering of B cells in MPE patients.
a t-SNE plots of B cells within each cell type, color-coded by B cell subsets. b Average proportion of each cell subset derived from each patient (left panel) and MPE or blood (right panel). c Dot plot of the average expression of canonical marker genes for B cells. Y-axis: Seurat-clusters in Supplementary Fig. 3a. d Scatter plot of differentially expressed genes of the Breg cells in comparison with naive B cells in MPE. e Heatmap of cell-to-cell interaction scores between Breg cells and Th1/17 cells, Treg cells, or Tfh cells.
Fig. 4
Fig. 4. Dissection and clustering of myeloid cells in MPE patients.
a t-SNE plots of myeloid cells within each cell type, color-coded by myeloid cell subsets. b Average proportion of each cell subset derived from each patient (left panel) and MPE or blood (right panel). c Dot plot of the average expression of canonical marker genes for myeloid cells. Y-axis: Seurat-clusters in Supplementary Fig. 4a. d The heatmap of M1 and M2 marker genes in monocytes or macrophages. e GO enrichment analysis between monocytes and macrophages. f The heatmaps show the genes differentially expressed in dendritic cell (DC) subsets. The statistical significance was tested by Fisher’s exact test and adjusted by Benjamini–Hochberg correction. g Diffusion map of myeloid cell subset functional state transitions.
Fig. 5
Fig. 5. Metabolic heterogeneity in MPE patients.
a Heatmap of the indicated metabolic pathway scores in MPE. The expression value used in the heatmap is the ratio of the average enrichment scores of the corresponding pathway in MPE and blood. b Distributions of the average enrichment score of the indicated metabolic pathways in MPE immune cell subtypes. c Map of glycolysis metabolic pathways of Tfh cells. The genes marked in red are upregulated in MPE vs. blood. n = 5 samples. The box plots were defined by the interquartile range (IQR, the range between the 25% and 75%) and the median, whiskers represent the upper and lower value within 1.5 times the IQR.
Fig. 6
Fig. 6. The expression of genes determined by genome-wide association studies in MPE and blood.
The heatmaps show the average expression levels of genes previously indicated in genome-wide association studies of non-small cell lung cancer in Chinese Han.
Fig. 7
Fig. 7. Expression and survival analysis of genes associated with MPE formation.
a The heatmap shows the mean expression of genes previously indicated to be associated with MPE formation. b The Kaplan–Meier overall survival curves of TCGA LUAD patients grouped by the gene signature of chemokine. The high and low groups are divided by the median value of mean expression of chemokine (upper panel) or with normalization by CIBERSORT (lower panel). Statistical significance was calculated using two-sided log-rank test.

References

    1. Taghizadeh N, Fortin M, Tremblay A. US hospitalizations for malignant pleural effusions: data from the 2012 national inpatient sample. Chest. 2017;151:845–854. - PubMed
    1. Walker S, Mercer R, Maskell N, Rahman NM. Malignant pleural effusion management: keeping the flood gates shut. Lancet Respir. Med. 2020;8:609–618. - PubMed
    1. Ryu JS, et al. Prognostic impact of minimal pleural effusion in non-small-cell lung cancer. J. Clin. Oncol. 2014;32:960–967. - PubMed
    1. Clive AO, et al. Predicting survival in malignant pleural effusion: development and validation of the LENT prognostic score. Thorax. 2014;69:1098–1104. - PMC - PubMed
    1. Bibby, A. C. et al. ERS/EACTS statement on the management of malignant pleural effusions. Eur. Respir. J.52, 1800349 (2018). - PubMed

Publication types

MeSH terms