. 2021 Nov 18;12(1):6703.
doi: 10.1038/s41467-021-27040-x.

Multifactorial seroprofiling dissects the contribution of pre-existing human coronaviruses responses to SARS-CoV-2 immunity

Affiliations

Multifactorial seroprofiling dissects the contribution of pre-existing human coronaviruses responses to SARS-CoV-2 immunity

Irene A Abela et al. Nat Commun. .

Abstract

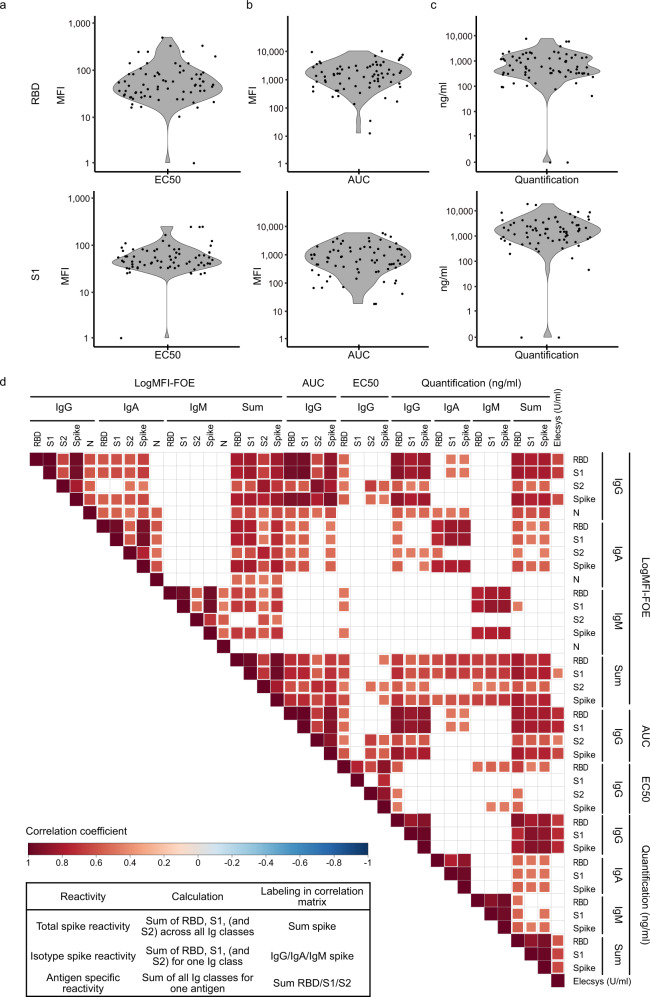
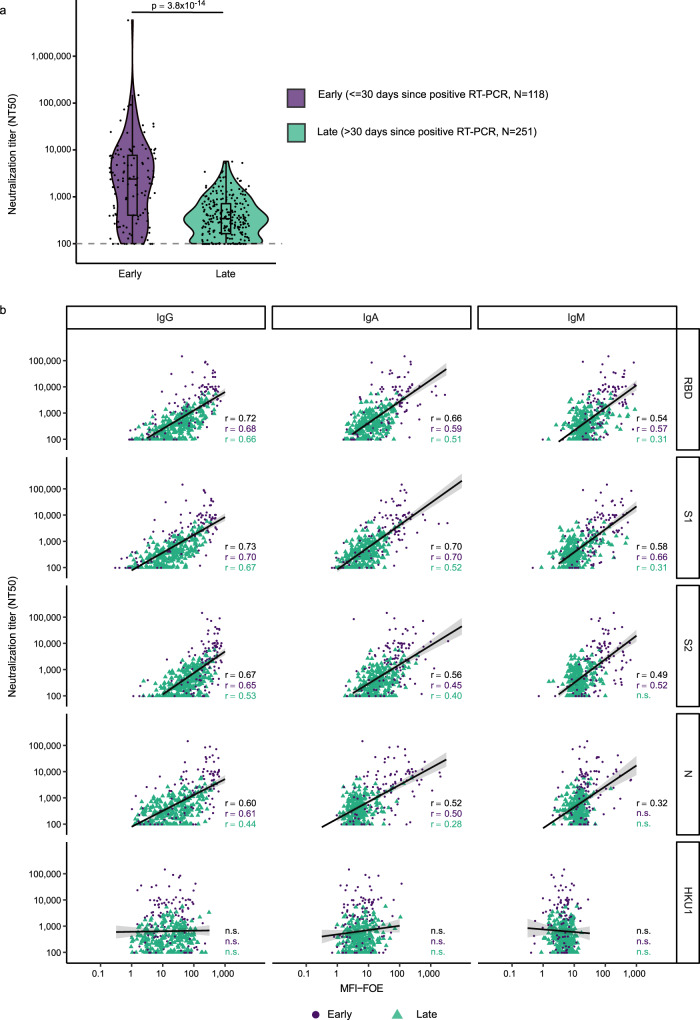
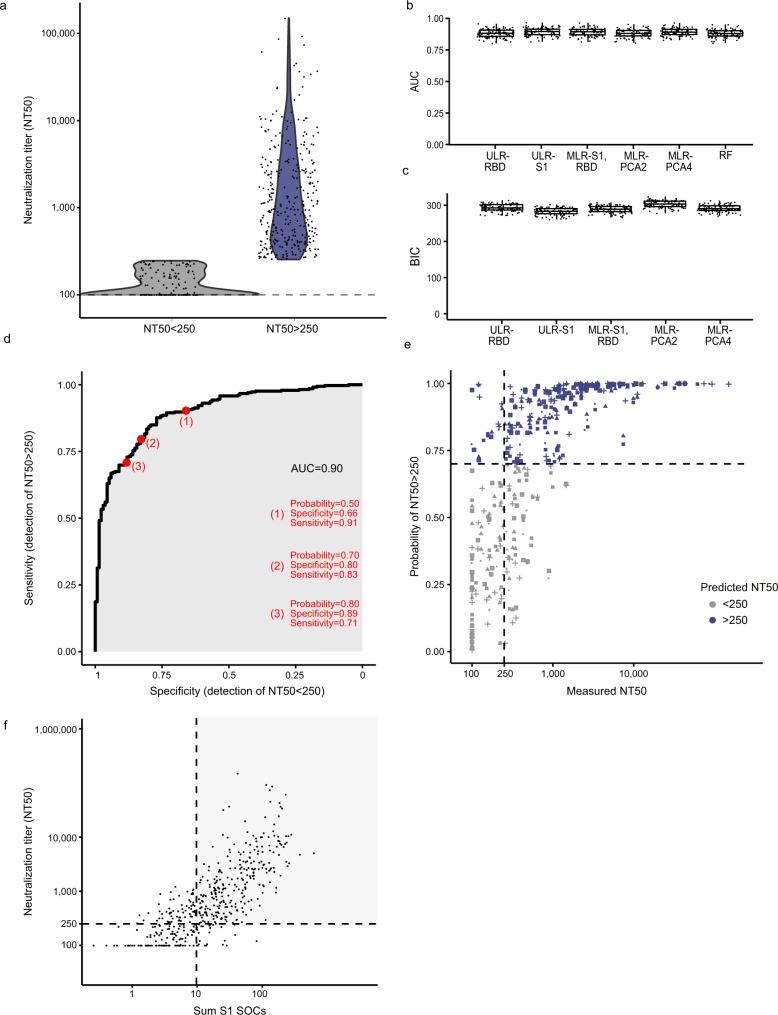
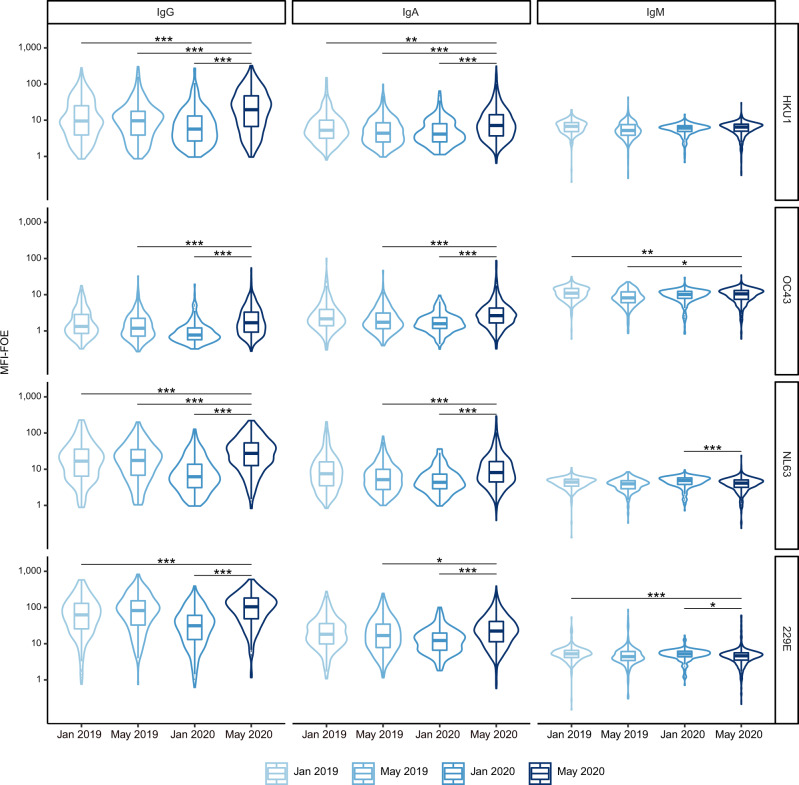
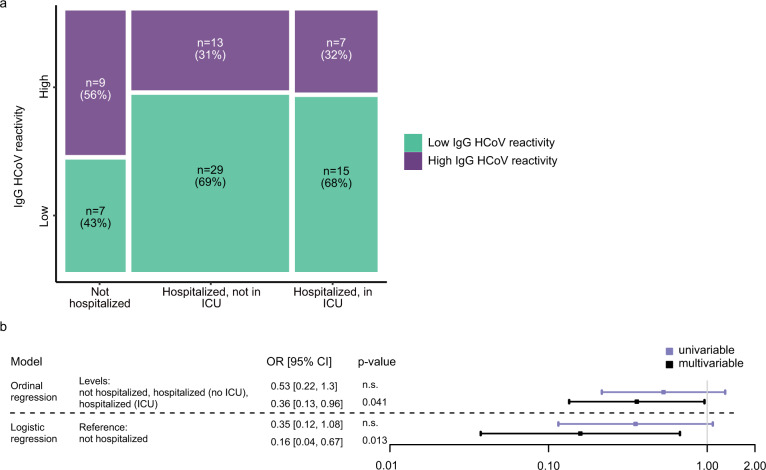
Determination of SARS-CoV-2 antibody responses in the context of pre-existing immunity to circulating human coronavirus (HCoV) is critical for understanding protective immunity. Here we perform a multifactorial analysis of SARS-CoV-2 and HCoV antibody responses in pre-pandemic (N = 825) and SARS-CoV-2-infected donors (N = 389) using a custom-designed multiplex ABCORA assay. ABCORA seroprofiling, when combined with computational modeling, enables accurate definition of SARS-CoV-2 seroconversion and prediction of neutralization activity, and reveals intriguing interrelations with HCoV immunity. Specifically, higher HCoV antibody levels in SARS-CoV-2-negative donors suggest that pre-existing HCoV immunity may provide protection against SARS-CoV-2 acquisition. In those infected, higher HCoV activity is associated with elevated SARS-CoV-2 responses, indicating cross-stimulation. Most importantly, HCoV immunity may impact disease severity, as patients with high HCoV reactivity are less likely to require hospitalization. Collectively, our results suggest that HCoV immunity may promote rapid development of SARS-CoV-2-specific immunity, thereby underscoring the importance of exploring cross-protective responses for comprehensive coronavirus prevention.


Conflict of interest statement

The authors declare no competing interests.

Figures

Fig. 1
Fig. 1. Seroprofiling SARS-CoV-2 responses.
a Assessment of the multiplex SARS-CoV-2 ABCORA 2.0 on the indicated training (N = 823) and validation (N = 635) cohorts (Supplementary Table 3). Depicted are MFI signals normalized to empty bead controls (MFI-FOE). Gray boxes indicate values above the individually set MFI-FOE cut-offs for SARS-CoV-2 specific responses for each antigen (see Supplementary Table 4). Boxplots represent the following: median with the middle line, upper and lower quartiles with the box limits, 1.5x interquartile ranges with the whiskers. b Heatmap representing the measured MFI-FOE values and the outcomes predicted with ABCORA 2.0–2.3 of training and validation cohort measurements shown in (a). Negative, Positive, and Positive, partial refer to ranking according to ABCORA 2.0 as specified in Supplementary Table 5. c Sensitivity and specificity of ABCORA 2 assay versions based on the combined training and validation cohort data depicted in (a). Proportion of false negative samples (sensitivity; green) and proportion of false positive samples (specificity; blue) are represented by the reduction from 100% (outer circle) per segment. d Assessment of ABCORA 2.0 with the National Institute for Biological Standards and Control (NIBSC) Anti SARS-CoV-2 Verification Panel (20/B770) comprising SARS-CoV-2 positive (red) and negative (blue) panel serum samples. Gray boxes indicate values above the ABCORA 2.0 MFI-FOE cut-offs for SARS-CoV-2 specific responses for individual antigen-Ig combinations. Boxplots represent the following: median with the middle line, upper and lower quartiles with the box limits, 1.5x interquartile ranges with the whiskers.
Fig. 2
Fig. 2. Quantification of SARS-CoV-2 specific antibody responses.
ac Distribution of (a) 50% effective concentrations (EC50; expressed as reciprocal plasma dilution) and (b) area under the curve values (AUC; expressed as MFI) of titrated plasma from SARS-CoV-2 positive adults (N = 72) measured with ABCORA 2.0. c Titrated SARS-CoV-2 RBD and S1 responses were quantified using the RBD specific monoclonal antibody CR3022 (produced as IgG, IgA and IgM; expressed as ng/ml) as external standard. See Supplementary Fig. 7 for additional quantification with the WHO International Standard Anti-SARS-CoV-2 Immunoglobulin. d Spearman correlation matrix assessing agreement between ABCORA 2.0 based quantification readouts (EC50, AUC, RBD Ab standardized), the basic MFI-FOE measured at 1/100 plasma dilution (log), indicated summed logMFI-FOE values (1/100 dilution), and Roche Elecsys Anti-SARS-CoV-2 (S) assay results (U/ml). Nonsignificant correlations are left blank. Levels of significance are assessed by a two-sided test on the asymptotic t approximation of Spearman’s rank correlation, and corrected by the Bonferroni method for multiple testing (p < 0.05/780). Color shading denotes correlation coefficient.
Fig. 3
Fig. 3. Association of binding and neutralization activity in early and late infection.
a 50% Neutralization titers (NT50) titers against Wuhan-Hu-1 pseudotype in patients with known positive SARS-CoV-2 RT-PCR date (N = 369). Patients were stratified according to time since first diagnosis to investigate early (less than 30 days post RT-PCR, lavender) and late (more than 30 days post RT-PCR, turquoise) neutralization responses. Difference between these two groups was assessed with a linear mixed model with time since RT-PCR (binary variable early/late) as fixed effect and individual as random effect and using Satterthwaite approximation for a two-sided t-test on the parameter associated with time since RT-PCR. Boxplots represent the following: median with the middle line, upper and lower quartiles with the box limits, 1.5x interquartile ranges with the whiskers. b Linear regression analysis to define association between neutralization (reciprocal NT50) and antibody binding (MFI-FOE). Black lines indicate linear regression predictions and gray shaded areas correspond to the 95% confidence intervals. Results depict early (lavender), late (turquoise) and full cohort (black). n.s. denotes nonsignificant results. Levels of significance are assessed by a two-sided test on the asymptotic t approximation of Spearman’s rank correlation, and corrected by the Bonferroni method for multiple testing (p < 0.05/1200, see Supplementary Figs. 8b and 9).
Fig. 4
Fig. 4. Predicting neutralization capacity as a function of binding activity.
a SARS-CoV-2 positive donors (N = 467) were stratified into high neutralizers (NT50 > 250, N = 332; blue) and no/low neutralizers (NT50 < 250, N = 135; gray), based on their neutralization activity against Wuhan-Hu-1. b, c Comparison of the prediction ability of six different classification models using 100 cross-validation sets (divided as 80% for training and 20% for validation). b Comparison of models by area under the curve (AUC). Each dot corresponds to one cross-validation set. c Bayesian information criterion (BIC) of the five models based on logistic regression. The different models are: Univariable logistic regressions (ULR). ULR-RBD: mean of MFI-FOE RBD. ULR-S1: mean of MFI-FOE S1. Multivariable logistic regression (MLR). MLR-S1, RBD: mean of S1 reactivity and mean of RBD reactivity. MLR-PCA2 and MLR-PCA4: MLR of 2 and 4 first axis of PCA analysis, respectively. PCA was based on all 12 SARS-CoV-2 antibody reactivities measured by ABCORA 2.0. Random forest (RF) including all antibody reactivities measured by ABCORA 2.0. Boxplots represent the following: median with the middle line, upper and lower quartiles with the box limits, 1.5x interquartile ranges with the whiskers and outliers with points. d ULR-S1 estimated ROC curve based on full data set (N = 467). e Measured NT50 value versus probability of NT50 > 250 as predicted by ULR-S1 in five randomly chosen validation sets (each symbol corresponds to a validation set). Purple colored symbols indicate a higher than 0.70 probability of the respective sample to be neutralizing at NT50 > 250 and are therefore denoted as high neutralizers. Gray indicates samples with predicted neutralization NT50 < 250, therefore classified as no/low neutralizers. f Neutralization prediction based on a modified ULR-S1 model utilizing the diagnostic readout SOC instead of MFI-FOE values as input. Measured NT50 value versus sum of S1 SOC values (IgG, IgA, IgM) are depicted. Dashed lines correspond to a NT50 = 250 horizontally and the sum S1 SOCs = 9.7 vertically. The sum S1 SOCs = 9.7 corresponds to the thresholds depicted for ULR-S1 in (d, e). The gray shaded area corresponds to true positives (individuals with NT50 > 250 predicted as high neutralizers).
Fig. 5
Fig. 5. Monitoring temporal evolution of antibody responses.
a ABCORA 2.3 definition of seropositivity in donors with positive RT-PCR confirmed SARS-CoV-2 infection and known RT-PCR date (N = 369). Seropositivity rating in relation to plasma sampling time point post diagnosis is depicted. Gray shaded area highlights the first seven days since positive RT-PCR detection. b Power law model, with time since RT-PCR as fixed effect and individual as random effect, estimating the decay of antibody binding activity based on ABCORA 2.0 measurements at 1–4 longitudinal time points in 120 individuals totaling in 251 measurements. Purple lines correspond to the models estimation and purple shaded areas to the 95% confidence intervals. Antibody half-lives (t1/2 in days) from significant models are depicted. Significance was assessed using Satterthwaite approximation for a two-sided t-test on the slope parameters. c Power law model, with time since RT-PCR as fixed effect and individual as random effect, estimating the decay of neutralizing capacity on 251 measurements from 120 individuals. Only individuals with NT50 > 100 at their first measurement were used to estimate the half-life. The purple line corresponds to the model estimation and the purple shaded area to the 95% confidence intervals. Significance was assessed using Satterthwaite approximation for a two-sided t-test on the slope parameters.
Fig. 6
Fig. 6. Seasonal and annual fluctuation in HCoV reactivity.
Reactivity to human coronaviruses (HCoV-NL63, HCoV-229E, HCoV-HKU1, HCoV-OC43) was compared by ABCORA 5.0. Reactivity in healthy blood donors from 2019 and 2020 was compared. Pre-pandemic samples included: January 2019 (N = 285), May 2019 (N = 288), January 2020 (N = 252). Samples from May 2020 (N = 672) were collected during the pandemic in Switzerland. Only samples without SARS-CoV-2 specific reactivity as defined by ABCORA were included (N = 653). Stars correspond to levels of significance of two-sided t-tests comparing the indicated groups. Levels of significance are corrected by the Bonferroni method for multiple testing and indicated as follows: *p < 0.05/36, **p < 0.01/36, ***p < 0.001/36. Boxplots represent the following: median with the middle line, upper and lower quartiles with the box limits, 1.5x interquartile ranges with the whiskers and outliers with points.
Fig. 7
Fig. 7. Effects of pre-existing HCoV immunity during SARS-CoV-2 acquisition.
a Time-matched comparison of ABCORA 5.0 reactivity for SARS-CoV-2 and HCoVs in healthy and SARS-CoV-2 infected individuals. Healthy donors were sampled in May 2020 (N = 653; blue). Plasma from SARS-CoV-2 infected individuals were collected between April–June 2020 (N = 65; red). See Supplementary Fig. 14 for analysis on the full SARS-CoV-2 positive cohort (N = 389). Gray boxes indicate values above the individual MFI-FOE cut-offs for SARS-CoV-2 specific responses for each antigen. Stars correspond to levels of significance of two-sided t-tests comparing negative versus positive patients. Levels of significance are corrected by the Bonferroni method for multiple testing and indicated as follows: *p < 0.05/12, **p < 0.01/12, ***p < 0.001/12 (IgG HKU1: p = 0.66, IgG OC43: p = 0.45, IgG NL63: p = 3.3 × 10−04, IgG 229E: p = 1.6 × 10−05, IgA HKU1: p = 1.8 × 10−03, IgA OC43: p = 1.3 × 10−05, IgA NL63: p = 1.4 × 10−07, IgA 229E: p = 3.0 × 10−05, IgM HKU1: p = 3.3 × 10−08, IgM OC43: p = 4.3 × 10−03, IgM NL63: p = 1.1 × 10−07, IgM 229E: p = 2.7 × 10−02). Boxplots represent the following: median with the middle line, upper and lower quartiles with the box limits, 1.5x interquartile ranges with the whiskers and outliers with points. b Linear regression models showing the association between SARS-CoV-2 and HCoV signals in 204 SARS-CoV-2 positive patients with known dates of first positive RT-PCR detection. Influences within the same antibody class are investigated. The models were adjusted on age (spline with 3 degrees of freedom), gender, time since positive RT-PCR (spline with 3 degrees of freedom) and level of HCoV reactivity. Samples are defined to harbor high HCoV reactivity if they show ABCORA 5.0 HCoV logMFI-FOE values higher than the corresponding median in at least 3 HCoV measurements (HKU1, OC43, NL63 or 229E). Curves correspond to the models estimation and shaded areas to the 95% confidence intervals. p-values were obtained by running a two-sided Student t-test on the parameter associated to HCoV reactivity in the linear regression. c Linear regression model showing the association between SARS-CoV-2 IgG and HCoV IgA signals. Curves correspond to the models estimation and shaded areas to the 95% confidence intervals. p-values were obtained by running a two-sided Student t-test on the parameter associated to HCoV reactivity in the linear regression. d Linear regression model showing the association between SARS-CoV-2 IgG and HCoV IgM signals. Curves correspond to the models estimation and shaded areas to the 95% confidence intervals. p-values were obtained by running a two-sided Student t-test on the parameter associated to HCoV reactivity in the linear regression.
Fig. 8
Fig. 8. Impact of HCoV immunity on COVID-19 severity.
a Association of hospitalization status (not hospitalized (N = 16); hospitalized not in ICU (N = 42); hospitalized in ICU (N = 22)) and high or low IgG HCoV reactivity. Rectangle sizes correspond to the proportion of included patients. b Influence of HCoV reactivity (low/high) on the hospitalization status in a subset of N = 80 patients, as estimated with odds ratios, in an ordinal regression (with levels = not hospitalized (N = 16); hospitalized not in ICU (N = 42); hospitalized in ICU (N = 22)) and a logistic regression (reference = not hospitalized (N = 16); versus all hospitalized (N = 64)). Data is presented as parameter estimation and its 95% confidence interval. Level of significance of the parameter is obtained with a two-sided t-test (p-value is displayed if <0.05, otherwise indicated as n.s.).

References

    1. Rydyznski Moderbacher C, et al. Antigen-specific adaptive immunity to SARS-CoV-2 in acute COVID-19 and associations with age and disease severity. Cell. 2020;183:996–1012 e1019. doi: 10.1016/j.cell.2020.09.038. - DOI - PMC - PubMed
    1. Wheatley AK, et al. Evolution of immune responses to SARS-CoV-2 in mild-moderate COVID-19. Nat. Commun. 2021;12:1162. doi: 10.1038/s41467-021-21444-5. - DOI - PMC - PubMed
    1. Wang, Z. et al. Enhanced SARS-CoV-2 neutralization by dimeric IgA. Sci. Transl. Med., 10.1126/scitranslmed.abf1555 (2021). - PMC - PubMed
    1. Robbiani DF, et al. Convergent antibody responses to SARS-CoV-2 in convalescent individuals. Nature. 2020;584:437–442. doi: 10.1038/s41586-020-2456-9. - DOI - PMC - PubMed
    1. Gaebler, C. et al. Evolution of antibody immunity to SARS-CoV-2. Nature, 10.1038/s41586-021-03207-w (2021). - PMC - PubMed

Publication types

MeSH terms