. 2022 Apr;40(4):555-565.
doi: 10.1038/s41587-021-01094-0. Epub 2021 Nov 18.

Whole-cell segmentation of tissue images with human-level performance using large-scale data annotation and deep learning

Affiliations

Whole-cell segmentation of tissue images with human-level performance using large-scale data annotation and deep learning

Noah F Greenwald et al. Nat Biotechnol. 2022 Apr.

Abstract

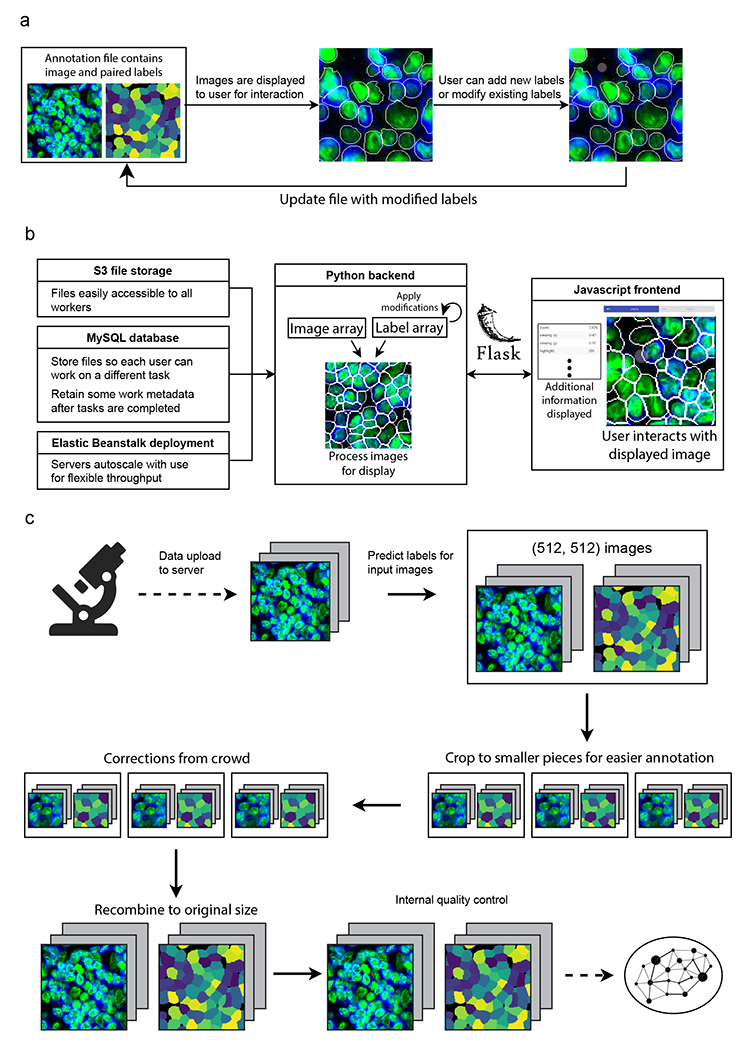
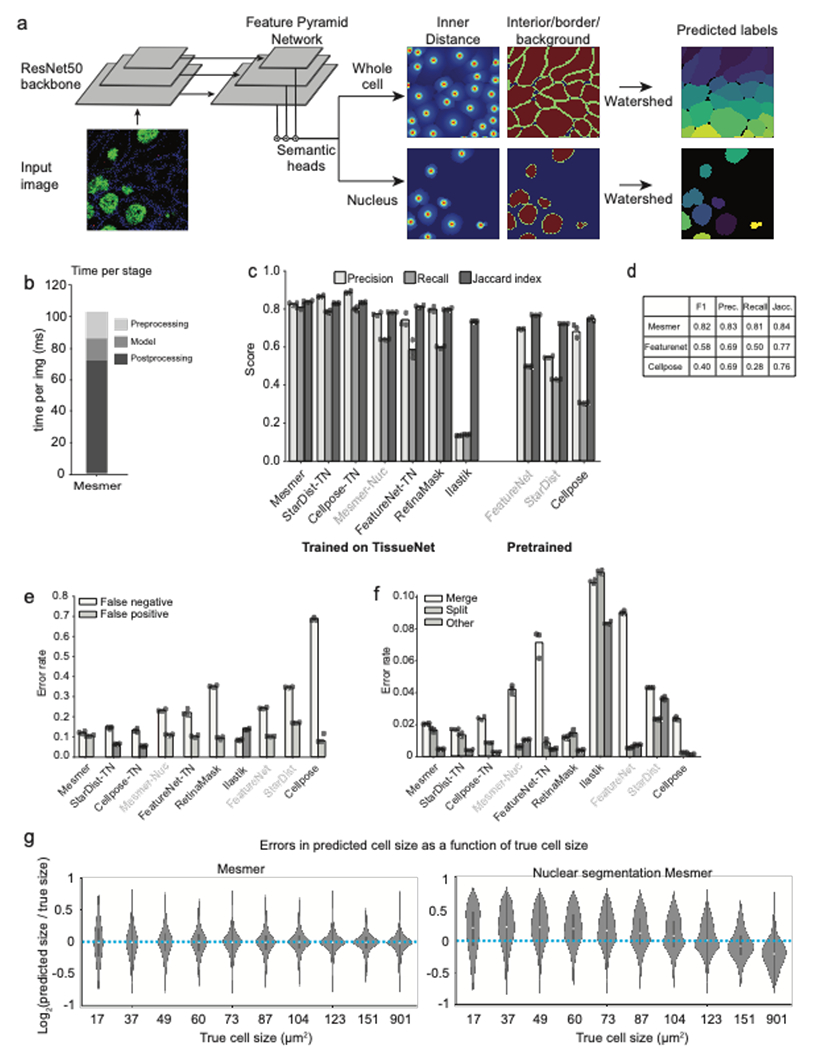
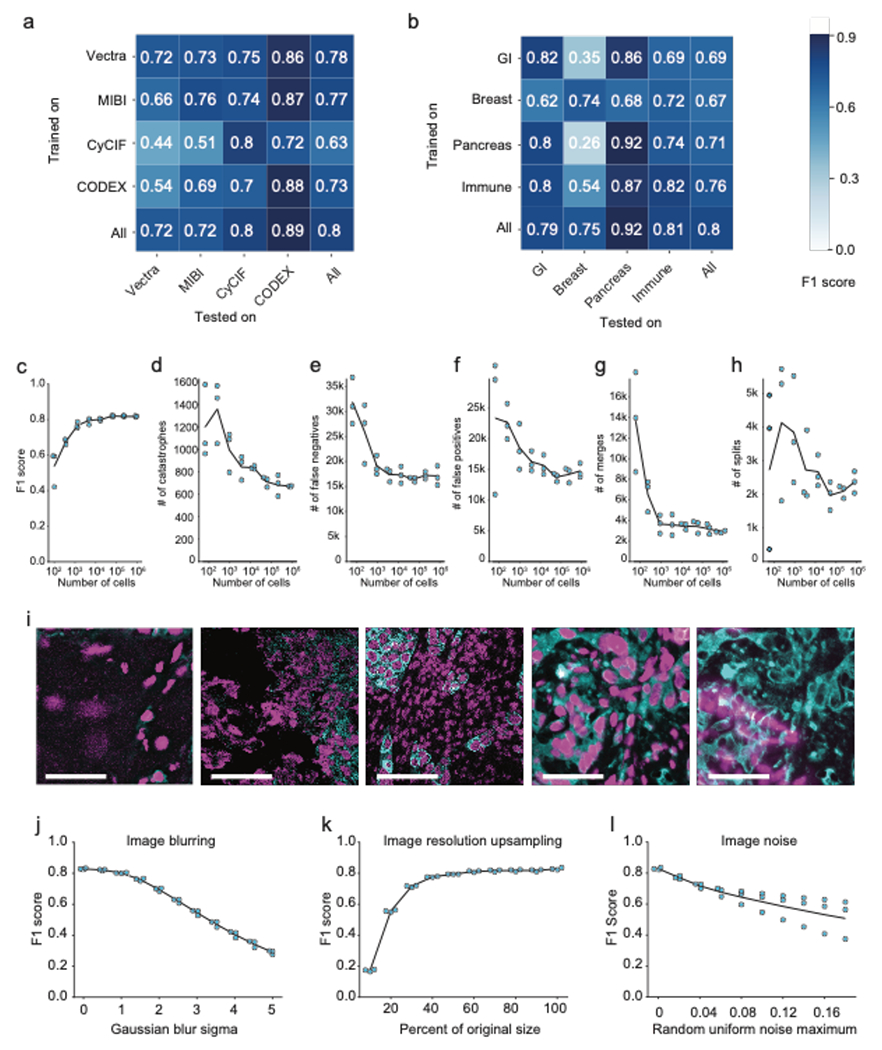
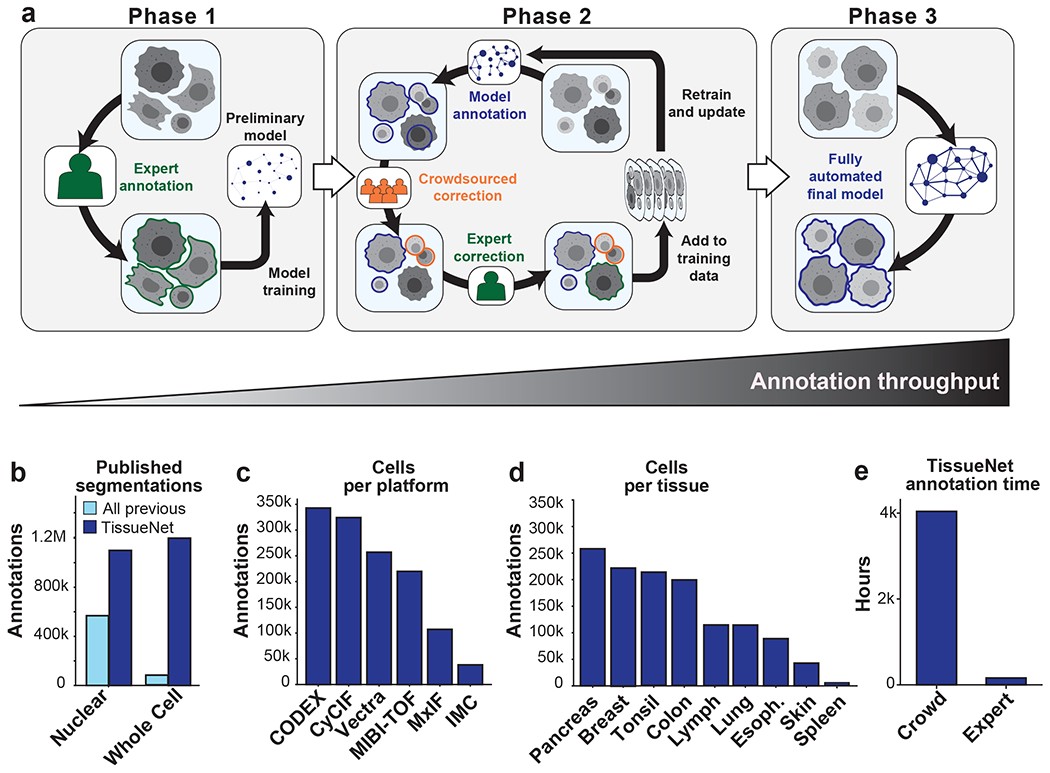
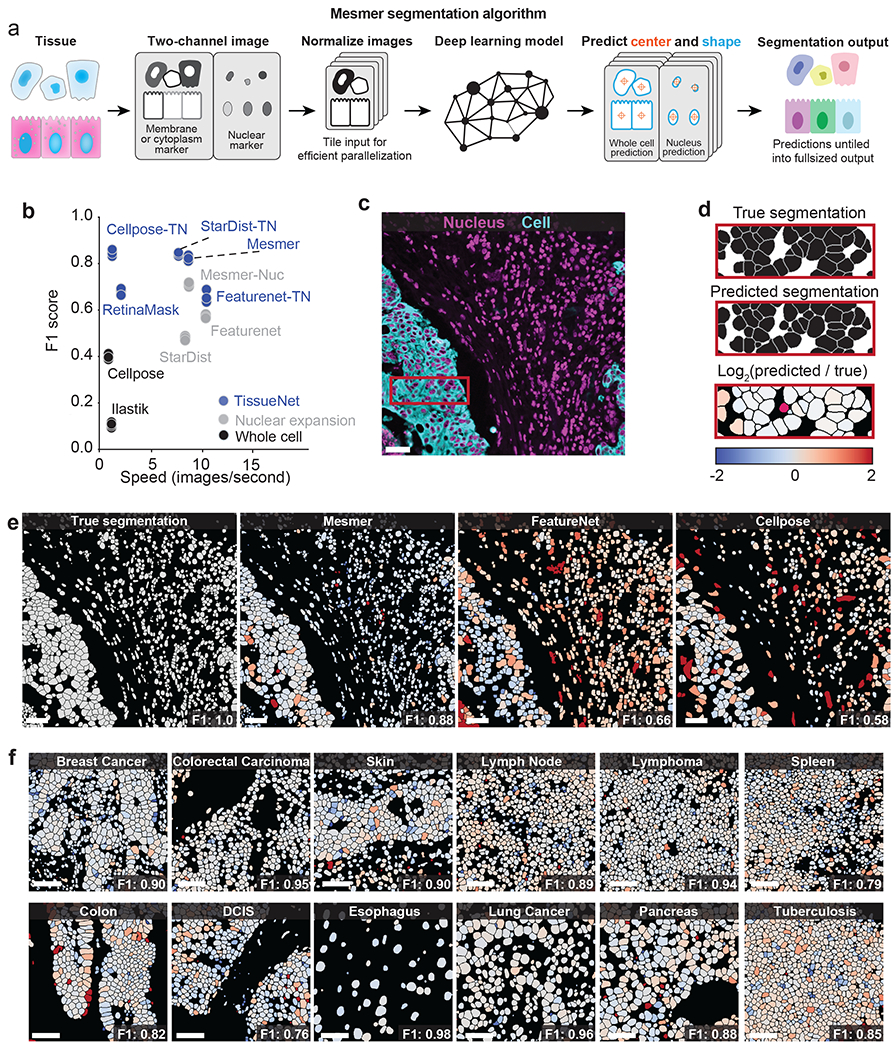
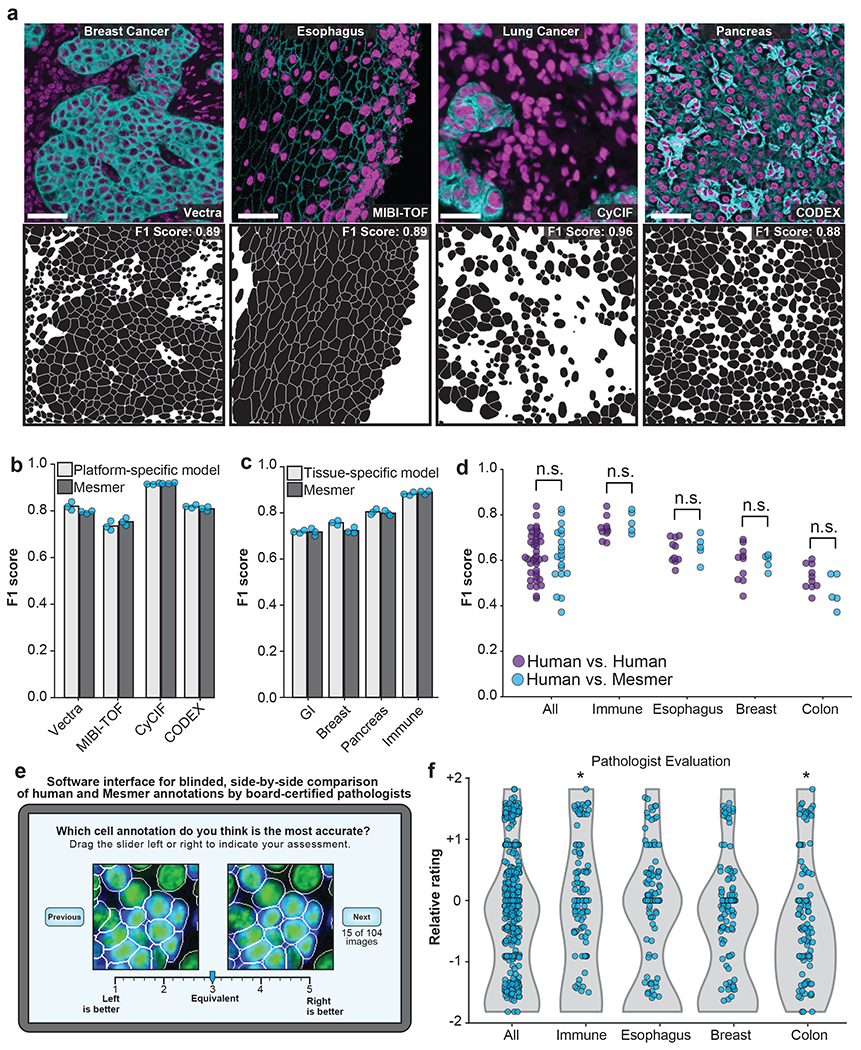
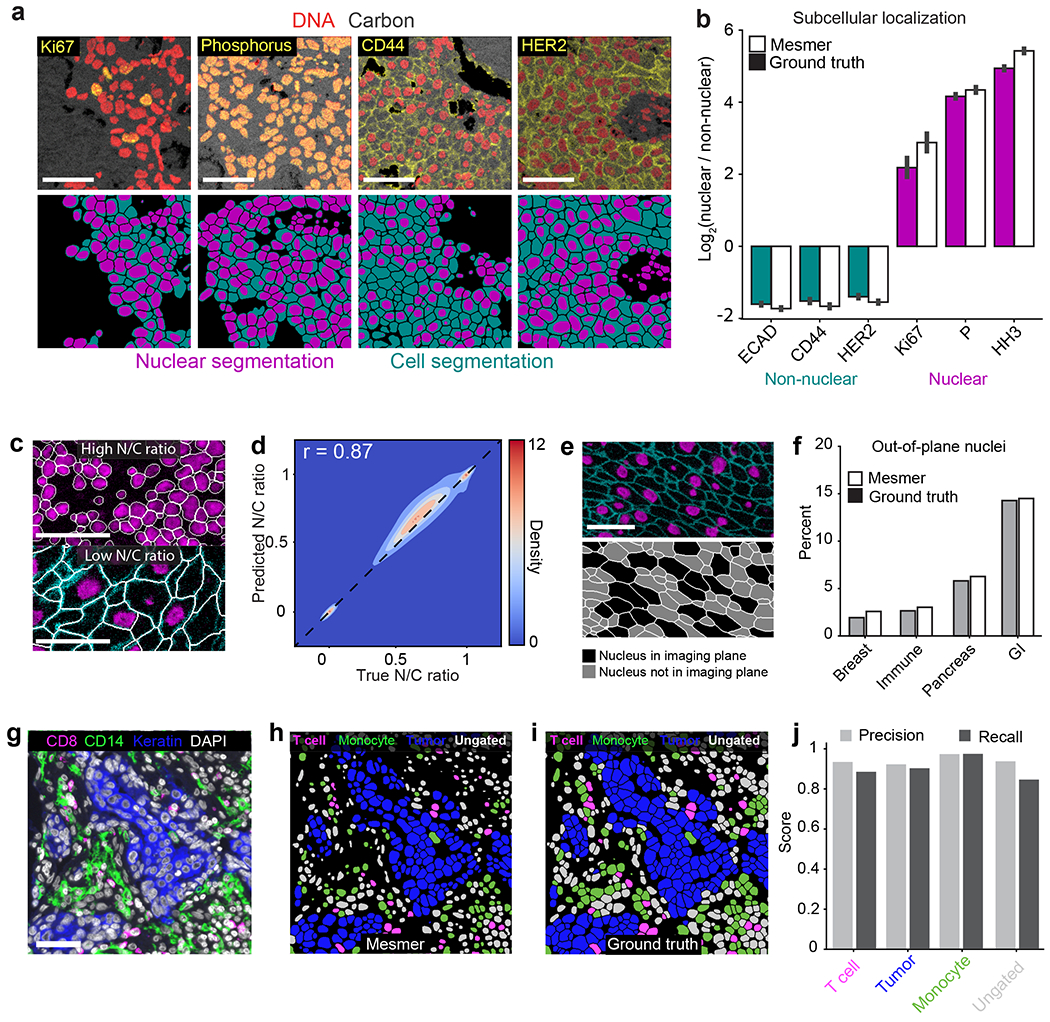
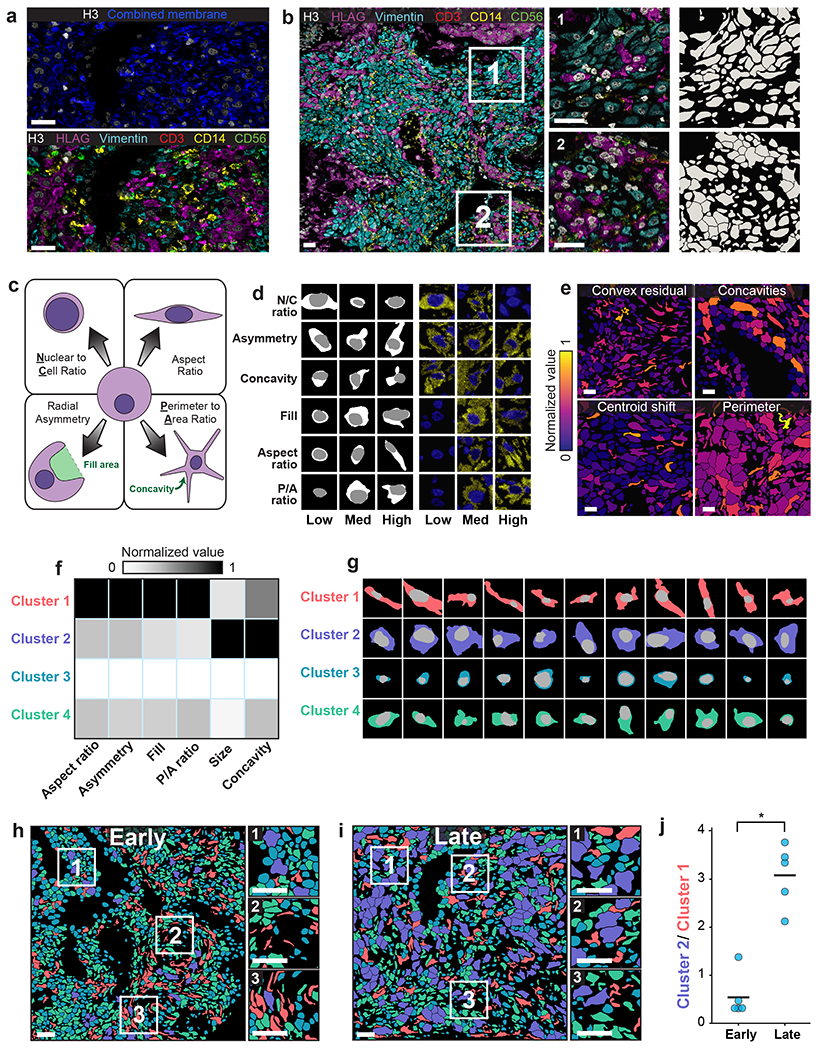
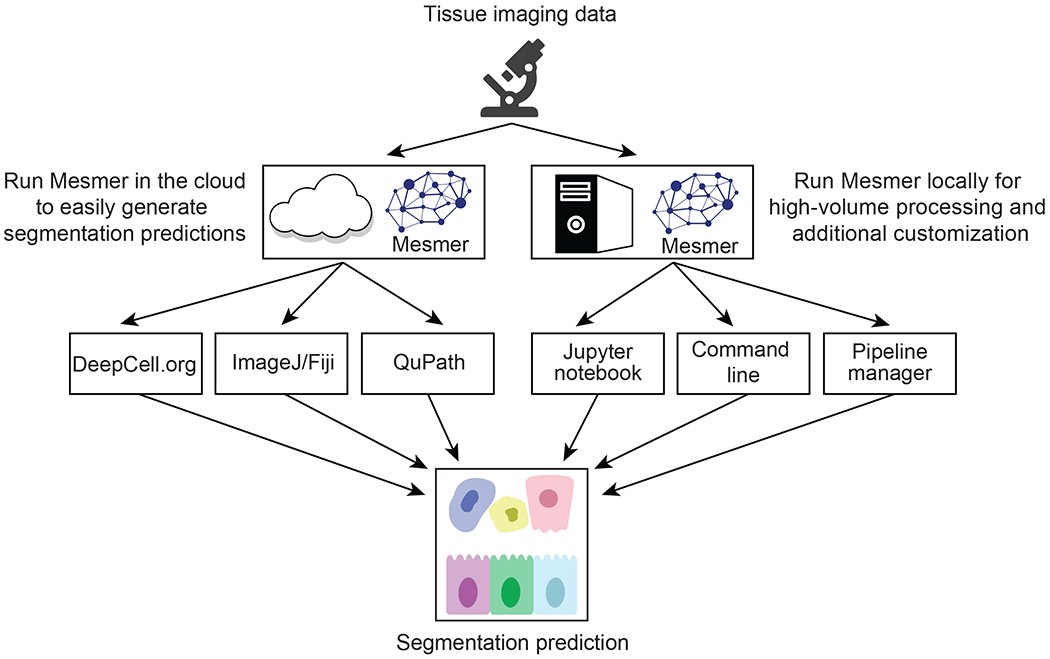
A principal challenge in the analysis of tissue imaging data is cell segmentation-the task of identifying the precise boundary of every cell in an image. To address this problem we constructed TissueNet, a dataset for training segmentation models that contains more than 1 million manually labeled cells, an order of magnitude more than all previously published segmentation training datasets. We used TissueNet to train Mesmer, a deep-learning-enabled segmentation algorithm. We demonstrated that Mesmer is more accurate than previous methods, generalizes to the full diversity of tissue types and imaging platforms in TissueNet, and achieves human-level performance. Mesmer enabled the automated extraction of key cellular features, such as subcellular localization of protein signal, which was challenging with previous approaches. We then adapted Mesmer to harness cell lineage information in highly multiplexed datasets and used this enhanced version to quantify cell morphology changes during human gestation. All code, data and models are released as a community resource.


Conflict of interest statement

Competing interests

M.A. is an inventor on patent US20150287578A1. M.A. is a board member and shareholder in IonPath Inc. T.R. has previously consulted for IonPath Inc. D.V.V and E.M. have filed a provisional patent for this work. The remaining authors declare no competing interests.

Figures

Extended Data Figure 1.
a, How multichannel images are represented and edited in DeepCell Label. b, Scalable backend for DeepCell Label that dynamically adjusts required resources based on usage, allowing concurrent annotators to work in parallel. c, Human-in-the-loop workflow diagram. Images are uploaded to the server, run through Mesmer to make predictions, and cropped to facilitate error correction. These crops are sent to the crowd to be corrected, stitched back together, run through quality control to ensure accuracy, and used to train an updated model.
Extended Data Figure 2.
a, PanopticNet architecture. Images are fed into a ResNet50 backbone coupled to a feature pyramid network. Two semantic heads produce pixel-level predictions. The first head predicts whether each pixel belongs to the interior, border, or background of a cell, while the second head predicts the center of each cell. b, Relative proportion of preprocessing, inference, and post-processing time in PanopticNet architecture. c, Evaluation of precision, recall, and Jaccard index for Mesmer and previously published models (right) and models trained on TissueNet (left). d, Summary of TissueNet accuracy for Mesmer and selected models to facilitate future benchmarking efforts e,f Breakdown of most prevalent error types (e) and less prevalent error types (f) for Mesmer and previously published models illustrates Mesmer’s advantages over previous approaches. g, Comparison of the size distribution of prediction errors for Mesmer (left) with nuclear segmentation followed by expansion (right) shows that Mesmer’s predictions are unbiased.
Extended Data Figure 3.
a, Accuracy of specialist models trained on each platform type (rows) and evaluated on data from other platform types (columns) indicates good agreement within immunofluorescence and mass spectrometry-based methods, but not across distinct methods. b, Accuracy of specialist models trained on each tissue type (rows) and evaluated on data from other tissue types (columns) demonstrates that models trained on only a single tissue type do not generalize as well to other tissue types. c, Quantification of F1 score as a function of the size of the dataset used for training. d-h, Quantification of individual error types as a function of the size of the dataset used for training. i, Representative images where Mesmer accuracy was poor, as determined by the image specific F1 score. j, Impact of image blurring on model accuracy. k, Impact of image downsampling and then upsampling on model accuracy. l, Impact of adding random noise to image on model accuracy. All scale bars are 50 μM.
Extended Data Figure 4.
Proof of principle for using Mesmer’s segmentation predictions to generate 3D segmentations. A z-stack of 3D data is fed to Mesmer, which generates separate 2D predictions for each slice. We computationally link the segmentations predictions from each slice to form 3D objects. This approach can form the basis for human-in-the-loop construction of training data for 3D models.
Figure 1:
Figure 1:. A human-in-the-loop approach enables scalable, pixel-level annotation of large image collections.
a, This approach has three phases. During phase 1, annotations are created from scratch to train a model. During phase 2, new data are fed through a preliminary model to generate predictions. These predictions are used as a starting point for correction by annotators. As more images are corrected, the model improves, which decreases the number of errors, increasing the speed with which new data can be annotated. During phase 3, an accurate model is run without human correction. b, TissueNet has more nuclear and whole-cell annotations than all previously published datasets. c, The number of cell annotations per imaging platform in TissueNet. d, The number of cell annotations per tissue type in TissueNet. e, The number of hours of annotation time required to create TissueNet.
Figure 2:
Figure 2:. Mesmer delivers accurate nuclear and whole-cell segmentation in multiplexed images of tissues.
a, Diagram illustrating the key steps in the Mesmer segmentation pipeline. b, Speed versus accuracy comparison of Mesmer and previously published models, as well as architectures we retrained on TissueNet. Accuracy is measured by the F1 score (Methods) between the predicted segmentations and the ground-truth labels in the test set of TissueNet, where 0 indicates no agreement and 1 indicates perfect agreement. c, Color overlay of representative image of colorectal carcinoma. d, Inset showing the ground truth (top) and predicted (middle) labels from a small region in c, along with a visual representation of segmentation accuracy (bottom). Predicted segmentations for each cell are colored by the log2 of the ratio between the predicted area and ground-truth area. Predicted cells that are too large are red, while predicted cells that are too small are blue. e, Ground-truth segmentation labels for the image in c, along with the predicted labels from Mesmer and previously published models, each colored by the log2 as in d. As seen visually, Mesmer offers substantially better performance than previous methods. f, Mesmer generalizes across tissue types, imaging platforms, and disease states. The F1 score is given for each image. In all panels, scale bars are 50 μm.
Figure 3:
Figure 3:. Mesmer performs whole-cell segmentation across tissue types and imaging platforms with human-level accuracy.
a, Sample images, predicted segmentations, and F1 scores for distinct tissues and imaging platforms visually demonstrate that Mesmer delivers accurate cell segmentation for all available imaging platforms. b, Mesmer has accuracy equivalent to specialist models trained only on data from a specific imaging platform (Methods), with all models evaluated on data from the platform used for training. c, Mesmer has accuracy equivalent to specialist models trained only on data from a specific tissue type (Methods), with all models evaluated on data from the tissue type used for training. GI, gastrointestinal. d, F1 scores evaluating the agreement between segmentation predictions for the same set of images. The predictions from five independent expert annotators were compared against each other (human vs. human) or against Mesmer (human vs. Mesmer). No statistically significant differences between these two comparisons were found, demonstrating that Mesmer achieves human-level performance. e, Workflow for pathologists to rate the segmentation accuracy of Mesmer compared with expert human annotators. f, Pathologist scores from the blinded comparison. A positive score indicates a preference for Mesmer while a negative score indicates a preference for human annotations. Pathologists displayed no significant preference for human labels or Mesmer’s outputs overall. When broken down by tissue type, pathologists displayed a slight preference for Mesmer in immune tissue (p=0.02), and a slight preference for humans in colon tissue (p=0.01), again demonstrating that Mesmer has achieved human-level performance. n.s., not significant; *p<0.05, two-sample t-test for d, one-sample t-test for f. All scale bars are 50 μm.
Figure 4:
Figure 4:. Mesmer enables accurate analysis of multiplex imaging data.
a, Color overlays showing staining patterns for nuclear and non-nuclear proteins (top), with associated nuclear and whole-cell segmentation predictions (bottom). b, Quantification of subcellular localization of the proteins in a for predicted and ground-truth segmentations. The agreement between localization for prediction and ground-truth segmentations indicates that Mesmer accurately quantifies protein localization patterns at the single-cell level. n=1069 cells. Data are presented as mean +/− 95% confidence interval. c, Example image of a tissue with a high N/C ratio (top) and a low N/C ratio (bottom). The N/C ratio is one of several metrics used for quantifying cell morphology (Methods). d, A Pearson’s correlation contour plot of the accuracy of N/C ratio predictions across the entire test split of TissueNet demonstrates that Mesmer accurately quantifies cell morphology. e, Representative image of a tissue with many nuclei outside the imaging plane (top), along with corresponding segmentations colored by whether the nucleus is or is not in the imaging plane. f, Quantification of the number of cells with an out-of-plane nucleus in the predicted and ground-truth segmentations. These cells are detected by Mesmer but would be missed by nuclear segmentation-based methods. GI, gastrointestinal. g, Representative image of the expression of multiple informative proteins in a breast cancer sample. h, Predicted segmentation colored by cell lineage. i, Ground-truth segmentation colored by cell lineage. j, Quantification of precision and recall of each cell type in the ground-truth and predicted segmentations demonstrates that Mesmer produces accurate cell-type counts. All scale bars are 50 μm.
Figure 5:
Figure 5:. Lineage-aware segmentation yields morphological profiling of cells in the decidua during human pregnancy.
a, Color overlay showcasing the challenge of distinguishing cells with only a single combined membrane channel (top), paired with a version of the same image containing all six channels used for lineage-aware segmentation (bottom). b, Representative image of the diverse morphology of cell types in the human decidua (left), along with insets (right) with corresponding segmentation predictions. c, Diagram illustrating the morphology metrics that we defined to enable automated extraction of cell-shape parameters (Methods). d, Predicted segmentations (left) placing cells on a spectrum from low to high for each morphology metric, along with the corresponding imaging data for those cells (right). e, Cell segmentations in four representative images colored by morphology metrics demonstrate the accurate quantification of diverse features. f, Heatmap of inputs to k-means clustering used to identify distinct cell populations based on cell morphology. g, Example cells belonging to each cluster illustrate the morphological differences between cells belonging to each cluster. h,i Representative images of maternal decidua in early (h) and late (i) gestation, with segmentations colored by cluster. j, Quantification of the ratio between cluster 2 and cluster 1 cells in early pregnancy versus late pregnancy. Cluster 2 cells become more prominent in the later time point while cluster 1 cells become rarer. p=0.0003, two-sample t-test. All scale bars are 50 μm.
Figure 6:
Figure 6:. Cloud-native and on-premise software facilitates deployment of Mesmer.
A centralized web server, https://deepcell.org, hosts a version of the Mesmer pipeline. Users with moderate amounts of data (<103 1-megapixel images) to process can access this pipeline through a web portal. Alternatively, users can use ImageJ and QuPath plugins that submit data to the https://deepcell.org web server and retrieve the results. We have also created a containerized version of Mesmer that is compatible with existing workflow managers, so that users with larger amounts of data (>103 1-megapixel images) to process can benefit from our work.

References

    1. Giesen C et al. Highly multiplexed imaging of tumor tissues with subcellular resolution by mass cytometry. Nat Methods 11, 417–422 (2014). - PubMed
    1. Keren L et al. MIBI-TOF: A multiplexed imaging platform relates cellular phenotypes and tissue structure. Sci Adv 5, eaax5851 (2019). - PMC - PubMed
    1. Huang W, Hennrick K & Drew S A colorful future of quantitative pathology: validation of Vectra technology using chromogenic multiplexed immunohistochemistry and prostate tissue microarrays. Hum Pathol 44, 29–38 (2013). - PubMed
    1. Lin J-R et al. Highly multiplexed immunofluorescence imaging of human tissues and tumors using t-CyCIF and conventional optical microscopes. Elife 7, e31657 (2018). - PMC - PubMed
    1. Gerdes MJ et al. Highly multiplexed single-cell analysis of formalin-fixed, paraffin-embedded cancer tissue. Proc National Acad Sci 110, 11982–11987 (2013). - PMC - PubMed

Publication types