. 2022 Jan;17(1):86-97.
doi: 10.1038/s41565-021-00997-y. Epub 2021 Nov 18.

Supramolecular arrangement of protein in nanoparticle structures predicts nanoparticle tropism for neutrophils in acute lung inflammation

Affiliations

Supramolecular arrangement of protein in nanoparticle structures predicts nanoparticle tropism for neutrophils in acute lung inflammation

Jacob W Myerson et al. Nat Nanotechnol. 2022 Jan.

Abstract

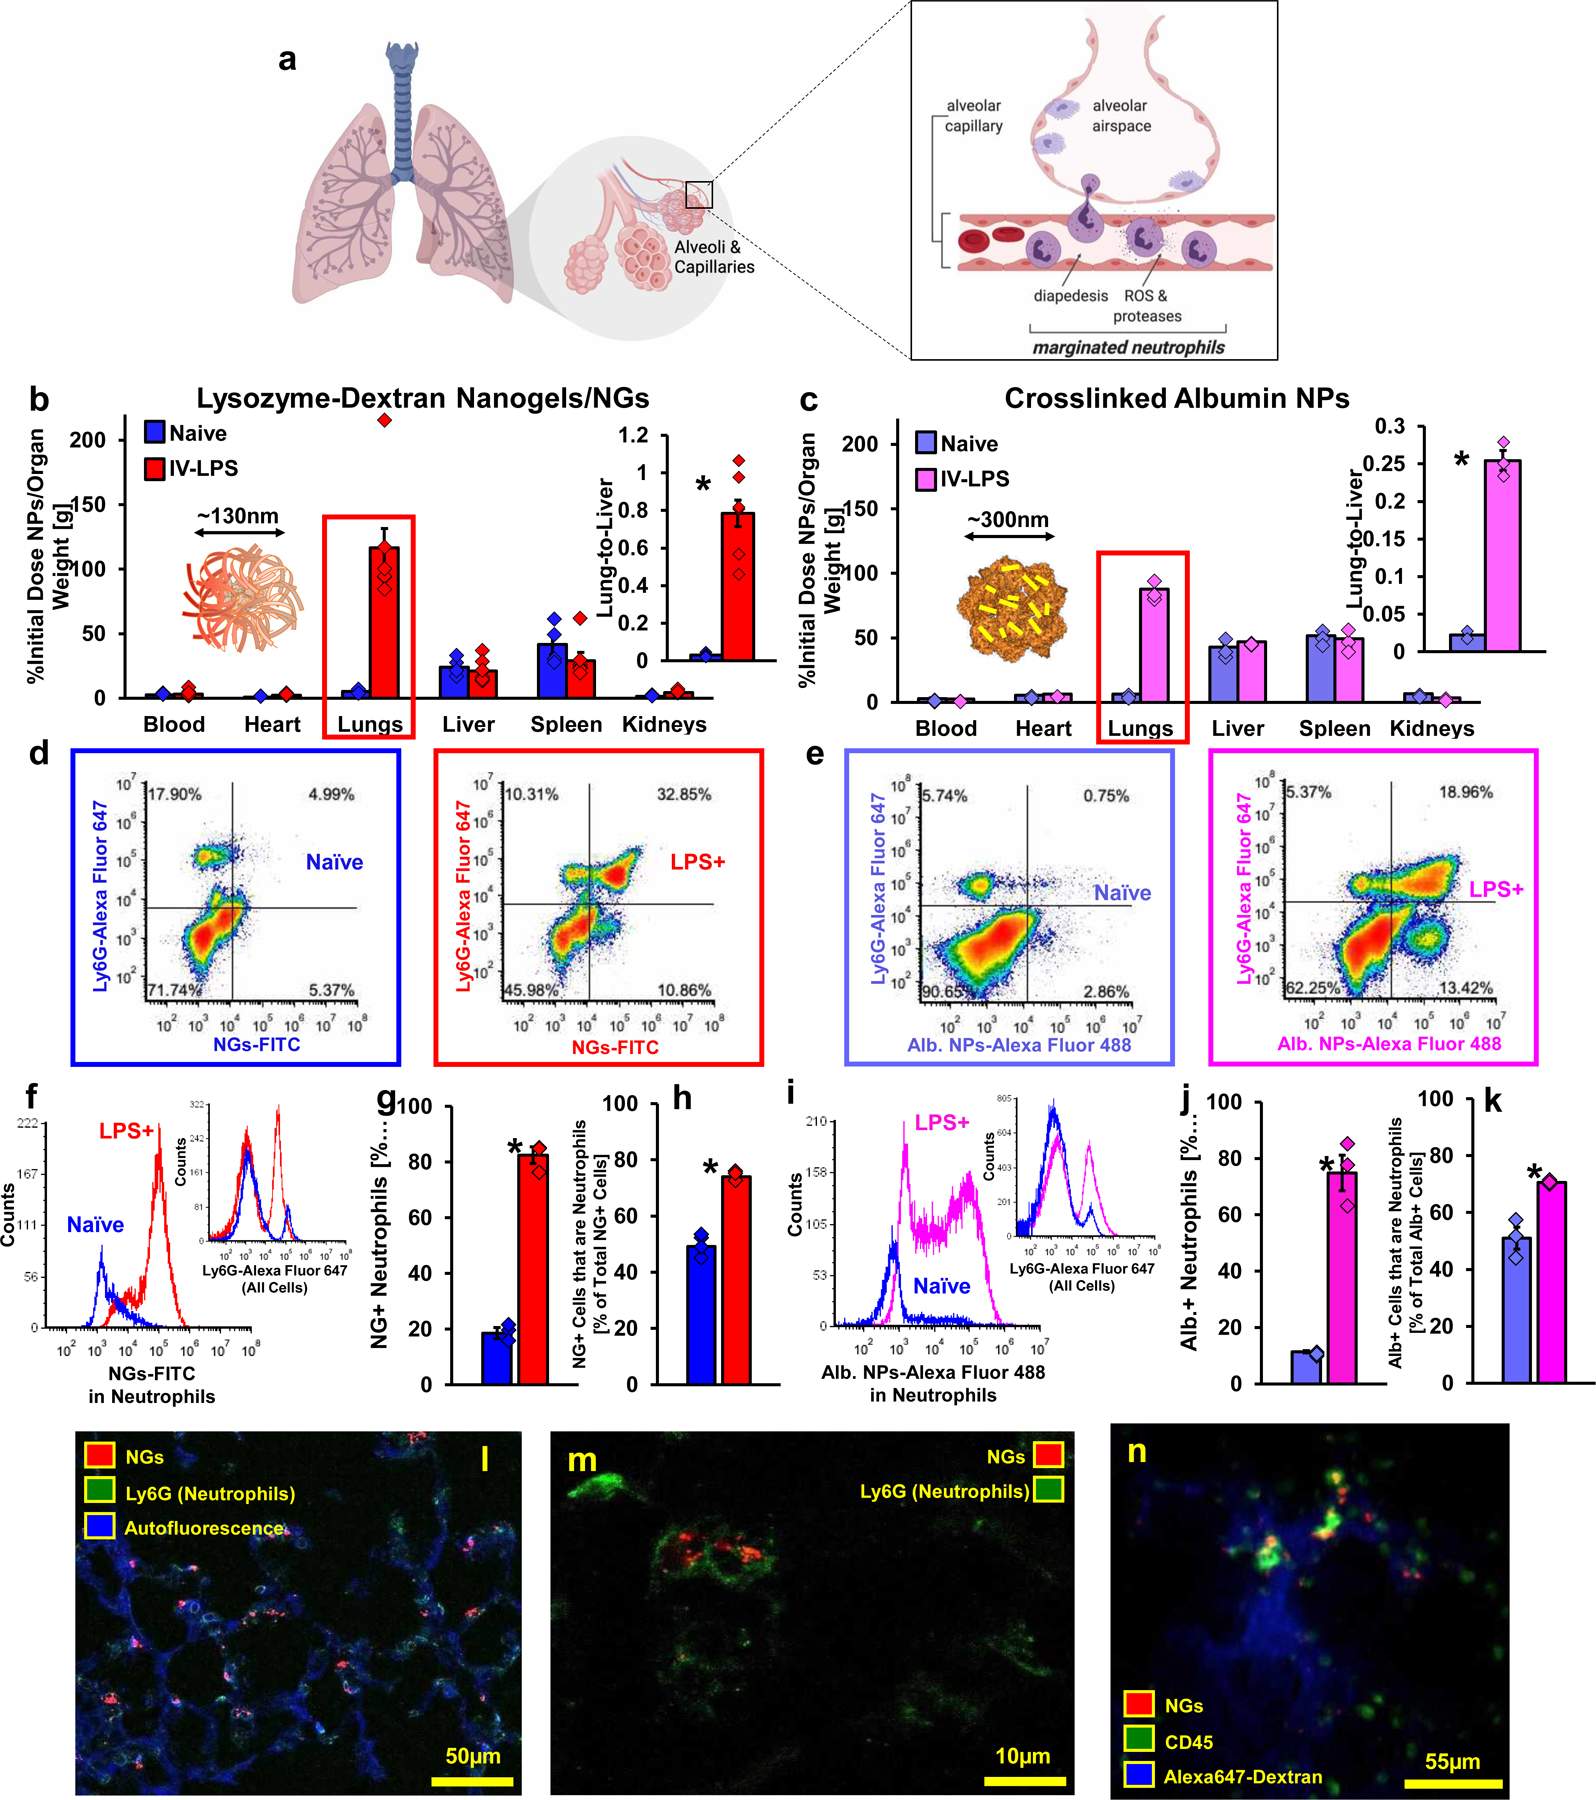
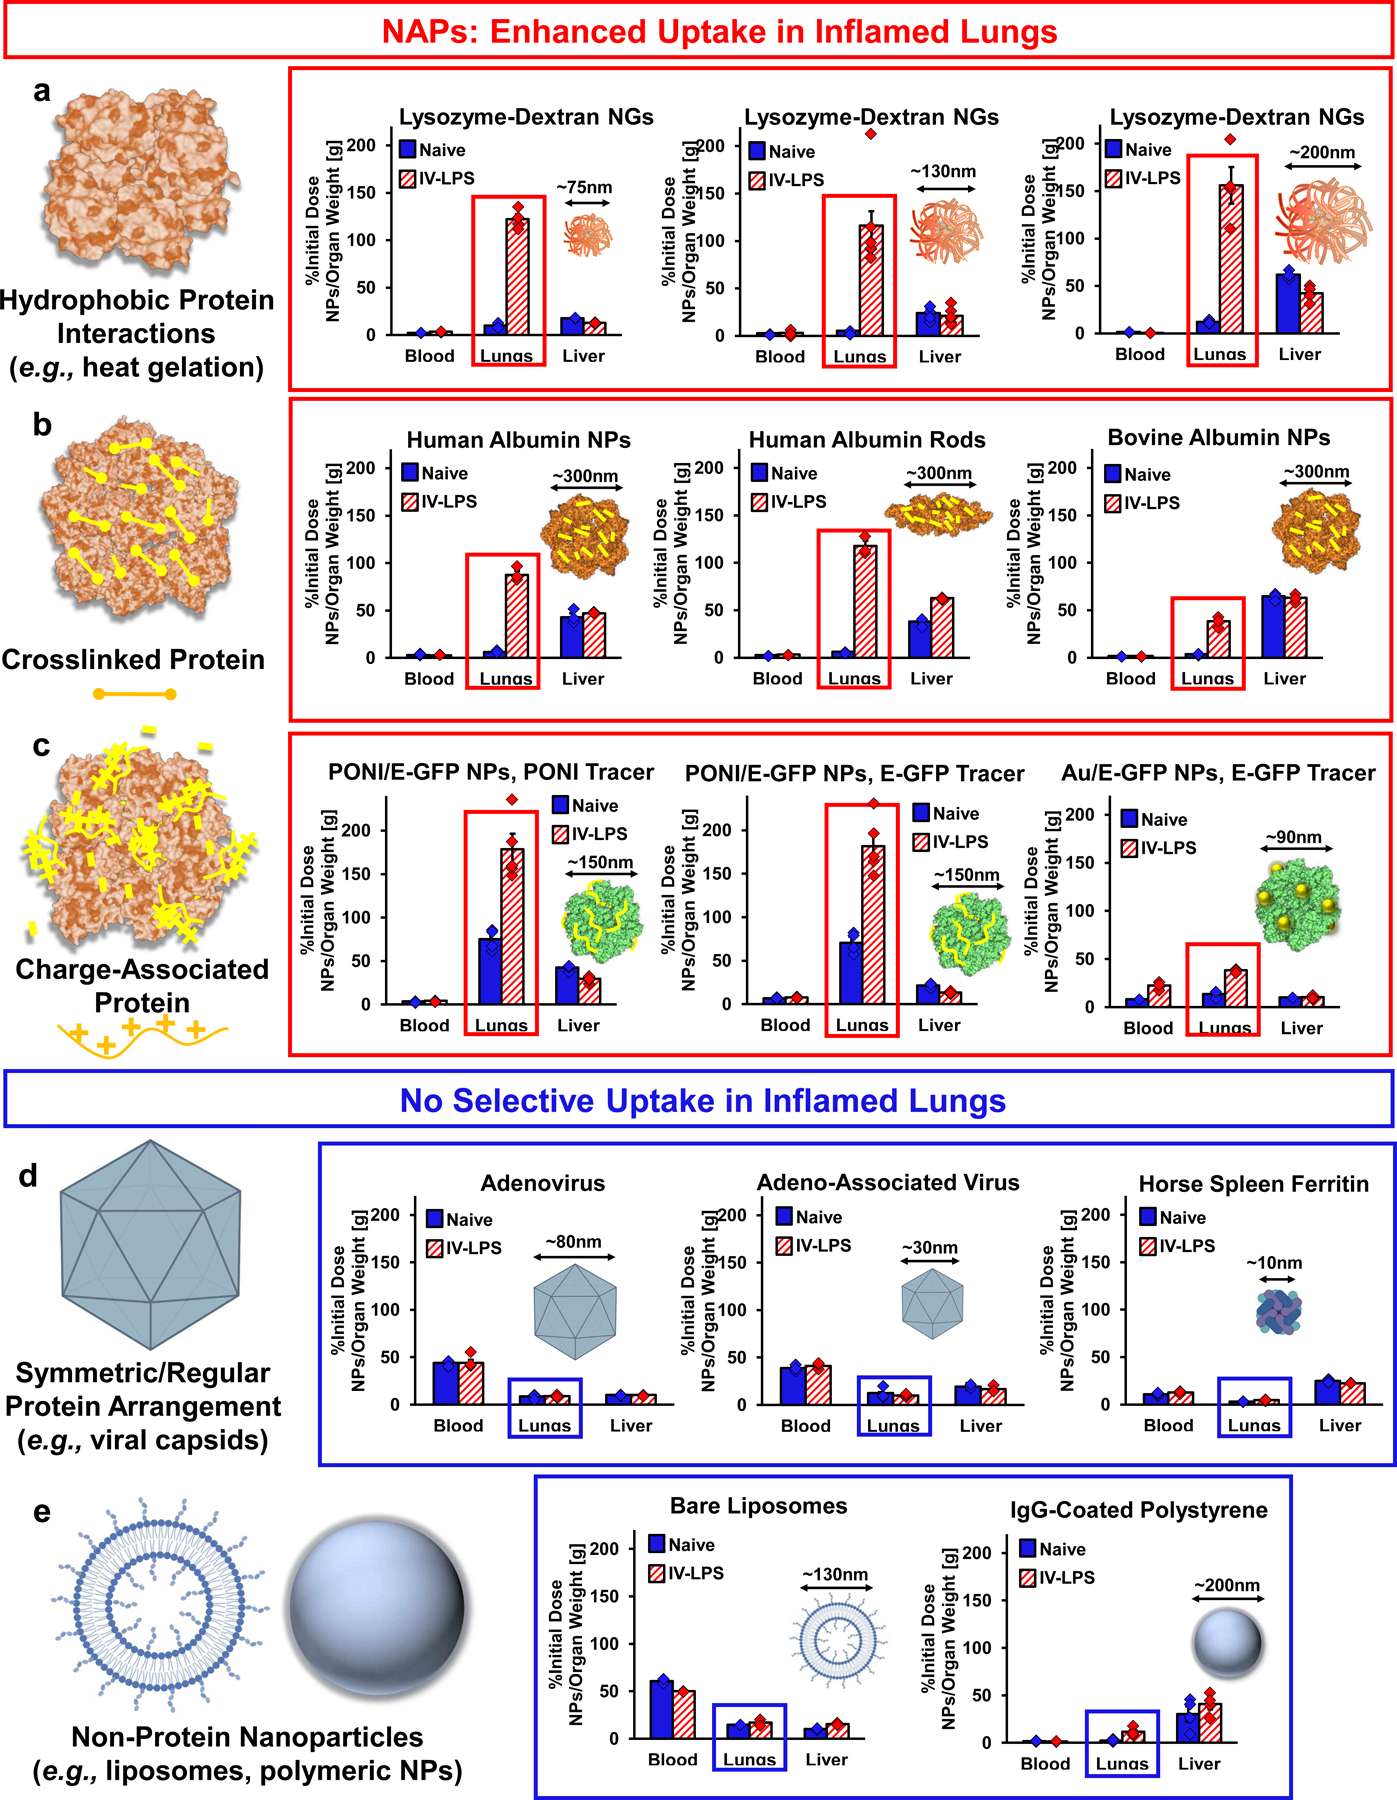
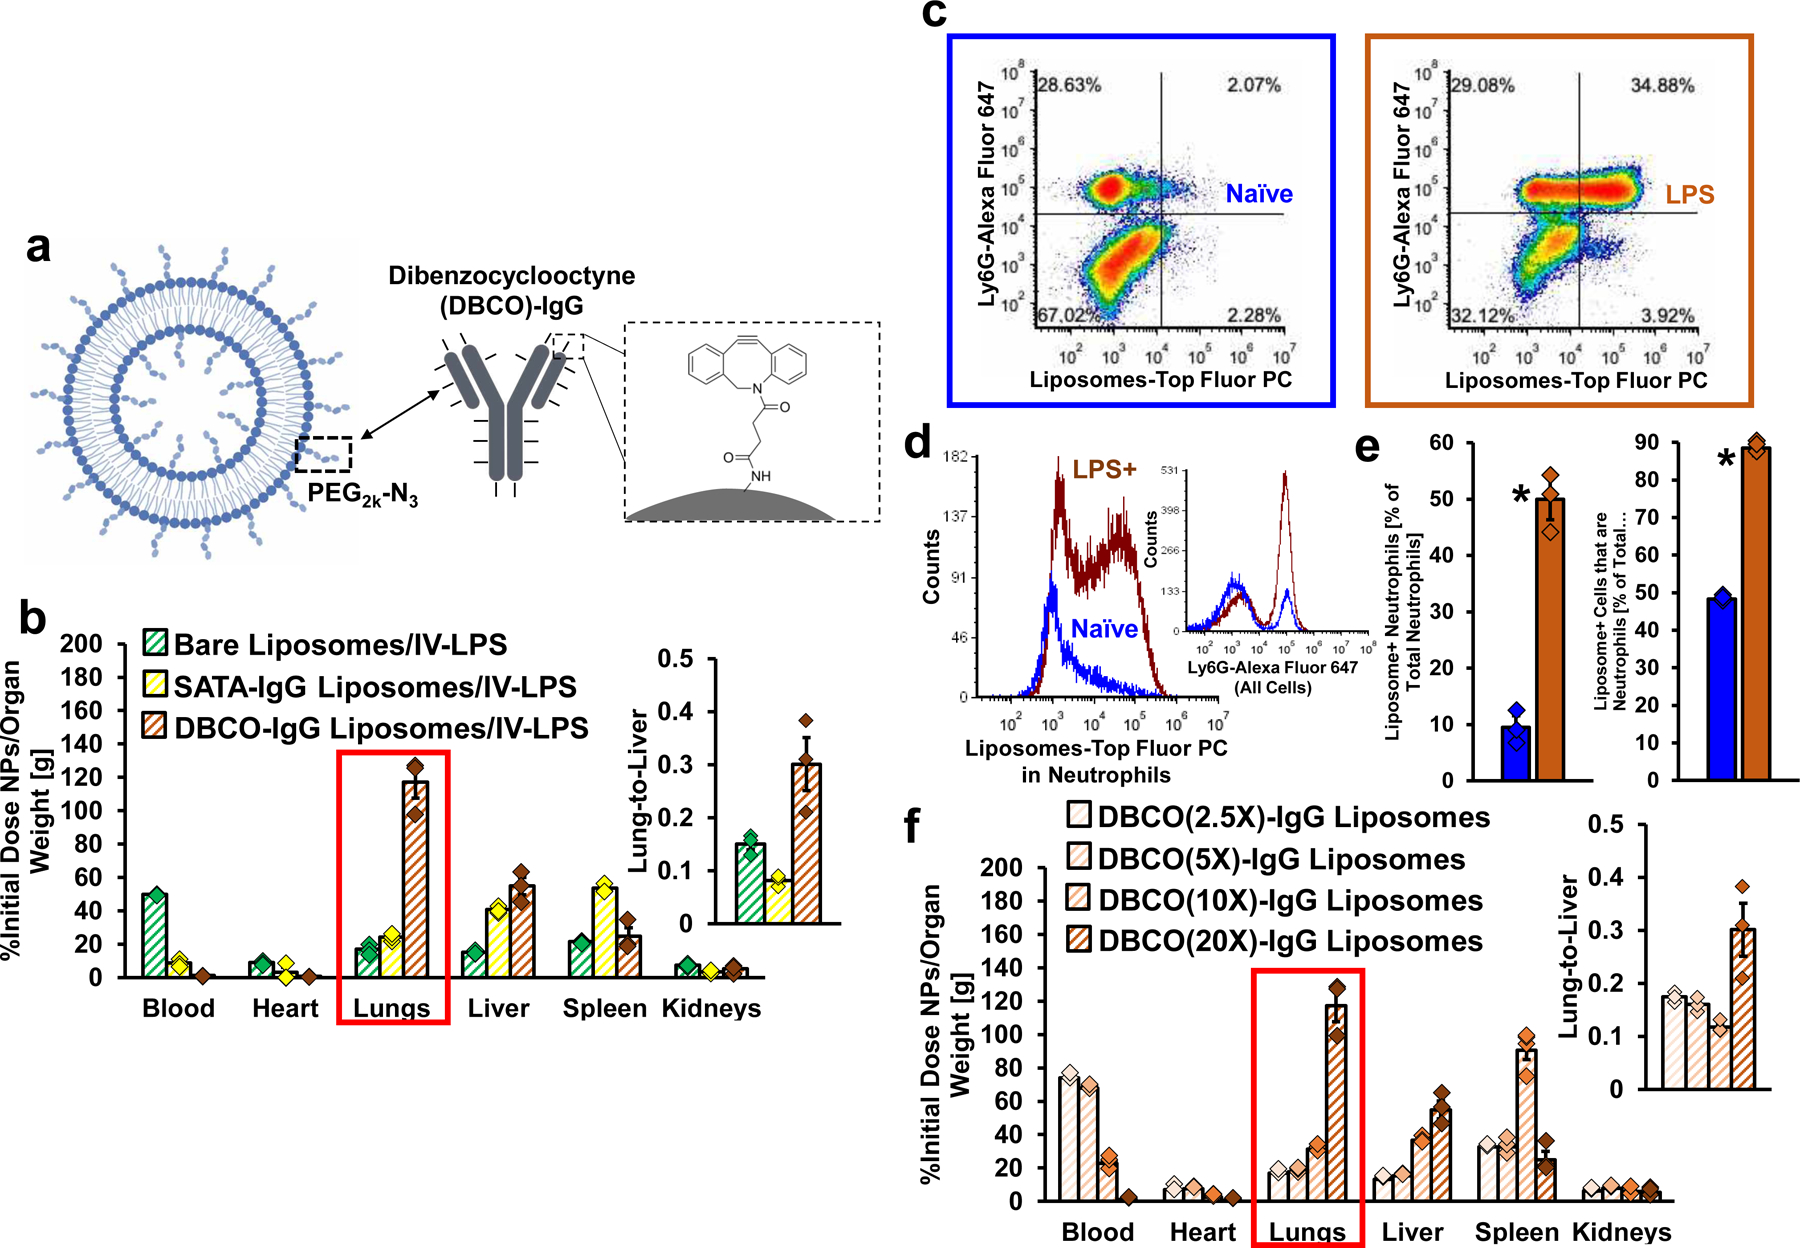
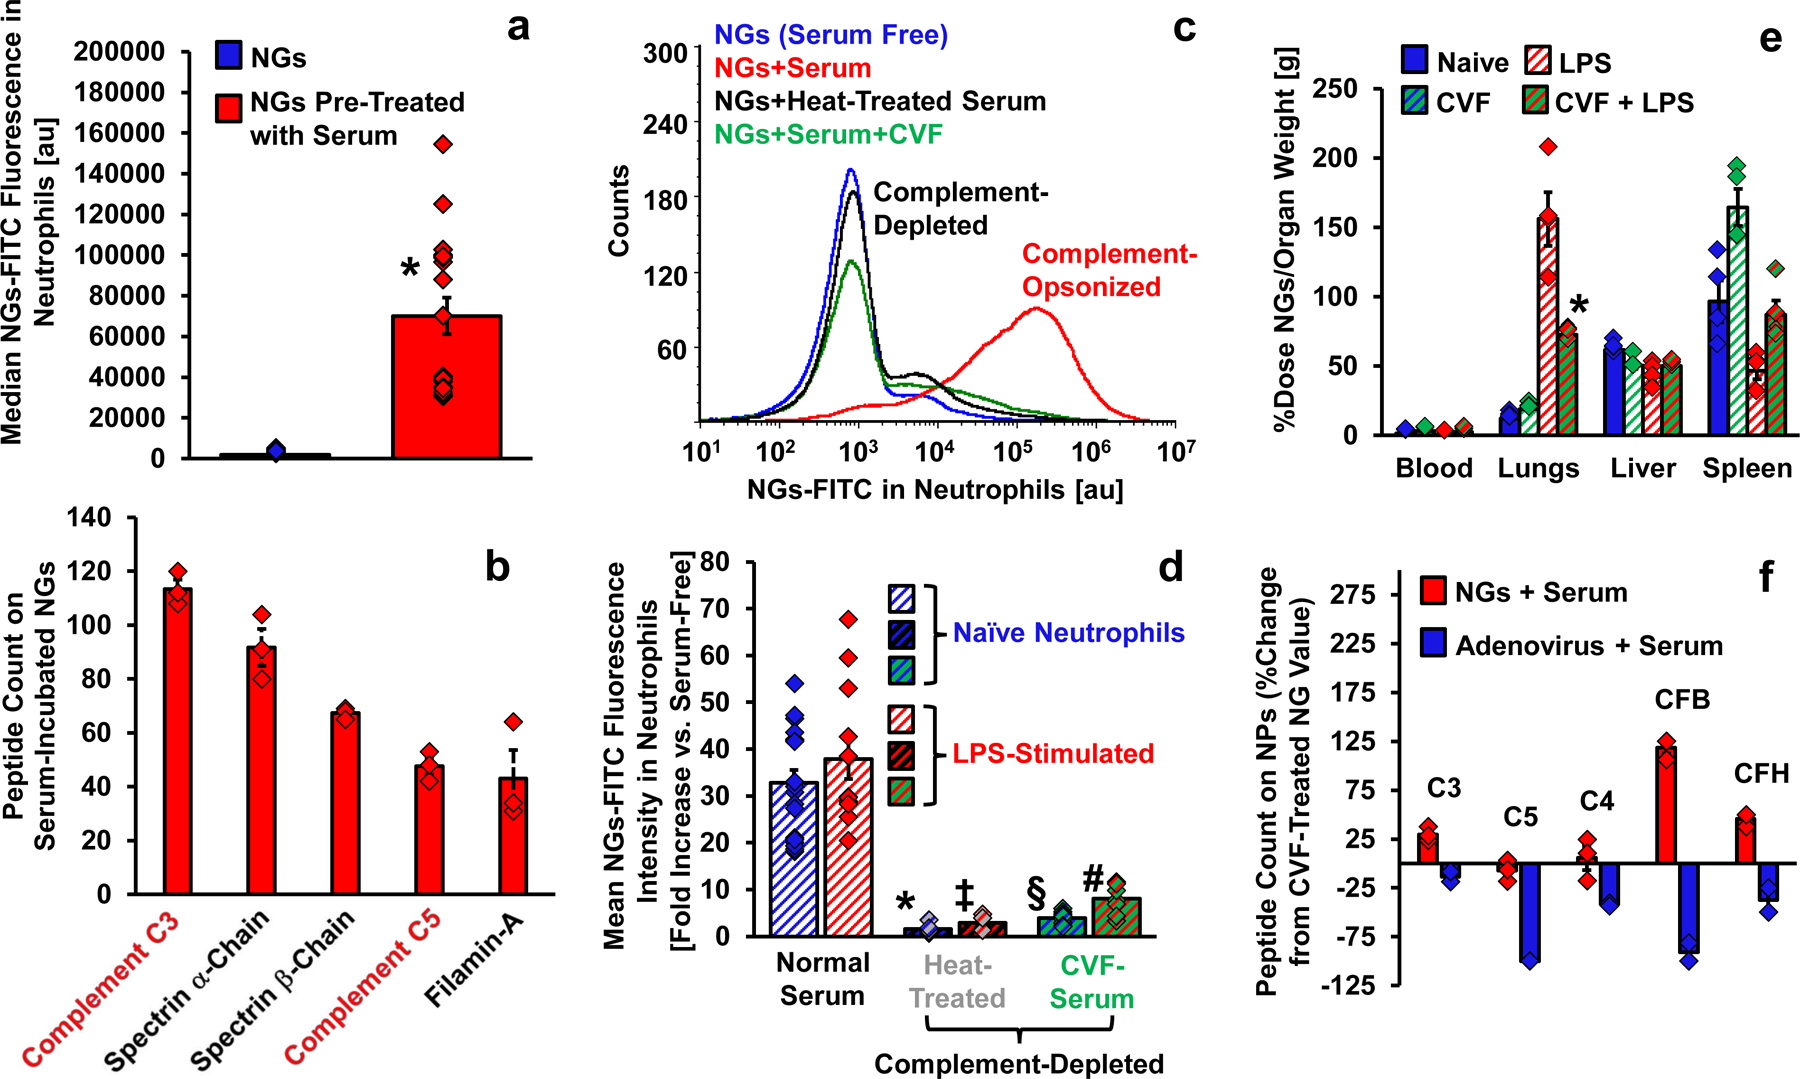
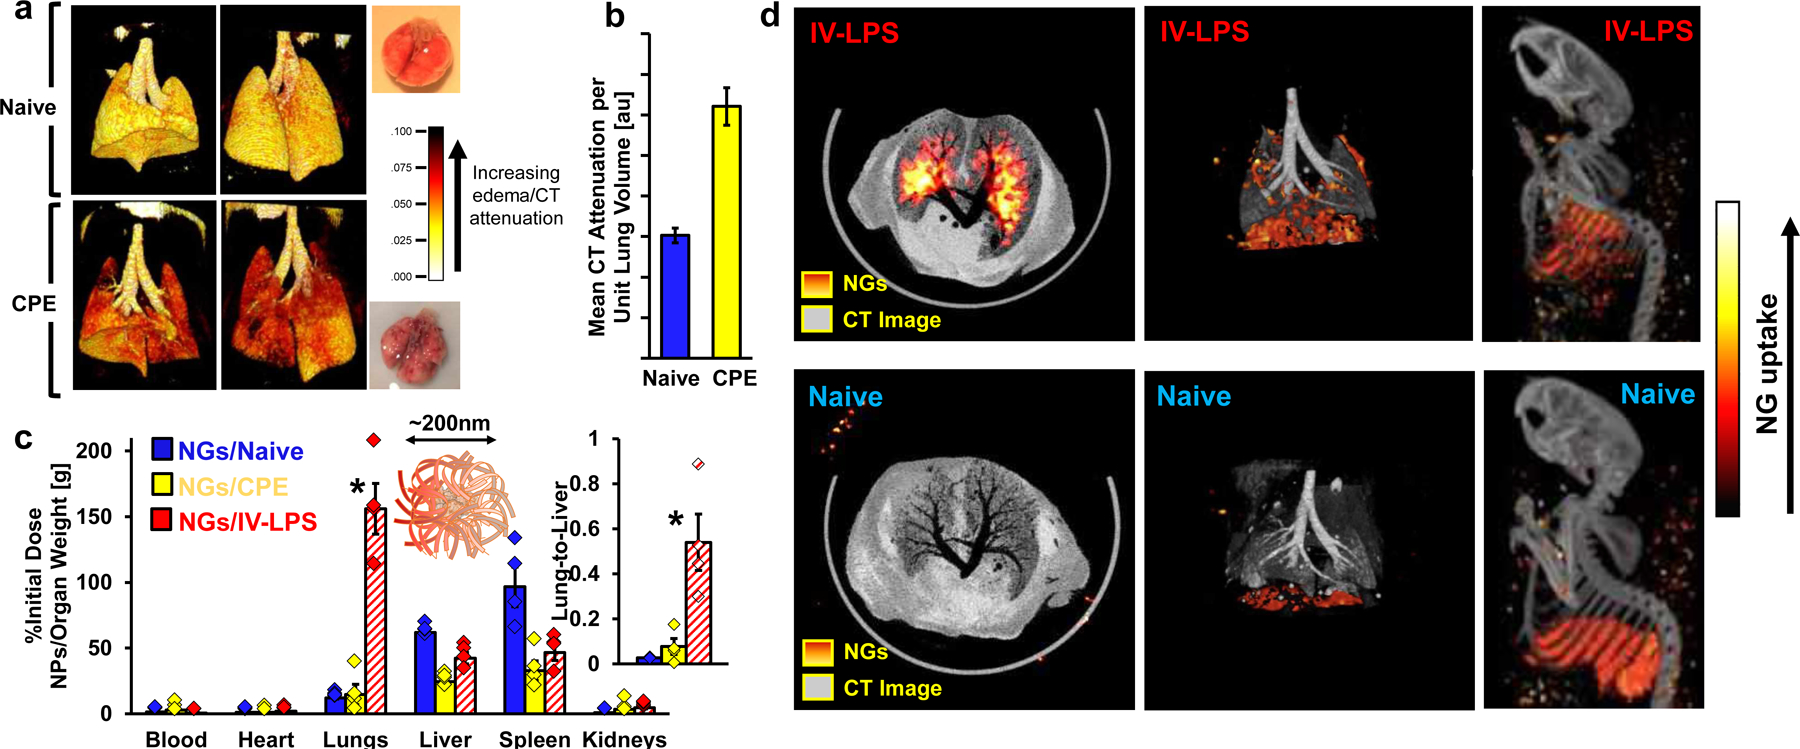
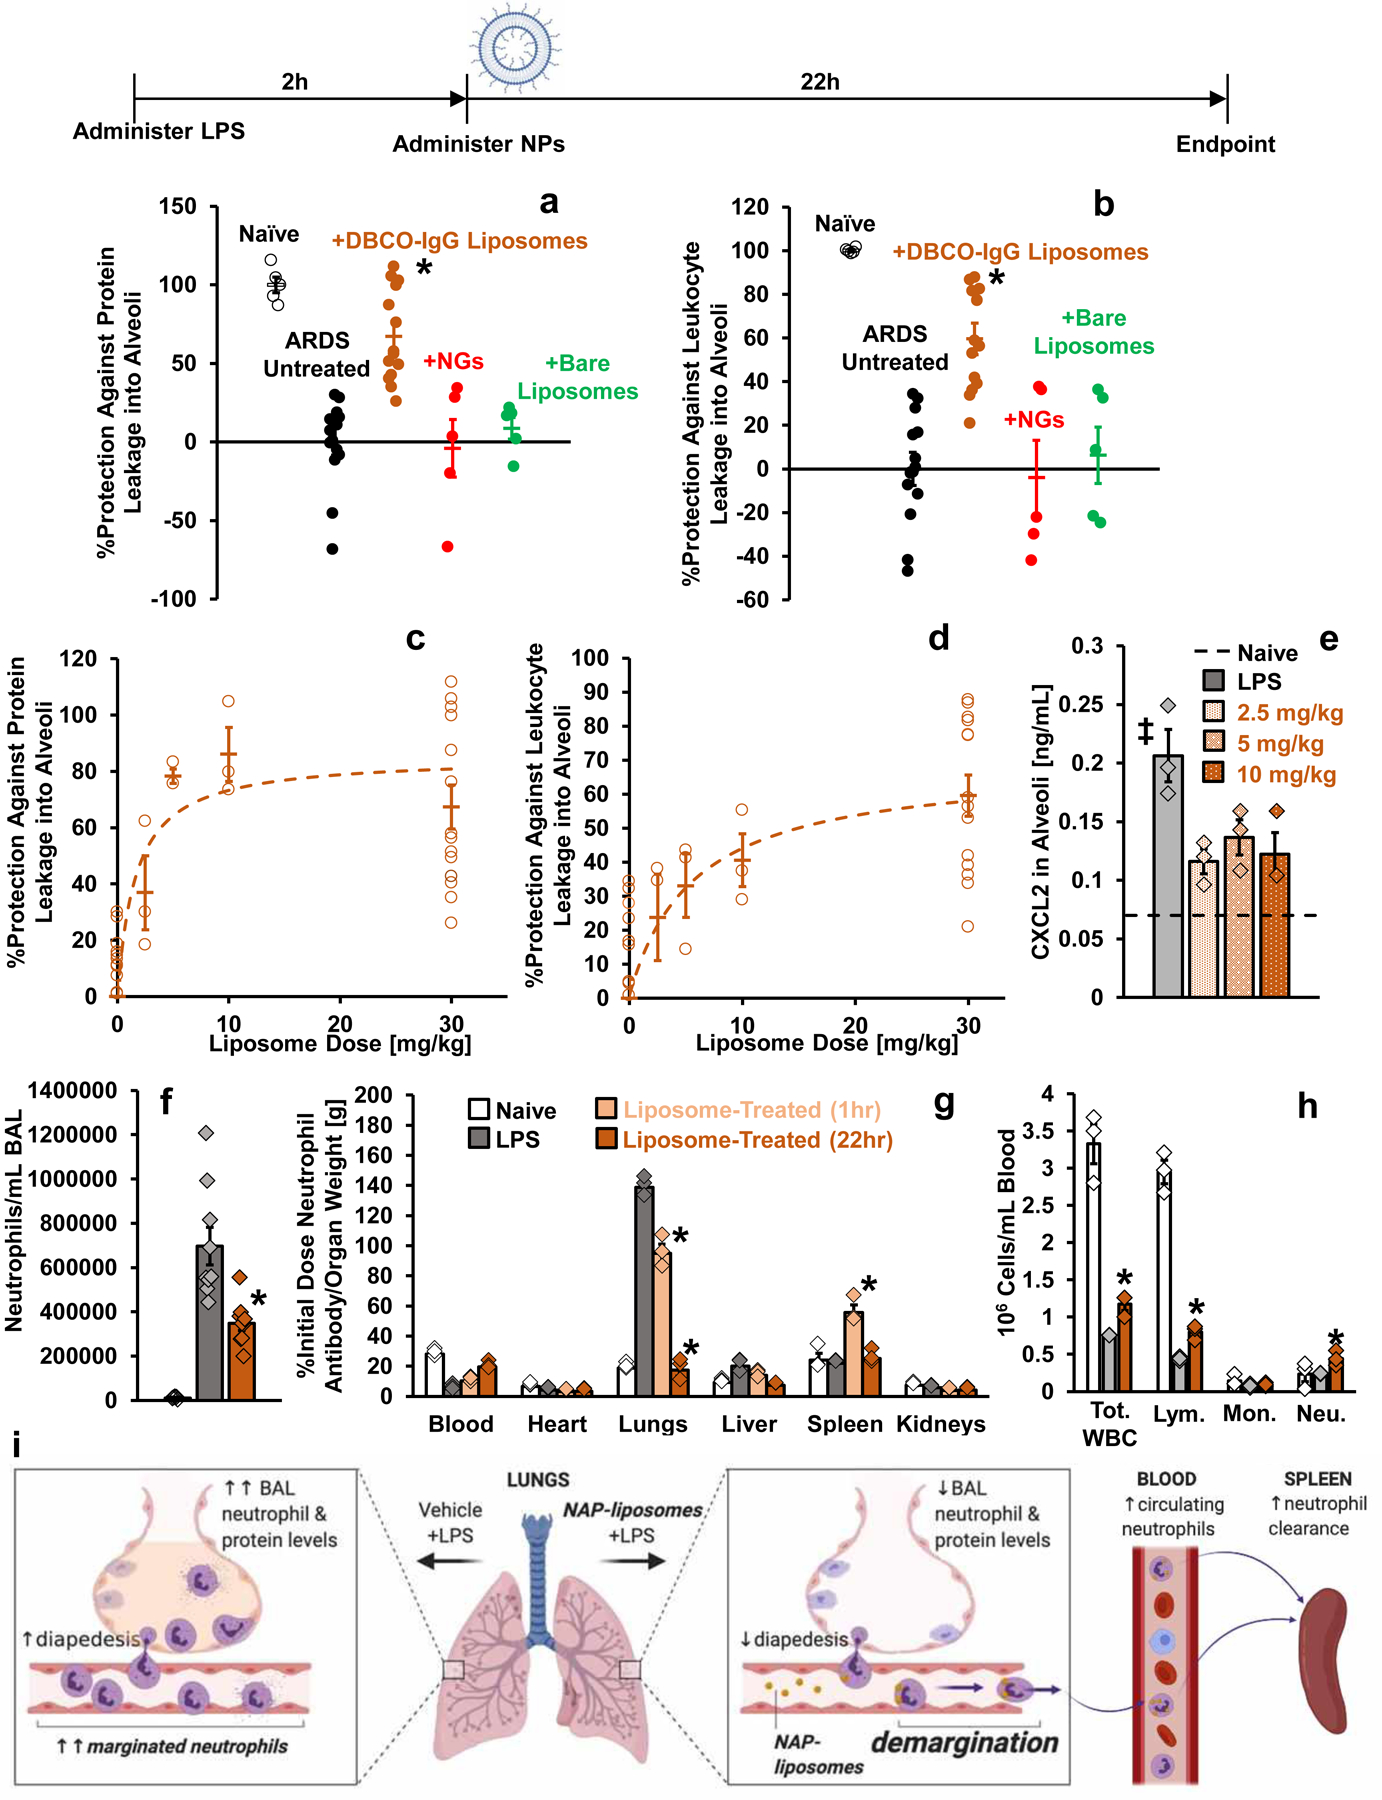
This study shows that the supramolecular arrangement of proteins in nanoparticle structures predicts nanoparticle accumulation in neutrophils in acute lung inflammation (ALI). We observed homing to inflamed lungs for a variety of nanoparticles with agglutinated protein (NAPs), defined by arrangement of protein in or on the nanoparticles via hydrophobic interactions, crosslinking and electrostatic interactions. Nanoparticles with symmetric protein arrangement (for example, viral capsids) had no selectivity for inflamed lungs. Flow cytometry and immunohistochemistry showed NAPs have tropism for pulmonary neutrophils. Protein-conjugated liposomes were engineered to recapitulate NAP tropism for pulmonary neutrophils. NAP uptake in neutrophils was shown to depend on complement opsonization. We demonstrate diagnostic imaging of ALI with NAPs; show NAP tropism for inflamed human donor lungs; and show that NAPs can remediate pulmonary oedema in ALI. This work demonstrates that structure-dependent tropism for neutrophils drives NAPs to inflamed lungs and shows NAPs can detect and treat ALI.


Conflict of interest statement

Competing Interests Statement

Findings in this study contributed to United States provisional patent application number 62/943469, with J.W.M., P.N.P., L.R.W., V.R.M., and J.S.B. as inventors. The remaining authors declare no competing interests.

Figures

Figure 1.
Figure 1.. Lysozyme-Dextran Nanogels and Crosslinked Albumin Nanoparticles Accumulate in Marginated Neutrophils in Inflamed Lungs.
(a) Schematic of neutrophil margination and extravasation in inflamed lungs (created with BioRender.com). (b) Biodistributions of lysozyme-dextran nanogels (NGs) in naïve (n=4 animals) and IV-LPS-affected (n=8 animals) male C57BL/6 mice (red box: p<1×10⁻¹⁰, *: p=0.00008). (c) Biodistributions of PEG-NHS crosslinked human albumin nanoparticles (albumin NPs) in naïve (n=3 animals) and IV-LPS-injured (n=3 animals) mice (red box: p<1×10⁻¹⁰, *: p=0.004). (d-k) Flow cytometry characterization of single cell suspensions prepared from naïve and IV-LPS-affected mouse lungs. (d-e) Vertical axis indicates Ly6G staining for neutrophils and horizontal axis indicates signal from fluorescent NGs (d) or fluorescent albumin NPs (e). (f/h) NG/albumin NP fluorescent signal from neutrophils in IV-LPS-injured mouse lungs (red/pink), compared to naïve lungs (blue) (inset: Flow cytometry data verifying increased neutrophil concentration in IV-LPS-injured mouse lungs (red/pink). (g-h, j-k) Fraction of neutrophils positive for NGs (g) or albumin NPs (j) in naïve or IV-LPS-injured lungs and fraction of NG-positive (h) or albumin NP-positive (k) cells that are neutrophils. For (g-h), NGs/naïve: n=4 animals, NGs/LPS: n=4 animals. For (j-k), albumin NPs/naïve: n=3 animals, albumin NPs/LPS: n=3 animals. (g)*: p=2.6×10⁻⁷. (h)*: p=1.7×10⁻⁵. (j)*: p=0.0006. (k)*: p=0.007. (l-m) Fluorescence micrographs indicating association of NGs (red) with neutrophils (green, Ly6G stain) in the lungs of an IV-LPS-affected mouse (blue, tissue autofluorescence). Data are from histology for two naïve mice and two IV-LPS affected mice. (n) Single frame from real-time intravital imaging of NG (red) uptake in leukocytes (green) in the lungs of one IV-LPS-affected mouse (blue, Alexa Fluor 647-dextran). Statistical significance in (b) and (c) is derived from two-way ANOVA with Sidak’s multiple comparisons test. Statistical significance in (g), (h), (j), and (k) is derived from paired two-tailed t-tests. All error bars indicate mean ± SEM.
Figure 2.
Figure 2.. Screen of Diverse Nanoparticle Biodistributions in Naïve and IV-LPS-Affected Lungs.
(a-c) Nanoparticles with agglutinated protein (NAPs) accumulate in acutely inflamed lungs. (a) Biodistributions of variant NGs indicating uptake of 75 nm NGs (n=4 IV-LPS animals, n=4 naïve animals, red box: p<1×10⁻¹⁰) and 200 nm NGs (n=5 IV-LPS, n=5 naïve, red box: p<1×10⁻¹⁰) in LPS-injured lungs, but not naïve lungs. Data for 130 nm NGs is identical to that presented in figure 1b. (b) Biodistributions of variant crosslinked albumin nanoparticles indicating uptake of albumin nanorods (n=3 IV-LPS animals, n=3 naïve animals, red box: p<1×10⁻¹⁰) and bovine albumin nanoparticles (n=3 IV-LPS animals, n=3 naïve animals, red box: p<1×10⁻¹⁰) in LPS-injured, but not naïve lungs. Data for human albumin nanoparticles is identical to that presented in figure 1c. (c) Biodistributions of charge-agglutinated protein nanoparticles, indicating uptake of particles comprised of glutamate-tagged green fluorescent protein (E-GFP) and guanidine-tagged poly(oxanorborneneimide) (PONI) or particles comprised of E-GFP and guanidine-tagged gold nanoparticles (Au) in LPS-injured (PONI: n=5 animals, Au: n=3 animals), but not naïve (PONI: n=4 animals, Au: n=3 animals) lungs. PONI/E-GFP data reflects tracing of both 131I-labeled PONI and 125I-labeled E-GFP. For PONI tracer data, red box p<1×10⁻¹⁰. For E-GFP tracer data, red box: p=0.0003. For Au/E-GFP data, red box: p=1.6×10⁻⁹. (d) Nanoparticles based on symmetric supramolecular arrangement of protein do not have tropism for inflamed lungs (schematics created with BioRender.com). Biodistributions of adenovirus (n=5 IV-LPS animals, n=5 naïve animals, blue box: p=0.88), adeno-associated virus (n=3 IV-LPS animals, n=3 naïve animals, blue box: p=0.56), and ferritin nanocages (n=5 IV-LPS animals, n=5 naïve animals, blue box: p=0.35) indicating no selectivity for LPS-injured vs. naïve lungs. (e) Biodistributions of bare liposomes (schematic created with BioRender.com, n=4 IV-LPS animals, n=4 naïve animals) indicating no selectivity for LPS-injured vs. naïve lungs (blue box: p=0.31). Biodistributions of IgG-coated polystyrene nanoparticles indicating low levels of uptake in both naïve (n=4 animals) and LPS-injured (n=4 animals) lungs (blue box: p=0.0004). Statistical significance in all panels is derived from two-way ANOVA with Sidak’s multiple comparisons test. All error bars indicate mean ± SEM.
Figure 3.
Figure 3.. Engineering of Liposome Surface Chemistry to Confer NAP-like Behavior in LPS-Inflamed Lungs.
(a) Schematic of antibody-coated liposomes prepared via copper-free click reaction of azide-functionalized liposomes with dibenzocyclooctyne (DBCO)-functionalized IgG (liposome schematic created with BioRender.com). (b) Biodistributions in IV-LPS-injured mice for bare liposomes (n=3 animals), liposomes conjugated to IgG via SATA-maleimide chemistry (n=3 animals), and liposomes conjugated to IgG via DBCO-azide chemistry (n=3 animals) (red box: p<1×10⁻¹⁰ for DBCO-IgG liposomes vs. bare liposomes and DBCO-IgG liposomes vs. SATA-IgG liposomes). (c) Mouse lungs flow cytometry data indicating Ly6G anti-neutrophil staining density vs. levels of DBCO-IgG liposome uptake. (d) Flow cytometry data verifying increased DBCO-IgG liposome uptake in and selectivity for neutrophils following LPS insult. Inset: Verification of increased concentration of neutrophils in the lungs following LPS. (e) Fraction of neutrophils positive for DBCO-IgG liposomes in naïve (n=3 animals) or IV-LPS-injured (n=3 animals) lungs (*: p=0.0003) and fraction of DBCO-IgG liposome-positive cells that are neutrophils (*: p=1.7×10⁻⁶) (f) Biodistributions in IV-LPS-injured mice for azide-functionalized liposomes conjugated to IgG loaded with 2.5 (n=3 animals), 5 (n=3 animals), 10 (n=4 animals), and 20 DBCO molecules per IgG (n=3 animals, red box: p<1×10⁻¹⁰ for DBCO(20X)-IgG liposomes compared to each of the other DBCO density groups). Statistical significance in (b) and (f) is derived from two-way ANOVA with Tukey’s multiple comparisons test. Statistical significance in (e) is derived from paired two-tailed t-tests. All error bars indicate mean ± SEM.
Figure 4.
Figure 4.. Complement Opsonization of NAPs is Necessary for NAP Uptake in Neutrophils.
(a) Flow cytometry data indicating neutrophils take up lysozyme-dextran nanogels (NGs) after NG incubation in mouse serum (n=18 biological replicates) but not after NG incubation in buffer (n=18 biological replicates, *: p=6.9×10⁻⁹). (b) Mass spectrometry characterization of proteins adsorbed on NGs after incubation with mouse serum as in (a). Plotted data indicates the concentration of detected peptides associated with the five most abundant proteins on serum-incubated NGs (n=3 serum/NG preparations). Complement proteins are highlighted in red text. (c-d) Flow cytometric assessment of NG uptake in mouse neutrophils after NG incubation with; buffer; mouse serum; heat-treated mouse serum and; mouse serum treated with cobra venom factor. Example histograms of NG fluorescence in neutrophils for different serum conditions are depicted in (c). Data reflecting NG mean fluorescence in neutrophils for different serum conditions is plotted in (d). In (d), bars with blue stripes indicate naïve neutrophils (n=18 biological replicates for naïve serum, n=10 for heat-treated serum, n=11 for CVF-treated serum) and bars with red stripes indicate LPS-stimulated neutrophils (n=12 biological replicates for naïve serum, n=5 for heat-treated serum, n=7 for CVF-treated serum). For comparison to normal serum/naïve, *: p<1×10⁻¹⁰ and §: p<1×10⁻¹⁰. For comparison to normal serum/LPS, ‡: p=7.3×10⁻¹⁰ and #: p=3.7×10⁻⁹. (e) Biodistributions of NGs in; naïve mice (n=4 animals); mice treated with CVF (n=4 animals); mice treated with IV LPS (n=4 animals) and; mice treated with IV LPS and CVF (n=4 animals). Naïve and IV-LPS data is identical to that presented in supplementary figure 13, upper right panel. For comparison between LPS and CVF + LPS groups, *: p=1.6×10⁻¹⁰. (f) Mass spectrometry characterization of complement opsonization of NGs (n=3 serum/NG preparations) and human adenovirus (n=3 serum/adenovirus preparations). Peptide count data as in (b) is normalized to peptide counts on NGs incubated with complement-depleted CVF-treated serum. Relative complement quantities below zero indicate complement opsonization at lower levels than on NGs after treatment with complement-depleted serum. Statistical significance in (a) is derived from paired two-tailed t-tests. Statistical significance in (d) is derived from one-way ANOVA with Tukey’s multiple comparisons test. Statistical significance in (e) is derived from two-way ANOVA with Tukey’s multiple comparisons test. All error bars indicate mean ± SEM.
Figure 5.
Figure 5.. Specificity of NAPs for LPS-Inflamed Lungs vs. Edematous Lungs and SPECT Imaging of NAPs in LPS-Inflamed Lungs.
(a) Three-dimensional reconstructions of chest CT data for naïve mouse lungs and lungs with cardiogenic pulmonary edema (CPE). White/yellow indicates lower attenuation, corresponding to airspace in healthy lungs. Red/dark background indicates higher attenuation, corresponding to fluid in the lungs. (b) Quantification of CT attenuation in naive (blue) and edematous (yellow) lungs, averaged across axial slices (individual slice values in supplementary figure 32). (c) Biodistributions of 200 nm lysozyme-dextran nanogels in naïve mice, mice treated with IV-LPS, and mice subject to cardiogenic pulmonary edema (n=4 animals). Naïve and IV-LPS data is identical to that presented in supplementary figure 13, upper right panel. For comparison of CPE and IV-LPS values, *: p<1×10⁻¹⁰ for main panel and p=0.005 for inset. (d) Co-registered CT (greyscale) and SPECT (red-yellow) images indicating 111In- labeled lysozyme-dextran nanogel uptake in a naïve and an IV-LPS-affected mouse. White/yellow indicates more nanogel uptake. Red/dark background indicates less lysozyme-dextran nanogel uptake. Statistical significance in (c) is derived from two-way ANOVA with Tukey’s multiple comparisons test. All error bars indicate mean ± SEM.
Figure 6.
Figure 6.. Effects of NAPs in Model Acute Respiratory Distress Syndrome.
Timeline: Nanoparticles or vehicle were administered as an IV bolus two hours after nebulized LPS administration (Liposome schematic created with BioRender.com). (a-b) Bronchoalveolar lavage fluid (BALF) was harvested 22 hours after nanoparticle (30 mg/kg) or vehicle administration. (a) Protein concentration in BALF, reflecting quantity of edema in naïve mice (n=5 animals), sham-treated mice with model ARDS (n=15 animals), and mice with model ARDS treated with DBCO-IgG liposomes (n=14 animals), NGs (n=5 animals), or bare PEGylated liposomes (n=5 animals). *: p=6.6×10⁻⁷, 0.0001, and 0.002 for comparison of DBCO-IgG liposome treatment with sham treatment, NG treatment, and bare liposome treatment, respectively. (b) Concentration of leukocytes in BALF for same groups as in (a). *: p=1.1×10⁻⁶, 0.0001, and 0.002 for comparison of DBCO-IgG liposome treatment with sham treatment, NG treatment, and bare liposome treatment, respectively. Quantities in (a-b) are represented as degree of protection against infiltration into alveoli, extrapolated from levels in naïve mice (100% protection) and untreated mice with model ARDS (0% protection). (c-d) Dose-response for edema (c) and leukocyte infiltration (d) in alveoli of ARDS mice treated with DBCO-IgG liposomes. Data were obtained as in (a-b), but with different liposome doses (n=3 animals for 2.5 mg/kg, 5 mg/kg, and 10 mg/kg liposome doses). (e) Chemokine CXCL2 levels in alveoli of LPS-injured mice with and without DBCO-IgG liposome treatment (n=3 animals for all groups). Dashed line indicates CXCL2 levels in alveoli of naïve mice. ‡: p=0.024, 0.079, and 0.034 for comparison of sham treatment with 2.5 mg/kg, 5 mg/kg, and 10 mg/kg DBCO-IgG liposomes treatment, respectively. (f) Concentration of neutrophils in BALF of naïve mice (n=5 animals), mice with model ARDS (n=9 animals), and mice with model ARDS dosed with 30 mg/kg DBCO-IgG liposomes (n=9 animals). For comparison of DBCO-IgG liposome treatment to sham treatment, *: p=0.009. (g) Biodistributions of anti-Ly6G antibody in naïve mice (n=3 animals), LPS-injured mice (n=3 animals), and mice treated with 10 mg/kg DBCO-IgG liposomes, with organs sampled at 1 hour after treatment (n=3 animals) or 22 hours after treatment (n=3 animals). Naïve and untreated LPS-affected data are identical to data in supplementary figure 1a. *: p<1×10⁻¹⁰ for all comparisons of anti-Ly6G uptake in lungs or spleen of liposome-treated mice vs. sham treated mice. (h) Complete blood count analysis of circulating leukocyte concentrations in naïve mice (n=3 animals), LPS-injured mice (n=3 animals), and mice treated with 10 mg/kg DBCO-IgG liposomes, with blood sampled 22 hours after treatment (n=3 animals). *: p=0.019, 0.025, and 0.047 for comparison of DBCO-IgG liposome-treated to sham-treated values for total white blood cell, lymphocyte, and neutrophil counts, respectively. (i) Schematic for the fate of neutrophils in mice with model ARDS, with and without DBCO-IgG liposome treatment, based on data in (f-h) (created with BioRender.com). Statistical significance in (a), (b), (e), and (f) is derived from one-way ANOVA with Tukey’s multiple comparisons test. Statistical significance in (g-h) is derived from two-way ANOVA with Tukey’s multiple comparisons test. All error bars indicate mean ± SEM.

Comment in

References

    1. Wright HL, Moots RJ, Bucknall RC & Edwards SW Neutrophil function in inflammation and inflammatory diseases. Rheumatology 49, 1618–1631 (2010). - PubMed
    1. Sônego F et al. Paradoxical roles of the neutrophil in sepsis: protective and deleterious. Front. Immunol 7, 155 (2016). - PMC - PubMed
    1. Jickling GC et al. Targeting neutrophils in ischemic stroke: translational insights from experimental studies. J. Cereb. Blood Flow Metab 35, 888–901 (2015). - PMC - PubMed
    1. Mehta J et al. Neutrophil function in ischemic heart disease. Circulation 79, 549–556 (1989). - PubMed
    1. Grommes J & Soehnlein O Contribution of neutrophils to acute lung injury. Mol Med 17, 293–307 (2011). - PMC - PubMed

Publication types

MeSH terms